- Market Value (2025): USD 5.8 Bn
- Estimated Value (2026): USD 6.2 Bn
- Forecast Value (2036): USD 11.4 Bn
- CAGR (2026-2036): 6.3%
What is the Specialty Ingredients Market forecast to be worth by 2036?
USD 6.2 billion in 2026 to USD 11.4 billion by 2036 at 6.3% CAGR.
- The specialty ingredients market crossed USD 5.8 billion in 2025 as formulation work increased across packaged foods.
- Demand is projected to increase from USD 6.2 billion in 2026 to USD 11.4 billion by 2036.
- The market is forecast to record 6.3% CAGR from 2026 to 2036 as brands prioritize function, texture and taste consistency.
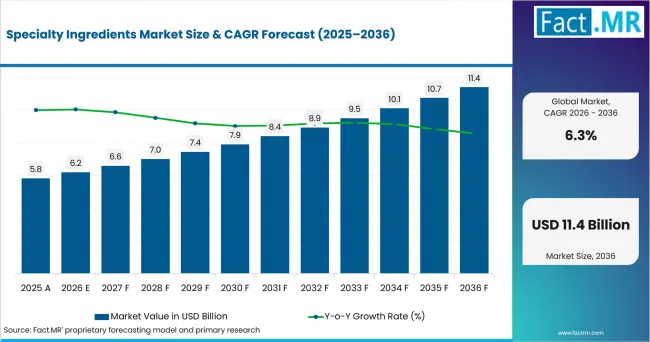
Specialty Ingredients Market Value Analysis | Source: Fact.MR
What are the defining numbers behind Specialty Ingredients Market growth?
USD 5.2 billion absolute opportunity by 2036, led by Functional Food Ingredients, Food & Beverage Applications and Food Manufacturers.
- Demand Drivers in the Market
- Food manufacturers need fortification systems that protect nutrition claims and taste.
- Beverage brands need flavor and sweetening systems that reduce sugar without bitterness.
- Dairy and bakery companies need stabilizers that protect texture during processing and storage.
- Contract manufacturers need technical support as ingredient forms behave differently.
- Key Segments Analyzed
- By Product: Functional Food Ingredients are expected to hold 44.80% share in 2026 owing to fortification, fiber enrichment and targeted nutrition use.
- By Application: Food & Beverage Applications are projected to account for 73.60% share in 2026 as brands reformulate core packaged categories.
- By End Use: Food Manufacturers are anticipated to capture 52.90% share in 2026 since industrial recipes need repeatable ingredient performance.
- By Technology: Extraction Technology is estimated to represent 36.90% share in 2026 due to botanical, flavor and functional compound recovery.
- By Formulation: Powder Form Ingredients are forecast to hold 61.70% share in 2026 because powders support dosage control and longer storage.
- By Distribution Channel: Direct B2B Sales are expected to account for 57.40% share in 2026 as manufacturers prefer technical proof before approval.
- Analyst Opinion at Fact.MR
- Shambhu Nath Jha, Principal Consultant at Fact.MR, states, "Specialty ingredient buying is becoming more technical because brands need taste, label and processing proof together. Suppliers are expected to win approvals when they can show stable performance in the final recipe. Better commercial cases combine application support, clean documentation and repeatable delivery."
- Strategic Implications
- Formulators should test ingredients inside the final recipe before approval.
- Suppliers should document taste, texture, allergens and processing limits.
- Manufacturers should compare forms against storage and line-cleaning needs.
- Distributors should build application support around bakery, dairy and beverage customers.
Germany is expected to record 7.3% CAGR through 2036 due to reformulation targets and branded food manufacturing. Brazil is projected to post 6.6% CAGR as processors raise functional ingredient use. The USA is anticipated to advance at 6.0% CAGR supported by packaged food scale. The UK is forecast to reach 5.4% CAGR as clean-label reformulation continues. Japan is estimated to record 4.7% CAGR owing to export quality needs and compact food manufacturing.
How does the Specialty Ingredients Market break down by segment?
Functional Food Ingredients lead at 44.80%; Food & Beverage Applications lead at 73.60%.
Which product dominates?
Functional Food Ingredients hold 44.80% share in 2026.
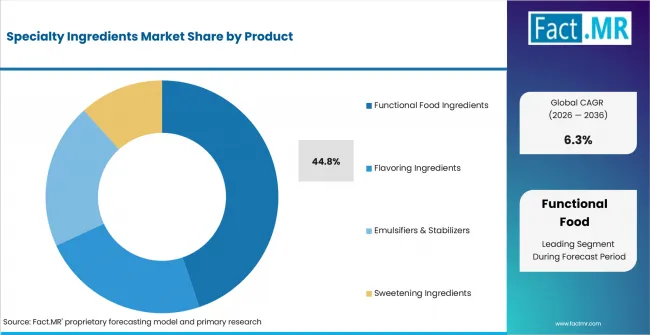
Specialty Ingredients Market Analysis By Product | Source: Fact.MR
Functional Food Ingredients are expected to lead Product as brands connect nutrition claims with acceptable taste. Fortification supports vitamins, minerals and fiber enrichment. Flavoring ingredients and emulsifier systems remain tied to repeat purchases because shoppers notice taste and mouthfeel quickly. Product teams therefore need ingredients that work inside normal processing conditions.
What leads the Application segment?
Food & Beverage Applications hold 73.60% share in 2026.
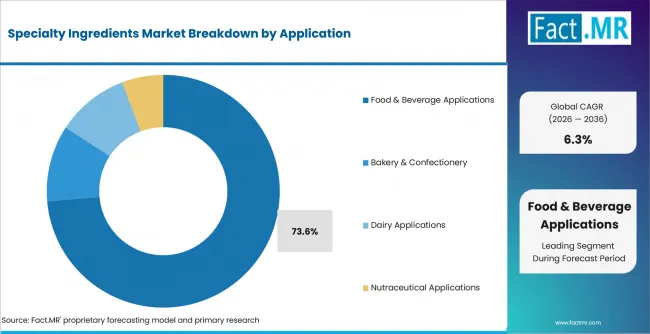
Specialty Ingredients Market Analysis By Application | Source: Fact.MR
Food & Beverage Applications are projected to lead Application as ingredients are approved inside finished products. Processed foods use stabilizers, fibers and flavor systems. Tate & Lyle used IFT FIRST 2025 to present an expanded portfolio and a new Mouthfeel Lab.
How does End Use shape demand?
Food Manufacturers hold 52.90% share in 2026.
Food Manufacturers are anticipated to lead End Use as they control trials, approvals and line testing. Packaged food producers need stable systems across plants. Beverage manufacturers use flavors and sweeteners when taste varies after sugar reduction. Nutraceutical firms require coatings and carriers that make active ingredients easier to consume.
What supports Extraction Technology?
Extraction Technology holds 36.90% share in 2026.
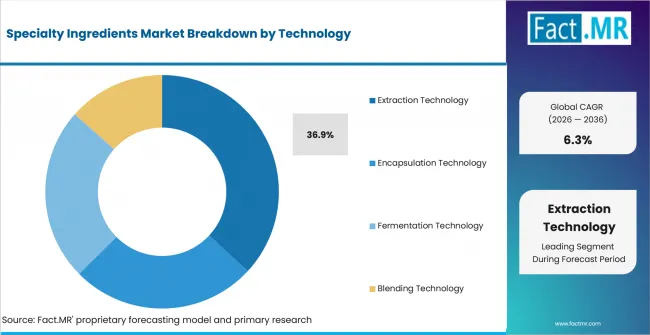
Specialty Ingredients Market Analysis By Technology | Source: Fact.MR
Extraction Technology is estimated to lead Technology as many specialty ingredients start with botanical or flavor recovery. Encapsulation, fermentation and blending follow when stability decides approval. Processors value extraction systems when flavor intensity and batch consistency decide product release.
What supports Powder Form Ingredients?
Powder Form Ingredients hold 61.70% share in 2026.
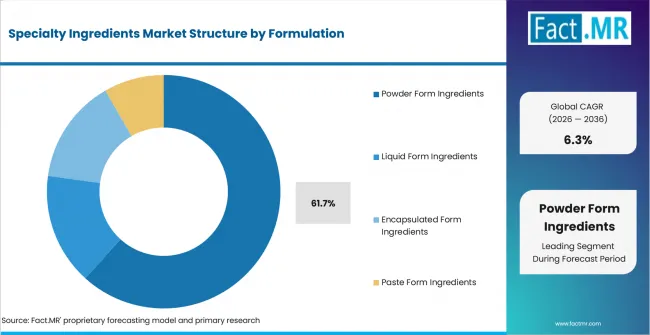
Specialty Ingredients Market Analysis By Formulation | Source: Fact.MR
Powder Form Ingredients are forecast to lead Formulation because powders are easy to dose, ship and store. Spray dried powders support flavors and dairy notes. Liquid, encapsulated and paste forms remain relevant where process timing or controlled release is needed. Roquette introduced AMYSTA L 123 in October 2025 as a label-friendly soluble pea starch for food applications.
How does Distribution Channel shape access?
Direct B2B Sales hold 57.40% share in 2026.
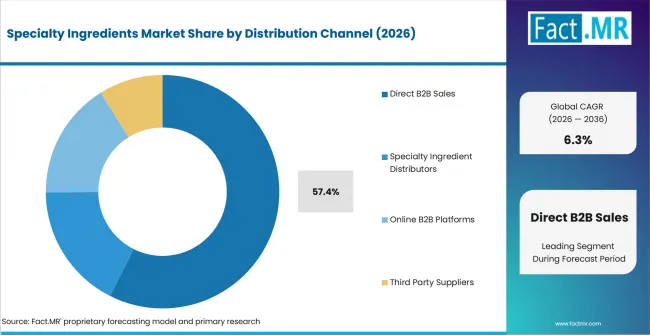
Specialty Ingredients Market Analysis By Distribution Channel | Source: Fact.MR
Direct B2B Sales are expected to lead Distribution Channel because ingredients need technical evaluation before approval. Direct supply gives brands access to application teams. Specialty distributors remain useful where smaller customers need samples and troubleshooting. Cargill used AAHAR 2025 in March 2025 to showcase food solutions for snacks and bakery. The same showcase covered confectionery, dairy and ice cream.
What is accelerating Specialty Ingredients Market adoption, and what is holding it back?
Functional reformulation drives it; cost and documentation pressure restrain it.
Drivers Impact Analysis
| DRIVER | (~) % IMPACT ON CAGR | GEOGRAPHIC RELEVANCE | IMPACT TIMELINE |
|---|---|---|---|
| Functional food reformulation | +1.6% | USA, Germany, UK | Short term (<= 2 years) |
| Texture and stability needs | +1.3% | Packaged food and dairy markets | Short term (<= 2 years) |
| Sugar and salt reduction | +1.1% | Germany, USA, UK | Medium term (2-4 years) |
| B2B application support | +0.8% | Global food manufacturers | Medium term (2-4 years) |
| Nutraceutical positioning | +0.6% | USA and Japan | Long term (>= 4 years) |
- Functional food reformulation: Brands are expected to use fibers, proteins, minerals and botanical extracts to add function without moving away from familiar product formats.
- Texture and stability needs: Dairy, bakery and beverage products require emulsifiers and hydrocolloids when fat, sugar or protein levels change. Reformulation changes water binding and mouthfeel.
- Sugar and salt reduction: Policy and retailer pressure keep reduced-sugar and reduced-salt projects active across processed foods. Sweetening systems, flavor maskers and salt-enhancement tools help brands manage taste gaps.
Opportunity Impact Analysis
| OPPORTUNITY | (~) % IMPACT ON CAGR | GEOGRAPHIC RELEVANCE | IMPACT TIMELINE |
|---|---|---|---|
| Clean-label texture systems | +0.9% | Europe, USA, Japan | Medium term (2-4 years) |
| Plant-based dairy and bakery | +0.7% | UK, Germany, Brazil | Medium term (2-4 years) |
| Encapsulated flavors and actives | +0.6% | USA and Japan | Long term (>= 4 years) |
| Digital ingredient procurement | +0.4% | USA and UK | Long term (>= 4 years) |
- Clean-label texture systems: Food producers are expected to look for starches, gums and emulsifiers that support shorter labels. The primary opportunity is concentrated where texture loss appears after fat or sugar reduction.
- Plant-based dairy and bakery: Plant-based dairy alternatives and bakery systems need stabilizers, proteins and flavors that protect texture. These applications also create demand for extraction and blending know-how. Ingredient firms with regional bakery and dairy teams are expected to hold an advantage.
- Encapsulated flavors and actives: Encapsulation supports delayed release, taste masking and protection from heat or moisture. It is useful in supplements, beverages and bakery inclusions. The opportunity depends on cost control because encapsulated forms often cost more than basic powders.
Restraints Impact Analysis
| RESTRAINT | (~) % IMPACT ON CAGR | GEOGRAPHIC RELEVANCE | IMPACT TIMELINE |
|---|---|---|---|
| Premium ingredient cost | -0.9% | Global | Short term (<= 2 years) |
| Regulatory documentation | -0.7% | USA, Europe, Japan | Short term (<= 2 years) |
| Formula switching risk | -0.6% | Large food manufacturers | Medium term (2-4 years) |
| Raw-material variability | -0.5% | Botanical and natural flavor chains | Long term (>= 4 years) |
- Regulatory documentation: Additives, colors, flavor systems and nutrition claims need clear technical files before approval.
- Formula switching risk: Large manufacturers avoid ingredient changes that create taste drift or line problems. Even a lower-cost alternative needs validation across shelf life and processing. That cycle delays adoption when the current ingredient performs adequately.
- Raw-material variability: Natural extracts and botanical inputs face seasonal variation in active content, color and flavor. The risk is higher where buyers ask for natural positioning and tight sensory targets. Suppliers need tighter sourcing controls and blending practices to protect consistency.
Which countries are scaling Specialty Ingredients Market fastest?
- Germany remains 0.7 percentage point above Brazil as reformulation pressure and branded food manufacturing favor higher-value ingredient systems.
- Brazil remains 0.6 percentage point above the USA because beverage, juice and bakery processors add functionality for domestic and export products.
- The USA remains 0.6 percentage point above the UK as packaged food scale creates more trials for flavors, powders and stabilizers.
- The UK remains 0.7 percentage point above Japan because clean-label reformulation and distributor service support steady ingredient replacement.
- The 2026 country values are USD 2.24936 billion for the USA, USD 0.319 billion for Japan and USD 0.187302 billion for South Korea.
Comparable CAGRs create different entry conditions because food regulations, processing scale and distributor depth vary by country.
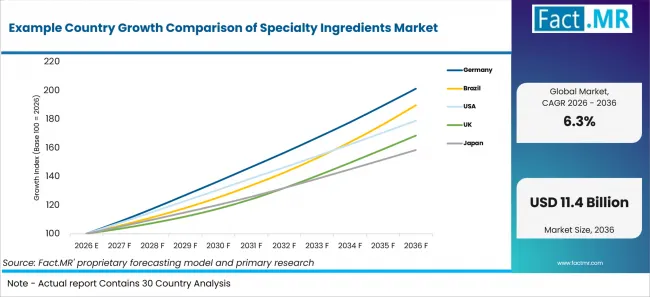
Example Country Growth Comparison Of Specialty Ingredients Market | Source: Fact.MR
| COUNTRY | CAGR (2026-2036) |
|---|---|
| Germany | 7.3% |
| Brazil | 6.6% |
| USA | 6.0% |
| UK | 5.4% |
| Japan | 4.7% |
What supports Germany adoption?
7.3% CAGR, supported by reformulation targets and branded food manufacturing.
Germany’s growth is supported by reformulation activity and branded food manufacturing. German food manufacturers require extraction and encapsulation records to support label accuracy and ingredient disclosure, while direct B2B sales suit brand owners that require technical batches, shelf-life tests and sensory trials.
How is Brazil scaling demand?
6.6% CAGR, shaped by food processing, dairy scale and regional formulation needs.
Brazil’s growth is shaped by food processing, dairy scale and regional formulation requirements. In 2025, Brazil's agribusiness sector achieved a historic milestone with exports totaling USD 169.2 billion, driven by record shipment volumes despite softer global prices. Import dependence for selected hydrocolloids and flavor molecules exposes processors to currency costs, while regulatory documentation can slow claims around fiber enrichment and functional fortification.
What supports USA adoption?
6.0% CAGR, led by packaged food scale and reformulation depth.
The USA’s growth is supported by packaged food scale and extensive reformulation activity. Beverage and packaged food producers use encapsulated flavors and powders for sensory consistency, while direct B2B sales fit U.S. procurement because national brands require specifications and sample support.
How does the UK perform?
5.4% CAGR, supported by food manufacturing depth and distributor service.
The UK’s growth is supported by its food manufacturing base and specialist distributor network. According to Defra's official food chain metrics, employment in the agri-food sector stands at approximately 4.1 million people as of late 2025. Clean-label and nutrition targets support fiber enrichment, sweetening systems and texture tools, while UK ingredient distributors remain relevant because manufacturers need technical advice for specialty blends.
What supports Japan’s growth?
4.7% CAGR, backed by export quality needs and compact food manufacturing.
Japan’s growth is backed by export quality requirements and compact food manufacturing systems. MAFF reported Japan’s food-related exports of 1.7005 trillion yen in 2025, up 12.8%. Japan’s Statistics Bureau reported average monthly household consumption expenditure of 314,001 yen in 2025, up 4.6% in nominal terms. Powder and encapsulated forms fit Japanese production because brands value portion control, while specialty distributors help smaller manufacturers handle imported botanicals and niche sweeteners.
Who leads the Specialty Ingredients Market?
Kerry, Cargill, Tate & Lyle, Ingredion, ADM, Roquette and Sensient show the clearest direct relevance.
Competition is shaped by ingredient breadth, application support and recipe proof. The provider set covers taste and texture portfolios. It also spans nutrition and sweetening systems with direct relevance to this market. Suppliers with local technical teams are expected to gain approval faster because food manufacturers test ingredients in live recipes before switching.
Which companies are the key providers?
Key companies include Kerry Group plc, Cargill Incorporated, Tate & Lyle PLC, Ingredion Incorporated, Archer-Daniels-Midland Company, Roquette Frères S.A. and Sensient Technologies Corporation.
- Kerry Group plc
- Cargill Incorporated
- Tate & Lyle PLC
- Ingredion Incorporated
- Archer-Daniels-Midland Company
- Roquette Frères S.A.
- Sensient Technologies Corporation
Bibliography
- Ministry of Agriculture and Livestock. (2026, January 8). Brazilian agribusiness closes 2025 with record exports of USD 169.2 billion and surplus of USD 149.07 billion.
- Bureau of Labor Statistics. (2026, January 9). The employment situation - December 2025.
- Bureau of Labor Statistics. (2026, January 13). Consumer Price Index - December 2025.
- Cargill. (2025, March 4). Cargill showcases full range of innovative food solutions at AAHAR 2025.
- Department for Environment, Food & Rural Affairs. (2026, July 29). Food statistics in your pocket.
- Eurostat. (2026, July 20). HICP inflation rate—Food and non-alcoholic beverages—Annual rate of change, Germany, monthly [Data set]. ECB Data Portal.
- U.S. Food and Drug Administration. (2025, August 19). FDA update on post-market assessment of chemicals in the food supply.
This Report Answers
- The report provides strategic intelligence on product, application and channel choices.
- Segment analysis covers Functional Food Ingredients and Food & Beverage Applications as the share leaders within the 2026 market.
- Country outlook evaluates Germany, Brazil, the USA, the UK, Japan and South Korea.
- Competitive analysis profiles Kerry, Cargill, Tate & Lyle, Ingredion, ADM, Roquette and Sensient.
- Technology assessment covers Extraction Technology, Encapsulation Technology, Fermentation Technology and Blending Technology.
What does the Specialty Ingredients Market cover?
Specialty ingredients are used when food and beverage products need nutrition, taste, texture or shelf stability. The scope connects with functional foods, food additives, food stabilizers, clean-label emulsifiers and functional bakery ingredients.
The market covers flavors fragrances, sweeteners and fermented ingredients when these inputs support food and beverage formulation.
What is included in the scope?
The scope includes food, beverage, dietary supplements and nutraceuticals buyers when ingredients enter edible formulations.
Distribution coverage includes direct B2B sales, distributors, online platforms and third-party suppliers.
What is excluded from the scope?
Bulk commodities without a specialty function remain outside the scope. Raw sugar, commodity flour and basic edible oils are excluded unless processed into specialty formulation systems.
The scope excludes pharmaceutical actives, cosmetic ingredients and industrial chemicals that do not enter food or beverage formulations.
How Was the Analysis Built?
The analysis draws on 120+ sources, 35+ company portfolios and more than 20 industry interviews.
- Primary Research: Primary research includes discussions with ingredient suppliers, food manufacturers, beverage brands, distributors, product developers, procurement teams and subject-matter experts. These discussions examine supplier selection, product approval, formulation needs, cost pressure and the factors that influence wider market acceptance.
- Desk Research: Desk research covers government statistics, regulator publications, company announcements, product portfolios, trade data, industry associations and standards. Every source used in the analysis is documented in the bibliography.
- Market Sizing and Forecasting: Market estimates combine historical performance, demand indicators, pricing and volume trends, segment shares, company participation, country-level growth, adoption patterns and barriers to market expansion.
- Data Validation and Update Cycle: Findings are validated by comparing interviews with public data, company activity, regulatory changes and official statistics. Regular updates review new product launches, capacity changes, approvals, procurement trends and shifts in commercial adoption.
What is the report’s scope and coverage?
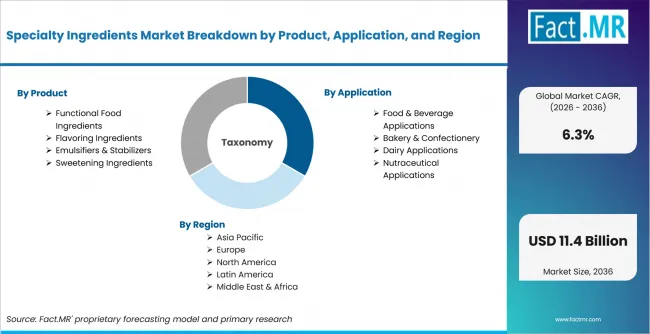
Specialty Ingredients Market Breakdown By Product, Application, And Region | Source: Fact.MR
| ATTRIBUTE | DETAILS |
|---|---|
| Quantitative Units | USD billion |
| Market Definition | Specialty food and beverage ingredients that add nutrition, taste, texture, stability and process control where formulation performance determines supplier approval |
| Product | Functional Food Ingredients; Flavoring Ingredients; Emulsifiers & Stabilizers; Sweetening Ingredients |
| Application | Food & Beverage Applications; Bakery & Confectionery; Dairy Applications; Nutraceutical Applications |
| End Use | Food Manufacturers; Nutraceutical Companies; Dairy & Bakery Companies; Food Service Industry |
| Technology | Extraction Technology; Encapsulation Technology; Fermentation Technology; Blending Technology |
| Formulation | Powder Form Ingredients; Liquid Form Ingredients; Encapsulated Form Ingredients; Paste Form Ingredients |
| Distribution Channel | Direct B2B Sales; Specialty Ingredient Distributors; Online B2B Platforms; Third Party Suppliers |
| Regions Covered | North America; Latin America; Europe; East Asia; South Asia and Pacific; Middle East and Africa |
| Countries Covered | Germany; Brazil; USA; UK; Japan; South Korea |
| Key Companies Profiled | Kerry Group plc; Cargill Incorporated; Tate & Lyle PLC; Ingredion Incorporated; Archer-Daniels-Midland Company; Roquette Frères S.A.; Sensient Technologies Corporation |
| Forecast Period | 2026 to 2036 |
| Approach | Hybrid top-down and bottom-up approach using official statistics; segment shares; country growth; company portfolios; application evidence; reformulation drivers; distribution channels; and supplier validation |
How is the market segmented?
-
By Product:
- Functional Food Ingredients
- Nutritional Fortification Ingredients
- Fiber Enrichment Ingredients
- Flavoring Ingredients
- Natural Flavor Systems
- Synthetic Flavor Systems
- Emulsifiers & Stabilizers
- Lecithin Based Systems
- Hydrocolloid Stabilizers
- Sweetening Ingredients
- Natural Sweeteners
- Bulk Sweeteners
- Functional Food Ingredients
-
By Application:
- Food & Beverage Applications
- Processed Food Applications
- Beverage Formulations
- Bakery & Confectionery
- Bakery Ingredient Systems
- Confectionery Applications
- Dairy Applications
- Milk Based Products
- Plant Based Dairy Alternatives
- Nutraceutical Applications
- Dietary Supplement Systems
- Medical Nutrition Systems
- Food & Beverage Applications
-
By End Use:
- Food Manufacturers
- Packaged Food Producers
- Beverage Manufacturers
- Nutraceutical Companies
- Dietary Supplement Firms
- Medical Nutrition Companies
- Dairy & Bakery Companies
- Dairy Processors
- Bakery Manufacturers
- Food Service Industry
- Quick Service Restaurants
- Institutional Catering
- Food Manufacturers
-
By Technology:
- Extraction Technology
- Botanical Extraction Systems
- Enzymatic Extraction Systems
- Encapsulation Technology
- Microencapsulation Systems
- Nano Encapsulation Systems
- Fermentation Technology
- Microbial Fermentation Systems
- Precision Fermentation Systems
- Blending Technology
- Dry Blending Systems
- Liquid Blending Systems
- Extraction Technology
-
By Formulation:
- Powder Form Ingredients
- Spray Dried Powders
- Granulated Formulations
- Liquid Form Ingredients
- Concentrated Liquid Systems
- Suspension Systems
- Encapsulated Form Ingredients
- Coated Ingredient Systems
- Matrix Encapsulated Systems
- Paste Form Ingredients
- Semi Solid Systems
- Thickened Formulations
- Powder Form Ingredients
-
By Distribution Channel:
- Direct B2B Sales
- Manufacturer Direct Supply
- Enterprise Procurement Channels
- Specialty Ingredient Distributors
- Regional Distributors
- Technical Solution Distributors
- Online B2B Platforms
- Digital Ingredient Marketplaces
- Manufacturer Digital Stores
- Third Party Suppliers
- Contract Manufacturing Suppliers
- Direct B2B Sales
-
By Region:
- North America
- Latin America
- Europe
- East Asia
- South Asia and Oceania
- Middle East and Africa