
Microfibrillated Cellulose Fiber Market Outlook (2025 to 2035)
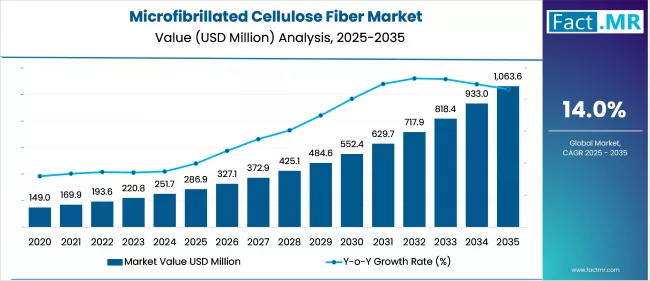
The global microfibrillated cellulose fiber market is projected to increase from USD 286.9 million in 2025 to USD 1,063.6 million by 2035, with a CAGR of 14.0% during the forecast period. Growth is driven by rising demand for sustainable and biodegradable alternatives. Technological advancements in production methods are enhancing MFC quality and scalability across diverse industrial applications.
What are the Drivers of Microfibrillated Cellulose Fiber Market?
The growth of the microfibrillated cellulose (MFC) fiber market is primarily driven by the increasing global emphasis on sustainability and the rising demand for eco-friendly alternatives to plastics and synthetic materials. Microfibrillated cellulose fiber, derived from natural cellulose, is biodegradable, renewable, and non-toxic, making it an attractive material for industries seeking to reduce their environmental impact.
Governments across Europe, North America, and parts of Asia have introduced stringent regulations targeting single-use plastics and carbon emissions, prompting industries to adopt bio-based solutions, such as microfibrillated cellulose fiber. This shift is especially evident in the packaging and paper sectors, where MFC’s ability to improve barrier properties, strength, and printability offers a sustainable edge over conventional materials.
Another driver is the advancement in production technologies. Innovations in mechanical, enzymatic, and chemical processing methods, such as high-pressure homogenization and TEMPO-mediated oxidation, have made the production of microfibrillated cellulose fibers more efficient and cost-effective.
These technologies have not only improved the scalability of microfibrillated cellulose fibers but also enhanced their performance characteristics, enabling their use in diverse applications ranging from high-performance coatings to composite materials. The ability to tailor microfibrillated cellulose fiber properties for specific end uses has significantly broadened its market potential, especially in industries such as automotive, construction, and electronics, where lightweight, durable, and sustainable materials are in high demand.
Microfibrillated cellulose fiber is gaining strong traction in the personal care and paint industries, where it serves as a natural rheology modifier, stabilizer, and thickener. In paints and coatings, it improves viscosity control, reduces sagging, and enhances the mechanical strength of films.
In cosmetics and personal care products, its compatibility with skin, biodegradability, and emulsifying capabilities make it ideal for clean-label and organic formulations. As consumer awareness of product ingredients increases, the demand for natural and safe additives, such as microfibrillated cellulose fiber, is rising, further driving market growth.
The market is also benefiting from increasing collaborations and policy support aimed at promoting bio-based economies. Public-private partnerships, particularly in Europe, are funding large-scale research and development projects to commercialize microfibrillated cellulose fiber technologies.
Companies like Stora Enso, Borregaard, and Norske Skog are expanding their microfibrillated cellulose fiber production capacities and entering joint ventures to develop next-generation biocomposites and packaging materials. These initiatives, supported by climate policies and corporate sustainability goals, are accelerating the adoption of microfibrillated cellulose fiber in mainstream manufacturing, positioning it as a key material in the transition to a circular and low-carbon economy.
What are the Regional Trends of Microfibrillated Cellulose Fiber Market?
Europe dominates the global microfibrillated cellulose fiber market, driven by its strong environmental regulations, early adoption of bio-based materials, and proactive government initiatives to transition toward a circular economy.
The European Union’s Green Deal and plastic reduction directives have encouraged investment in sustainable materials like microfibrillated cellulose fiber for packaging, automotive, and construction applications. Countries like Finland, Sweden, and Norway are home to key players such as Borregaard and Stora Enso, which are investing in R&D and industrial-scale microfibrillated cellulose fiber production facilities.
North America is also experiencing significant growth, driven by increasing demand for biodegradable packaging, sustainable food containers, and lightweight composite materials. The U.S. and Canada have strong industrial and academic collaboration networks focused on advancing cellulose-based technologies.
Government support for bioproducts, particularly in the form of funding through the USDA and Department of Energy, is also accelerating microfibrillated cellulose fiber research and commercialization. The region is witnessing a growing use of microfibrillated cellulose fiber in paints, coatings, personal care products, and pharmaceutical formulations, where sustainability and performance are key considerations.
In the Asia Pacific region, the market is expanding rapidly, particularly in countries such as Japan, China, and South Korea, driven by growing environmental awareness, urbanization, and demand for advanced functional materials. Japan is a notable early adopter, using microfibrillated cellulose fiber in packaging, textiles, and food products.
China’s expanding paper and packaging industry, along with its push to reduce plastic waste and invest in renewable materials, is driving significant interest in microfibrillated cellulose fiber technologies. Increasing investments in industrial automation and manufacturing innovation are expected to further support the region's growth trajectory.
The Middle East & Africa represent emerging markets with untapped potential for microfibrillated cellulose fiber applications. While these regions are currently at a nascent stage of adoption, rising environmental concerns and the development of local bioeconomies could support long-term growth. Brazil, for instance, with its robust pulp and paper sector, offers a natural advantage for the development of microfibrillated cellulose fibers.
What are the Challenges and Restraining Factors of Microfibrillated Cellulose Fiber Market?
One of the primary limitations is the high production cost associated with microfibrillated cellulose fiber. The process of extracting and refining microfibrils from cellulose through mechanical, chemical, or enzymatic treatments requires significant energy and capital investment. Compared to conventional materials like plastics or synthetic fibers, microfibrillated cellulose fibers remain more expensive to produce at commercial volumes, which can limit their competitiveness in cost-sensitive industries such as packaging and textiles.
Another challenge is the lack of large-scale production infrastructure and supply chain maturity. While pilot plants and small-scale production facilities are operational, only a few companies have developed industrial-scale microfibrillated cellulose fiber manufacturing units. The limited availability of high-quality microfibrillated cellulose fiber in large volumes restricts its adoption across mass-market applications.
Moreover, the variability in feedstock quality and the complexity of maintaining consistent fiber properties pose technical hurdles for manufacturers looking to integrate microfibrillated cellulose fiber into standardized product lines.
Technical challenges related to dispersion and compatibility also restrict microfibrillated cellulose fiber's integration into certain composite materials or polymer matrices. Achieving uniform dispersion and bonding between microfibrillated cellulose fiber and other materials often requires chemical surface modification or the addition of compatibilizers, which adds complexity to formulation and processing.
Furthermore, microfibrillated cellulose fiber’s high water retention capacity can affect product stability, particularly in coatings, adhesives, and packaging materials, requiring careful formulation and moisture management strategies.
Lack of market awareness and industry expertise surrounding microfibrillated cellulose fiber applications, particularly in emerging markets, is hindering the market growth. Many potential end-users are unfamiliar with its properties, benefits, and processing requirements, which slows down experimentation and integration into new product development.
Moreover, regulatory approvals for microfibrillated cellulose fiber use in food contact materials, pharmaceuticals, or cosmetics may be lacking or slow in certain regions, delaying market entry and adoption. Overcoming these restraints will require greater investment in R&D, stronger collaboration across the value chain, and continued policy support to improve cost-efficiency and market readiness.
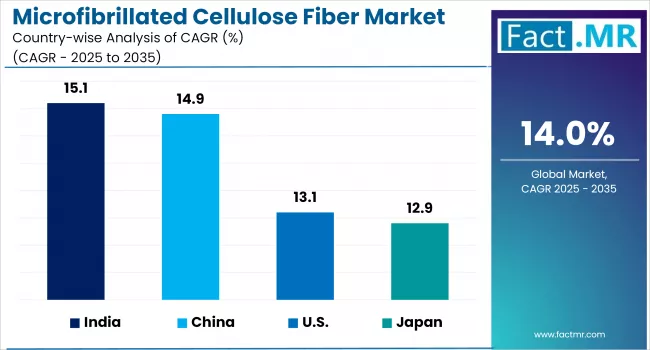
Country-Wise Outlook
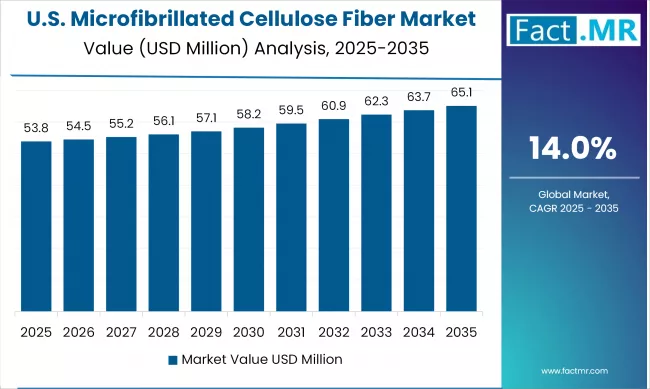
U.S. Microfibrillated Cellulose Fiber Market sees Increasing Demand for Sustainable and High-Performance Materials
The U.S. Microfibrillated Cellulose (MFC) Fiber market is experiencing steady growth, fueled by increasing demand for sustainable and high-performance materials. With rising environmental awareness and pressure to reduce plastic usage, industries across the U.S. are turning to microfibrillated cellulose fiber as a renewable alternative. Its natural origin, biodegradability, and functional properties make it particularly appealing for applications in packaging, automotive components, coatings, and personal care products.
One of the primary growth drivers in the U.S. market is the regulatory push for sustainable materials. Federal and state-level initiatives aimed at phasing out single-use plastics and encouraging the use of biodegradable packaging are creating a favorable environment for microfibrillated cellulose fiber adoption.
Moreover, corporate sustainability targets are pushing manufacturers to integrate renewable and eco-friendly materials into their products. The packaging sector, in particular, is seeing an increased use of microfibrillated cellulose fiber due to its ability to enhance strength, reduce weight, and improve barrier properties —critical factors for industries such as food, e-commerce, and logistics.
The U.S. market also benefits from advancements in production technology and a strong ecosystem of academic and industrial research. Companies and research institutions are investing in improving the scalability, consistency, and cost-efficiency of microfibrillated cellulose fiber manufacturing. These innovations are making it more feasible to incorporate microfibrillated cellulose fiber into large-scale production lines.
Furthermore, the compatibility of microfibrillated cellulose fiber with existing processing systems, such as extrusion and blending for composites, is enabling its use in automotive, construction, and electronics applications, where lightweight and strong materials are essential.
China witnesses Rapid Market Growth Backed by Domestic Manufacturing Strength
The microfibrillated cellulose (MFC) market in China is experiencing explosive growth. This momentum is largely fueled by China's aggressive environmental policies, which aim to reduce plastic waste and promote the adoption of biodegradable materials. The government’s 2020 ban on single-use plastics in major cities has driven rapid innovation and investment in alternative materials such as microfibrillated cellulose fiber, particularly within the packaging, logistics, and e-commerce sectors, which account for a significant share of plastic consumption.
China’s extensive manufacturing ecosystem further amplifies demand for microfibrillated cellulose fiber. The country is a global leader in paper, packaging, textiles, coatings, and construction materials, all of which are key end-use industries for microfibrillated cellulose.
The ability of microfibrillated cellulose fibers to improve strength, flexibility, and barrier properties makes them highly attractive for applications in high-performance packaging and sustainable product design. As domestic companies strive to align with sustainability goals and international standards, many are turning to microfibrillated cellulose fiber as a next-generation material that strikes a balance between performance and environmental responsibility.
Moreover, China is expanding its local production capabilities of microfibrillated cellulose fibers to meet the rising domestic demand. State-owned and private enterprises in the pulp and paper industry are actively investing in research, pilot facilities, and commercial-scale production plants.
Academic and government-funded R&D initiatives are also supporting local innovation focused on improving the cost-efficiency and scalability of microfibrillated cellulose fiber production. This infrastructure development is crucial for ensuring a stable supply and reducing reliance on imports, allowing China to establish a vertically integrated microfibrillated cellulose fiber value chain.
Japan sees Precision Manufacturing Fuels Demand for Ultra-Pure Piping
A major driver of microfibrillated cellulose fiber market growth is Japan's robust government and corporate commitment to sustainability and circular economy principles. Initiatives led by METI and organizations like Daicel Miraizu are advancing the development of cellulose-based nanomaterials for applications in packaging, electronics, automotive, and construction. Microfibrillated cellulose fiber’s high transparency, strength, and barrier performance make it a favored option for companies aiming to reduce plastic usage in high-performance and consumer-facing applications.
Moreover, Japan benefits from its world-class innovation ecosystem. Strong collaboration between industrial giants (e.g., Daicel, Nippon Paper Industries), academic institutes, and government research bodies fuels ongoing R&D in production efficiency, functionalization, and application development. This synergy enables cutting-edge product formulations and advanced processing capabilities that enhance the competitiveness of microfibrillated cellulose fibers relative to conventional materials.
Category-wise Analysis
Barrier Films to Exhibit Leading by Application
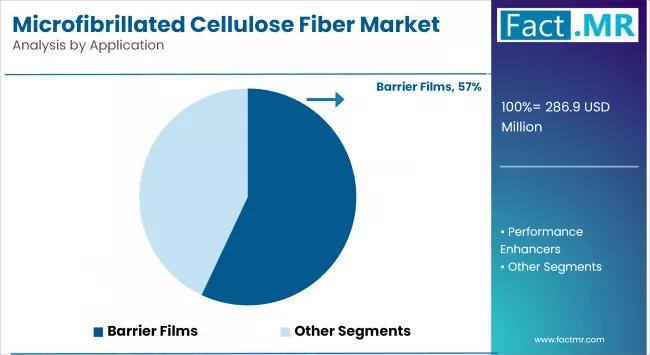
Barrier films represent the dominating application segment, primarily driven by the increasing global demand for sustainable and high-performance packaging solutions. Microfibrillated cellulose fiber is widely used in barrier films due to its excellent oxygen, grease, and moisture barrier properties, making it ideal for food, pharmaceutical, and personal care packaging.
The rising regulatory pressure to eliminate single-use plastics and the shift toward recyclable or biodegradable packaging materials are compelling manufacturers to integrate microfibrillated cellulose fiber into packaging films. Moreover, its compatibility with paper and bio-based polymers allows the creation of fully compostable multilayer films, a major selling point for environmentally conscious brands.
The fastest-growing application segment is that of performance enhancers, which includes the use of microfibrillated cellulose fiber in coatings, adhesives, paints, cosmetics, and composites. The growth in this segment is fueled by microfibrillated cellulose fiber’s ability to act as a rheology modifier, thickener, stabilizer, and reinforcement agent, offering enhanced mechanical strength, viscosity control, and durability without compromising on sustainability.
Industries such as automotive, construction, electronics, and personal care are increasingly adopting microfibrillated cellulose fiber to replace synthetic additives, improve product performance, and align with clean-label trends. The rapid innovation in functional microfibrillated cellulose fiber formulations, combined with its growing use in premium and high-tech applications, is further accelerating the expansion of this segment.
Pulp & Paper to Exhibit Leading by End-Use Industry
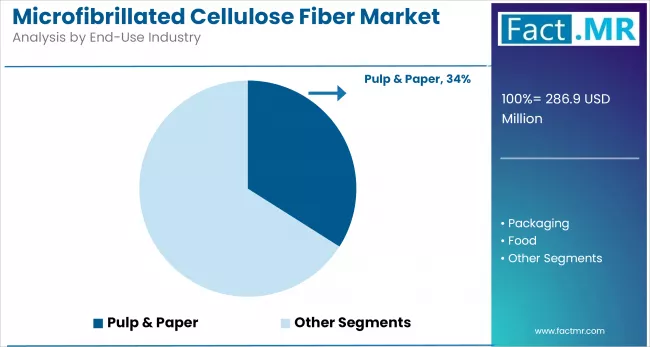
The pulp & paper industry holds the dominant share among end-use segments, owing to microfibrillated cellulose fiber's ability to significantly enhance paper strength, printability, and barrier properties. Microfibrillated cellulose fiber is increasingly used as a strength additive in paper manufacturing, enabling producers to reduce the overall weight and fiber content without compromising mechanical performance.
Moreover, its application in specialty papers such as labels, security papers, and high-performance liners is expanding rapidly. The push for sustainable paper products, growing demand for lightweight yet durable packaging, and efforts to reduce chemical usage in paper processing are key drivers sustaining this segment’s leadership.
The fastest-growing end-use segment is packaging, driven by the global shift toward eco-friendly and recyclable packaging materials. Microfibrillated cellulose fiber’s biodegradability, film-forming ability, and excellent barrier properties make it highly suitable for food, cosmetic, and pharmaceutical packaging, where plastic alternatives are in high demand.
The rise of e-commerce, increased regulatory bans on plastics, and consumer preference for green packaging are prompting packaging manufacturers to integrate microfibrillated cellulose fiber into coatings, laminates, and multilayer films. As major brands and retailers commit to circular economy goals, the demand for microfibrillated cellulose fiber in flexible and rigid packaging formats is expected to grow at an accelerated pace over the next decade.
Competitive Analysis
The microfibrillated cellulose (MFC) fiber market is increasingly competitive, with a mix of established pulp & paper companies, chemical firms, and emerging technology-driven players. Key players are competing primarily on the basis of production scalability, application innovation, sustainability, and strategic partnerships.
Companies are also investing heavily in R&D to develop advanced microfibrillated cellulose fiber products tailored for specific industries such as packaging, coatings, and composites, which helps them maintain a competitive edge.
Companies have developed proprietary technologies for efficiently extracting microfibrillated cellulose fibers and are actively scaling up their production capacities. For example, Stora Enso operates one of the largest microfibrillated cellulose fiber production lines in Europe and collaborates with packaging converters and brand owners to co-develop sustainable packaging solutions. Similarly, Borregaard has focused on diversifying its range of microfibrillated cellulose fiber products for personal care, construction, and food applications.
Emerging companies and startups, such as CelluForce (Canada) and Melodea Ltd. (Israel), are contributing to market innovation through novel processing methods and high-performance product variants. These firms often enter into joint ventures or technology licensing agreements with larger corporations to expand their market presence.
Competition is also intensifying as chemical companies and biopolymer manufacturers explore hybrid solutions using microfibrillated cellulose fiber blended with bioplastics or bio-resins for advanced composites.
In addition to product quality and innovation, companies are also competing on sustainability credentials. Firms that can demonstrate lower carbon footprints, renewable sourcing, and closed-loop production are better positioned to attract customers across various sectors, including food packaging, cosmetics, and automotive.
As the market matures, players who can achieve cost-effective large-scale production, diversified applications, and compliance with evolving regulatory frameworks are expected to strengthen their positions and drive consolidation within the industry.
Key players in the microfibrillated cellulose fiber industry include Borregaard, Daicel FineChem Ltd., Weidmann Fiber Technology, FiberLean Technologies Ltd., Zelfo Technologies GmbH, Stora Enso Oyj, Fibria (Suzano Brazil), Sappi, Cellucomp Ltd., Norske Skog, and other notable companies.
Recent Development
- In June 2025, at Expo 2025 in Osaka, the Toyo Seikan Group (Nano Cellulose Japan) showcased the “New ECOCRYSTAL Cup,” a paper container made from cellulose nanocrystals (CNC) that provides oxygen-barrier protection for foods and beverages, marking a significant step forward in bio-based packaging innovation.
Segmentation of Microfibrillated Cellulose Fiber Market
-
By End-Use Industry :
- Pulp & Paper
- Packaging
- Dairy
- Others
- Food
- Paints & Coatings
- Personal Care
- Others
-
By Application :
- Barrier Films
- Performance Enhancers
- Rheology Modifiers
- Thickening Agents
- Strengthening Agents
-
By Region :
- North America
- Latin America
- Western Europe
- Eastern Europe
- East Asia
- South Asia & Pacific
- Middle East & Africa
- Frequently Asked Questions -
What is the Global Microfibrillated Cellulose Fiber Market size in 2025?
The microfibrillated cellulose fiber market is valued at USD 286.9 million in 2025.
Who are the Major Players Operating in the Microfibrillated Cellulose Fiber Market?
Prominent players in the market include Borregaard, Daicel FineChem Ltd., Weidmann Fiber Technology, FiberLean Technologies Ltd., and Zelfo Technologies GmbH.
What is the Estimated Valuation of the Microfibrillated Cellulose Fiber Market by 2035?
The market is expected to reach a valuation of USD 1,063.6 million by 2035.
What value CAGR is the Microfibrillated Cellulose Fiber Market Exhibit Over the Last Five years?
The growth rate of the microfibrillated cellulose fiber market is 14.0% from 2020 to 2024.

Author:
S.N. Jha

Editor:
Naved Ahmed