


- Base Value(2025): 1.4 Bn
- Forecast Value (2035): 2.3 Bn
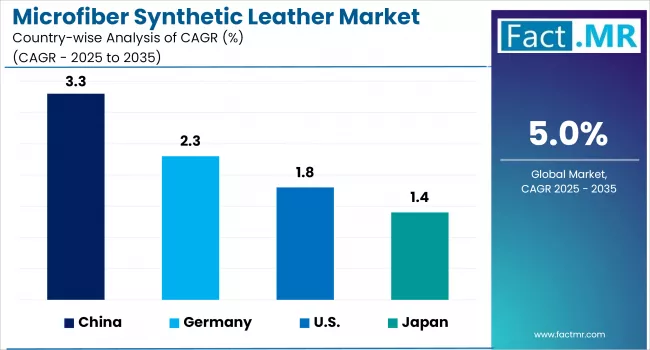
- CAGR (2035): 5.0%
Microfiber Synthetic Leather Market Outlook (2025 to 2035)
The global microfiber synthetic leather market is projected to increase from USD 1.4 billion in 2025 to USD 2.3 billion by 2035, with a CAGR of 5.0%, driven by the increasing demand for eco-friendly and cruelty-free alternatives, prompting widespread adoption of microfiber synthetic leather in fashion, automotive, and upholstery industries.
Their lightweight, breathable, and durable nature makes microfiber synthetic leather ideal for car interiors, high-performance footwear, and luxury accessories.
-2025-to-2035.webp)
What are the Drivers of Microfiber Synthetic Leather Market?
The growth of the microfiber synthetic leather market is driven by increasing consumer awareness about sustainability and ethical consumption. As concerns surrounding animal cruelty and the environmental impact of traditional leather intensify, both consumers and manufacturers are shifting toward eco-friendly alternatives.
Microfiber synthetic leather, being a cruelty-free and low-emission material, has emerged as a popular alternative, especially in regions such as Europe and North America, where demand for vegan and sustainable products is surging. This shift aligns with the broader trend of responsible fashion and lifestyle choices, particularly among younger and environmentally conscious consumers.
Technological advancements in microfiber production are also significantly enhancing the appeal of synthetic leather. Modern techniques such as needle-punching, advanced PU coatings, and solvent-free processing have allowed microfiber leather to closely replicate the texture, softness, and durability of natural leather. These innovations not only improve product quality but also reduce production-related emissions and waste. The ability to customize the material in terms of color, texture, and performance makes it highly versatile, expanding its applications across various industries, including fashion, automotive, furniture, and electronics.
The automotive industry is a major contributor to growth, as microfiber synthetic leather is experiencing rising adoption for vehicle interiors due to its durability, comfort, and premium finish. Its lightweight nature, abrasion resistance, and ability to withstand temperature fluctuations make it ideal for applications like seats, dashboards, and trim panels. As electric vehicle manufacturers emphasize the use of sustainable and lightweight materials, microfiber leather offers both environmental benefits and aesthetic value. Similarly, in the footwear and apparel sectors, their breathability, water resistance, and affordability are driving adoption, particularly in sportswear and casual fashion segments.
Moreover, the rise in e-commerce platforms and global retail channels has boosted the accessibility and visibility of microfiber synthetic leather products. Consumers are increasingly purchasing vegan accessories, furniture, and fashion items online, aided by transparent labeling and certifications that highlight sustainability credentials.
Supportive government regulations that promote environmentally friendly materials and discourage the use of animal-derived products are further bolstering the market growth. These collective factors are positioning microfiber synthetic leather as a preferred alternative across multiple industries, driving its continued global expansion.
What are the Regional Trends of Microfiber Synthetic Leather Market?
The Asia Pacific region currently dominates the microfiber synthetic leather market due to its strong manufacturing base and robust demand across key industries, including automotive, footwear, and fashion. Countries like China, Japan, South Korea, and India play pivotal roles in both production and consumption.
China, in particular, is the largest producer globally, benefiting from well-established supply chains, cost-effective labor, and abundant raw materials. Moreover, growing urbanization, rising disposable incomes, and increased awareness of eco-friendly alternatives are driving demand for microfiber synthetic leather in developing nations like India and Indonesia.
The growth of the microfiber synthetic leather market in North America is driven by the rising popularity of plant-based, cruelty-free, and sustainable lifestyle choices. The U.S. and Canada have a growing consumer base that favors ethical fashion and environmentally friendly automotive interiors, particularly in the premium and luxury segments. Automotive OEMs are increasingly using microfiber leather for seat coverings, dashboards, and trim panels, while fashion and accessory brands are introducing microfiber-based vegan collections.
In Europe, growth is primarily fueled by the region’s strong emphasis on environmental sustainability and ethical consumerism. With increasingly stringent regulations aimed at reducing carbon emissions and discouraging the use of animal-derived materials, microfiber synthetic leather is gaining rapid traction.
Countries such as Germany, France, Italy, and the U.K. are seeing notable growth in fashion, automotive, and interior décor sectors. Luxury brands and high-end automakers are actively incorporating microfiber leather into their products to align with ESG goals. European consumers, known for their preference for certified vegan and environmentally responsible products, are making a significant contribution to this trend.
The Middle East & Africa (MEA) are emerging as new opportunities for microfiber synthetic leather manufacturers. While these markets are still developing, rising awareness about sustainability, urban growth, and an expanding middle class are creating favorable conditions.
What are the Challenges and Restraining Factors of Microfiber Synthetic Leather Market?
One of the key restraints is the high production cost compared to conventional synthetic leather (like PVC leather). Although microfiber leather offers superior durability, texture, and sustainability, the complex and technology-intensive manufacturing process makes it more expensive. This price sensitivity can limit its adoption, especially in cost-driven markets and low-margin product segments, such as mass-produced footwear or budget automotive interiors.
Another major challenge is the limited availability of eco-friendly raw materials. While microfiber leather is often marketed as sustainable, its production still relies heavily on petroleum-based polymers such as polyurethane (PU) and polyester.
Fully bio-based alternatives are still in early development or come at a premium cost, making it difficult for manufacturers to scale production sustainably without increasing prices. This raises concerns among environmentally conscious consumers who expect both ethical sourcing and low environmental impact, putting pressure on producers to innovate further.
Competition from other sustainable alternatives such as plant-based leathers made from pineapple leaves, mushrooms (mycelium), and apple waste, poses a challenge to the microfiber synthetic leather market.
These emerging materials are gaining attention in the fashion and automotive sectors for being entirely biodegradable and offering a more circular lifecycle. If these materials achieve scalability and cost competitiveness, they may divert demand away from microfiber leather, especially in premium product categories.
Country-Wise Outlook
The U.S. Microfiber Synthetic Leather Market sees Growth Driven by Growth in Automotive Industry
The U.S. microfiber synthetic leather market is experiencing steady growth, driven by increasing demand for sustainable, high-performance materials across a variety of industries. The growth is fueled by rising consumer awareness about animal welfare, environmental sustainability, and the shift toward cruelty-free alternatives to traditional leather. Microfiber synthetic leather, which offers superior texture, breathability, and durability, is becoming a popular choice in both premium and mass-market product lines.
-2025-to-2035.webp)
One of the most significant contributors to the U.S. market growth is the automotive industry. Leading automakers such as Tesla, Ford, and GM are increasingly using microfiber synthetic leather in vehicle interiors including seats, dashboards, and door panels, due to its lightweight nature, resistance to wear and tear, and sustainable appeal. As the electric vehicle (EV) market expands rapidly in the U.S., there is heightened focus on integrating eco-friendly materials to complement the sustainability goals of automakers, further accelerating the demand for microfiber leather.
The footwear and furniture sectors are also key markets for microfiber synthetic leather in the U.S. Consumers are seeking affordable, stylish, and easy-to-maintain products, especially in home furnishings and fashion. Microfiber leather meets these needs with its stain resistance, ease of cleaning, and premium finish. Moreover, the growing popularity of e-commerce and the rise of ethical fashion brands in North America have made microfiber synthetic leather more accessible to mainstream consumers, expanding its footprint beyond traditional luxury segments.
Advancements in manufacturing technology have significantly improved the quality and sustainability of microfiber synthetic leather. The U.S.-based manufacturers and brands are investing in innovative, solvent-free, and water-based production processes to meet both regulatory standards and consumer expectations.
Combined with government and corporate sustainability initiatives, the U.S. market is evolving into a dynamic landscape where microfiber synthetic leather is not just an alternative but increasingly a preferred material across industries.
China witnesses Rapid Market Growth Backed by Domestic Manufacturing Strength
The microfiber synthetic leather market in China is experiencing robust and accelerating growth, driven by the country’s extensive manufacturing capabilities, increasing domestic demand, and strong export potential. The growth is driven by China’s leadership in producing cost-effective, high-quality microfiber leather that caters to both global and local markets. The country benefits from a mature supply chain, abundant raw materials, and well-established processing technologies.
The booming demand from end-use industries, such as automotive, footwear, and furniture, is driving market growth in China. China is not only a major manufacturer but also a significant consumer of microfiber synthetic leather, as domestic demand rises in tandem with increasing urbanization, rising disposable income, and shifting lifestyle preferences.
The automotive sector, especially electric vehicles (EVs), is a major contributor, with microfiber leather increasingly used for interiors due to its durability, lightweight, and eco-friendly appeal. Likewise, the fashion and footwear industries utilize microfiber leather due to its affordability, aesthetic appeal, and ease of mass production.
Strong demand fundamentals and technological advancements in microfiber production have enhanced material quality and sustainability. Chinese manufacturers are investing in solvent-free PU coatings, improved breathability, and textured surface technologies to meet both domestic standards and international quality benchmarks.
These innovations help bridge the gap between synthetic and natural leather while supporting environmental goals. Furthermore, government policies promoting green manufacturing and reduced carbon emissions are encouraging wider adoption of microfiber leather across industries.
Japan sees Precision Manufacturing Fuels Demand for Microfiber Synthetic Leather
The growth of the microfiber synthetic leather market in Japan is driven by emphasis on quality, high-performance materials and stringent environmental standards. Microfiber variants, like PU-based leather, make up the majority share, leveraging advanced manufacturing technologies to meet domestic demand.
A key driver is the automotive sector, especially in producing lightweight, durable interior components. With a national focus on green mobility and emissions reduction, Japanese automakers are increasingly using microfiber leather in seats, dashboards, and trim panels.
Similarly, the footwear and fashion industries are steadily driving demand, due to the material’s versatility, aesthetics, and eco-friendly appeal. As PVC-based and bio-based options evolve, PU synthetic leather remains the preferred choice due to its superior performance, aesthetic qualities, and cost efficiency.
Technological innovation plays a central role in Japan's market dynamics. Manufacturers are investing heavily in solvent-free PU coatings, micro-perforation techniques, and breathable, washable surfaces, epitomized by products like Kuraray’s Clarino, to meet consumer expectations for quality and sustainability. Government-backed R&D incentives and eco-innovation policies further support advancements in bio-based and recyclable synthetic leathers, reinforcing Japan’s competitive edge.
Category-wise Analysis
PU-based to Exhibit Leading by Product Type
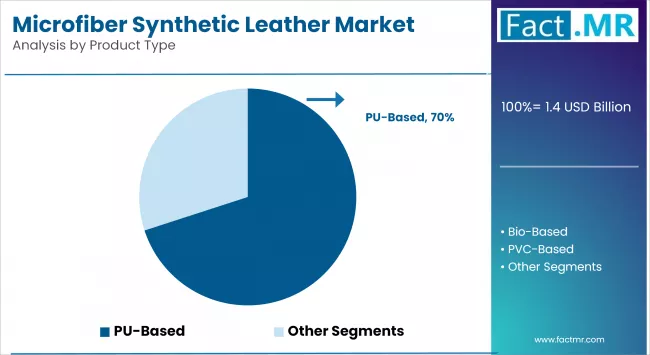
The PU-based microfiber synthetic leather segment holds the largest market share, driven by its superior performance characteristics, including flexibility, abrasion resistance, lightweight nature, and breathability. This will make it highly suitable for a wide range of applications, including automotive interiors, footwear, fashion, and upholstery. PU-based leather also offers a closer feel and appearance to natural leather compared to PVC-based alternatives, which enhances its appeal among manufacturers seeking quality synthetic substitutes.
The bio-based microfiber synthetic leather segment is expected to be the fastest-growing during the forecast period, owing to the increasing consumer demand for fully sustainable, plant-based, and biodegradable alternatives. Bio-based leather is typically made from renewable resources such as corn, castor oil, or other plant-derived polymers, reducing the carbon footprint compared to fossil-fuel-derived PU and PVC.
This segment is gaining rapid momentum, especially in premium fashion, automotive, and lifestyle markets, driven by stringent environmental regulations, corporate ESG targets, and consumer preference for eco-conscious products. Ongoing innovations and investments in bio-based materials are expected to reduce costs and improve scalability, further boosting adoption across various end-use industries.
Automotive Industry to Exhibit Leading by Application
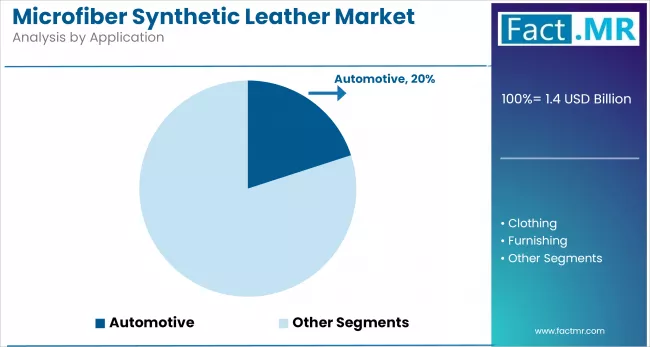
The automotive segment is expected to be the fastest-growing application during the forecast period. The growing emphasis on sustainability, particularly in electric vehicle (EV) production, is prompting automakers to adopt microfiber synthetic leather for interior components such as seats, dashboards, door trims, and headliners. This material offers a premium look and feel, is easy to maintain, and performs well under varying temperature conditions.
Moreover, the lightweight nature of microfiber leather contributes to overall vehicle weight reduction, thereby enhancing fuel efficiency and meeting regulatory emissions targets. As automotive OEMs and luxury brands increasingly shift toward eco-friendly interior solutions, this segment is projected to witness rapid adoption and strong year-over-year growth.
Competitive Analysis
The microfiber synthetic leather market is becoming increasingly competitive, with several key global players dominating due to their advanced technological capabilities, wide distribution networks, and established brand reputations. Companies that focus on R&D, sustainable production technologies, and solvent-free processes help them cater to the growing demand for eco-friendly materials.
Chinese and South Korean manufacturers are gaining competitive ground by offering microfiber synthetic leather at more affordable prices. Companies such as Double Elephant Group, Wanhua Chemical, and Daewon Chemical Co., Ltd. are expanding their production capacity to target large-volume applications, including footwear, bags, and furniture. These companies are increasingly investing in automation, material innovation, and export strategies to strengthen their global presence, especially in developing markets such as India, Southeast Asia, and Latin America.
Innovation and sustainability are the core drivers of competition in this market. Leading players are introducing bio-based and recyclable microfiber leathers to align with shifting consumer preferences and regulatory mandates. Strategic partnerships with automotive OEMs, sportswear brands, and furniture manufacturers allow companies to secure long-term contracts and enhance market penetration.
As sustainability becomes a core focus across industries, competition is expected to intensify. Companies that can deliver durable, customizable, and eco-conscious materials at scale will have a distinct competitive advantage. The future of the microfiber synthetic leather market will be shaped by the balance between innovation, cost-efficiency, and environmental responsibility, making the competitive landscape increasingly dynamic and innovation-driven.
Key players in the microfiber synthetic leather industry include Chevron Phillips Chemical Company LLC, Dymatic Chemicals, Inc., Beijing Eastern Acrylic Chemical Technology Co., Ltd., LG Chem, Ltd., Yeochun NCC Co., Ltd., Trecora Resources, and other notable companies.
Recent Development
- In December 2024, Hohenstein partnered with Under Armour to introduce DIN SPEC 19292, a new standard to measure microfiber release from textiles during washing. While not specific to leather, this development indicates a broader industry shift toward reducing microfiber pollution, which is highly relevant to the production of microfiber leather.
Segmentation of the Microfiber Synthetic Leather Market
-
By Product Type :
- Bio-Based
- PU-Based
- PVC-Based
-
By Application :
- Clothing
- Furnishing
- Bags, Purses & Wallets
- Footwear
- Automotive
- Others
-
By Region :
- North America
- Latin America
- Western Europe
- Eastern Europe
- East Asia
- South Asia & Pacific
- Middle East & Africa
- Frequently Asked Questions -
What is the Global Microfiber Synthetic Leather Market size in 2025?
The microfiber synthetic leather market is valued at USD 1.4 billion in 2025.
Who are the Major Players Operating in the Microfiber Synthetic Leather Market?
Prominent players in the market include Chevron Phillips Chemical Company LLC, Dymatic Chemicals, Inc., Beijing Eastern Acrylic Chemical Technology Co., Ltd, LG Chem, Ltd., and Yeochun NCC Co. Ltd.
What is the Estimated Valuation of the Microfiber Synthetic Leather Market by 2035?
The market is expected to reach a valuation of USD 2.3 billion by 2035.
What value CAGR did the Microfiber Synthetic Leather Market Exhibit over the last five years?
The historic growth rate of the microfiber synthetic leather market was 5.8% from 2020-2024.