
Paint Stripper Market Size, Market Forecast and Outlook By Fact.MR
The paint stripper market was valued at USD 1094.32 million in 2025, projected to reach USD 1146.85 million in 2026, and is forecast to expand to USD 1832.82 million by 2036 at a 4.8% CAGR. driven by occupational health regulations that are eliminating legacy product registrations across North America and Europe.
The absolute dollar expansion between 2026 and 2036 is approximately USD 685.97 million. Growth reflects steady demand from architectural renovation, automotive refinishing, and marine maintenance applications. Reformulation costs and the performance gap between traditional solvent-based strippers and newer bio-based alternatives act as structural constraints on faster market expansion.

Paint Stripper Market Key Takeaways
| Metric | Details |
|---|---|
| Industry Size (2026) | USD 1146.85 million |
| Industry Value (2036) | USD 1832.82 million |
| CAGR (2026 to 2036) | 4.8% |
Procurement managers at large industrial maintenance contractors are revising their approved chemical lists to exclude methylene chloride formulations following the U.S. EPA's March 2024 final risk management rule. Suppliers unable to provide reformulated alternatives with equivalent strip rates face contract termination during the 2025 to 2026 compliance transition window.
All major regional markets reflect differentiated growth parameters. India sets the pace at 6.2% CAGR. UK registers at 6.1% CAGR. China registers at 5.7% CAGR. Germany registers at 5.5% CAGR. USA registers at 4.6% CAGR.
Summary of Paint Stripper Market
- Paint Stripper Market Definition
- Paint strippers are chemical formulations designed to soften, dissolve, or lift cured paint, varnish, lacquer, and coating layers from substrates including wood, metal, concrete, and composites. They are classified by active chemistry into solvent-based, caustic-based, acidic-based, and bio-based/low-VOC categories.
- Demand Drivers in the Market
- EPA methylene chloride phase-out: The U.S.
- Renovation activity in aging building stock: The U.S.
- Bio-based chemistry advancement: Franmar Chemical's soy-based Bean-e-doo and EcoProCote's citrus-terpene formulations demonstrate that plant-derived solvents can achieve full-cure coating removal on architectural surfaces.
- Key Segments Analyzed in the Fact.MR Report
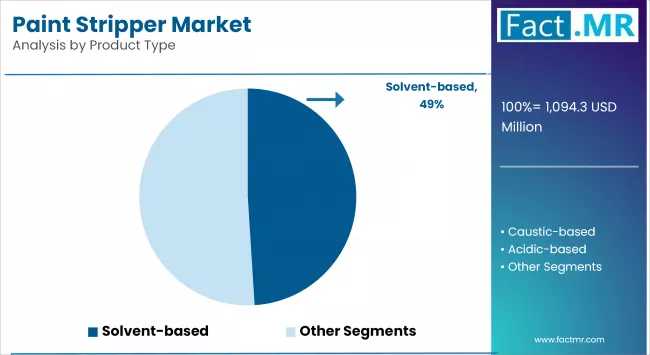
- Solvent-based product type: 49.0% share in 2026.
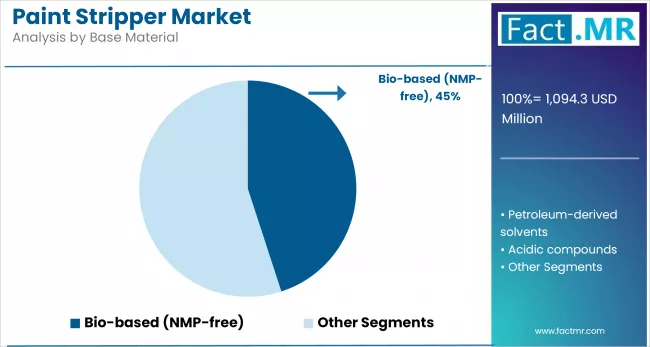
- Bio-based base material: 45.0% share in 2026.
- India: 6.2% compound growth through 2036.
- Analyst Opinion at Fact.MR
- The core shift is regulatory. The U.S. Environmental Protection Agency finalized restrictions on methylene chloride in consumer paint strippers in March 2024, following years of documented fatalities from acute exposure. The European Chemicals Agency (ECHA) REACH restrictions already limit methylene chloride concentrations in consumer products.
- Strategic Implications / Executive Takeaways
- Procurement teams must establish multi-year supply agreements with qualified producers to secure allocation ahead of anticipated demand increases.
- Product development resources should prioritize formulations that meet tightening regulatory specifications in key import markets.
- Regional expansion strategies must account for divergent growth rates and regulatory environments across major consuming nations.
What are the key emerging trends shaping the growth of the global paint stripper market?
The emerging industry shift observed in the paint stripper market in recent years indicates a tremendous shift towards more viable and user-friendly recipes. Traditional hazardous chemicals are being increasingly replaced by bio-based solvents and zero-VOC products.
The formulae of gels and pastes have become popular due to their convenience of application and limited air exposure. Companies are investing in R&D to enhance product effectiveness and comply with environmental regulations. Digital media are also among the most significant sources of distribution channels, especially to DIY consumers.
There is also a growing demand for multi-surface compatibility, which offers flexibility in working with various substrates. These trends reflect an industry-wide shift toward responsible production and high-performance chemical solutions with targeted applications.
What are the key regulatory and safety challenges restraining growth in the paint stripper market?
Despite the positive dynamics, the paint stripper market faces several challenges. The intensive state of environmental and safety regulations has limited the practice of numerous traditional solvent-based formulations, thereby increasing the cost of compliance and formulation.
Bio-based solutions are safer but often do not perform as effectively as conventional options. Market perception has been influenced within the consumer segment due to health concerns related to improper usage.
Moreover, fluctuating prices of raw materials and limited awareness of the emerging markets slow broader adoption. Regulatory delays and supply chain disruptions can also impact the timely advancement and global availability of next-generation, compliance-oriented paint removal materials.
Which regions are experiencing the fastest growth in the global paint stripper market and why?
The North American region has continued to dominate in the paint stripper market owing to continuous demand in the construction and automotive refinishing. The region has enacted stringent safety and environmental standards that have accelerated the shift toward low-toxicity and biodegradable formulations. In response, manufacturers have increased their focus on developing products that meet compliance requirements.
East Asia has witnessed a rapid increase in demand for paint strippers due to accelerated industrialization and infrastructure development in China, Japan, and South Korea. The automotive factories and a skilled workforce have played a significant role in product adoption. Although regulatory controls have not been as severe, manufacturers have gradually introduced environmentally responsible products to address evolving expectations.
Western Europe has been at the forefront of the adoption of environmentally responsible technologies in paint strippers, influenced by the tough REACH regulations and sustainability requirements. Leading economies such as Germany, France and the UK have emphasized safer bio-based chemical formulations. There has been a gradual transition in the market against the use of traditional solvents, and manufacturers have diversified their products to comply with regulatory requirements.
Country-wise Outlook
.webp "Top Country Growth Comparison Paint Stripper Market Cagr (2026 2036)")
Health-Conscious Consumers and Functional Ingredients Boost U.S. Paint Stripper Market
This has supported the steady growth of the United States paint stripper market, which has maintained a continuous and stable growth pattern due to increasing consumer awareness of health-conscious and functional products and formulations.

Customers have expressed the need to be informed about the contents of what they use and to ensure improved nutritional standards in food products. This has led manufacturers to pursue alternative solutions aligned with clean-label trends. The widely used preservative in organic and artisanal-style bakery products, paint stripper, is a compound primarily based on GBL.

These additive-free products have contributed to the product’s broad consumer base, which supports the use of naturally processed foods as part of wider wellness trends. The application of paint stripper in extending the shelf life of frozen and pre-prepared bakery products has enabled retailers to maximize product longevity while preserving traditional quality standards, making paint stripper relevant in the transformation of convenience food logistics in the U.S. market.
Clean-Label Compliance and Dairy Innovation Propel Germany’s Paint Stripper Market
According to recent evidence, the Germany paint stripper market has undergone significant change based on the twofold focus of regulative compliance and clean-label food innovation. Natural preservative producers have responded to consumer demand by using natural preservatives, such as those extracted from paint stripper with the help of GBL, thereby preserving dairy and bakery products without relying on synthetically formulated ingredients.
This aligns with the overall German preference for foods that reflect safety, minimum processing and ingredient transparency. In response, manufacturers have strived to achieve new product innovations that balance clean formulation with shelf stability.
Complimentary regulatory scrutiny on sustainable and authentic food processing has further strengthened the position of paint stripper in domestic food systems, particularly as consumers have become more aware of environmentally conscious practices and food integrity. The alignment of policy and consumer preference has contributed to establishing paint stripper as a recognized component of the contemporary German food chain.
Industrial Growth and Regulatory Streamlining Boost China’s Paint Stripper Market
China has been a notable market in terms of paint stripper market development, owing to the high rate of industrialization and effective policy reforms. As one of the production centers for GBL-based compounds, China has positioned paint stripper at the forefront in the sectors of pharmaceuticals, agrochemicals, and high-tech electronics.
The country has substantial manufacturing potential, where domestic producers have expanded their operations to meet both local and external markets. At the same time, the regulatory procedures employed by the government have also been amended, allowing for greater imports and streamlining work processes through the supply chain, especially in relation to intermediaries such as adhesive products like paint strippers.
Such admonitory adjustments have facilitated the seamless logistics, flexibility, and agility of the industrial landscape. Consequently, paint stripper has successfully established itself as a major segment in China's diversified chemical economy, strengthening the country's strategic position in the global paint stripper supply chain.
Category-Wise Market Outlook
Bio-based/Low-VOC Leads the Market Driven by Green Chemistry Adoption and VOC Regulations
The widespread use of bio-based/low-VOC paint strippers is due to growing pressure on the use of volatile organic compounds (VOCs) and safety concerns at the work site, making their application increasingly popular. This subsegment has expanded significantly as both industries and consumers have pursued safer and non-toxic versions of traditional strippers.
This demand has increased in North America and Europe, where REACH regulations and EPA guidelines have compelled manufacturers to shift towards bio-based formulations. Increased interest of end users on the issues of environmental sustainability and indoor air quality has further supported the use of such products in residential and commercial applications.
The manufacturers have been working on areas such as NMP-free and low-odor formulations that comply with regulatory requirements, while maintaining performance.
Bio-based (NMP-free) Gains Momentum Amid Safer Chemical Reformulations
The base material that has witnessed significant growth in the paint stripper market is the bio-based (NMP-free) substance, supported by regulatory actions targeting harmful compounds such as N-Methyl-2-pyrrolidone (NMP Due to restrictions and bans issued by agencies such as the ECHA and U.S. EPA, companies have modified formulations to meet compliance requirements and shifted toward safer alternatives.
The reformulations have enabled access to sectors such as aerospace, automotive refinishing, and home industries, in which the most important concerns are reliability and sustainability. The demand for circular chemistry and the reduced exposure risks to workers have even given super jets to bio-based materials, to the extent that they are an inalienable component of product innovation pipelines.
Aerosol Spray Leads Adoption Due to User Convenience and DIY Segment Growth
The use of aerosol spray packaging in the paint stripper market has become prominent, mainly due to its ease of use, which remains unmatched compared to other packaging formats, particularly for DIY home renovation and small-scale applications.
The increase in home improvement activities during and after the coronavirus period, especially in North America and Europe, has contributed to the growing popularity of ready-to-use formats. This type of packaging is also favored in professional maintenance work because it is practical, generates less waste, and requires fewer tools.
The preference among consumers for portability, safety, and minimal mess during application has further encouraged the use of aerosol, making it suitable for stripping furniture, trims, and metal surfaces in both residential and commercial environments.
Competitive Analysis

The strategic diversification of the key players in the paint stripper industry has been carried out in the following fields: aerospace maintenance, automotive refinishing, marine restoration and industrial cleaning. The production of EcoProCote has focused on non-toxic, bio-based strippers as eco-friendly solutions for the market.
Sunnyside Corporation has continued to provide versatile formulations that cater to both the DIY and professional markets. Socomore has served the aerospace industry by utilizing special surface preparation and cleaning chemicals. Akzo Nobel N.V. has diversified its knowledge in the coating industry to develop efficient stripping products, which have improved safety and effectiveness standards.
3M has incorporated the element of innovation in the line of paint remover products with user-friendly products that emit low levels of fume. PPG Industries has invested in industrial-grade strippers, which focus on the quick removal and compatibility with most substrates.
Due to the intensive usage of soy-based, biodegradable strippers in education and restoration, the Franmar Chemical company has established itself. Dumond Chemicals has thrived due to multi-layered paint removers, which preserve tourism.
WM Barr has provided consumer-oriented solutions for branded products, which are widely available at retail stores. Henkel AG & Co. KGaA has focused on industrial and OEM customers, leveraging its core competencies in adhesion technologies.
With their efforts in line with the international environmental and safety regulations, these firms have marketed low-VOC, solvent-free as well as sustainable stripping products, which have increased their contributions towards the creation of contemporary surface treatment practices.
Key players of the paint stripper industry are EcoProCote, Sunnyside Corporation, Socomore, Akzo Nobel N.V., 3M, PPG Industries, Franmar Chemical, Dumond Chemicals, WM Barr, and Henkel AG & Co. KGaA.
Recent Development:
- In May 2025, EcoFast introduced EcoFast 100 HD, a high-performance, biodegradable paint stripper engineered for industrial and commercial use. Utilizing bio-solvents such as soy methyl ester and benzyl alcohol, it safely removes paints, adhesives, and coatings without harsh fumes or flammability risks, offering an eco-conscious alternative for multi-surface restoration and maintenance applications.
- In February 2025, OrganoClick’s subsidiary BIOkleen launched Paint Remover Eco, a groundbreaking, fully biobased solution formulated with cellulose-derived solvents. Free from fossil-based components, it offers comparable stripping performance on vertical and horizontal surfaces. The product aligns with global sustainability standards, catering to both professionals and consumers seeking eco-conscious, high-efficacy paint removal alternatives.
Fact.MR has provided detailed information about the price points of key manufacturers of the Paint Stripper Market positioned across regions, sales growth, production capacity, and speculative technological expansion in the recently published report.
Bibliography
- U.S. Environmental Protection Agency. (2024, March). Final risk management rule: Methylene chloride under TSCA. U.S. EPA.
- PPG Industries. (2024). Annual report 2024: Specialty coatings and chemicals segment. PPG Industries.
- U.S. Census Bureau. (2024). American Housing Survey: National housing stock age distribution. U.S. Census Bureau.
- Franmar Chemical. (2024). GSA contract listing: Bio-based paint and coating removers. Franmar Chemical.
- South Coast Air Quality Management District (SCAQMD). (2024). Rule 1113: Architectural coatings VOC limits. SCAQMD.
- Crown Commercial Service, UK. (2024). Framework agreement: Cleaning and chemical maintenance supplies. Crown Commercial Service.
This bibliography is provided for reader reference. The full Fact.MR report contains the complete reference list with primary research documentation.
This Report Addresses
- Market sizing and quantitative forecast metrics detailing the precise expenditure dedicated to paint stripper across major industrial sectors through 2036.
- Segmentation analysis mapping the adoption patterns of specific product type categories and evaluating the technical and economic factors driving segment share distribution.
- Regional deployment intelligence comparing growth trajectories across Asia Pacific, North America, Europe, Latin America, and Middle East and Africa.
- Regulatory compliance assessment analyzing how evolving standards and policies affect product specifications and market access in key consuming regions.
- Competitive posture evaluation tracking the positioning of leading producers and the structural factors determining competitive advantage.
- Capital investment strategic guidance defining the procurement and capacity planning considerations for industry participants.
- Supply chain risk analysis identifying the specific feedstock, logistics, and regulatory variables that constrain market expansion.
- Custom data delivery formats encompassing interactive dashboards, raw Excel datasets, and PDF narrative reports.
Paint Stripper Market Definition
Paint strippers are chemical formulations designed to soften, dissolve, or lift cured paint, varnish, lacquer, and coating layers from substrates including wood, metal, concrete, and composites. They are classified by active chemistry into solvent-based, caustic-based, acidic-based, and bio-based/low-VOC categories. End users apply them via brush-on, spray, or immersion methods depending on substrate geometry and coating type.
Paint Stripper Market Inclusions
Market scope covers global and regional revenue for paint stripper products across solvent-based, caustic-based, acidic-based, and bio-based/low-VOC product types. Packaging formats include aerosol spray, brush-on/gel, can/jerry can, and immersion format. End-use segments span industrial and manufacturing, construction, automotive and aerospace, and DIY/homeowners. The forecast period is 2026 to 2036.
Paint Stripper Market Exclusions
The scope excludes mechanical paint removal equipment such as heat guns, infrared systems, and abrasive blasting media. Coating application products, primer formulations, and surface preparation chemicals not designed for coating removal are outside the boundary. Industrial solvent cleaning agents used for degreasing rather than paint removal are excluded.
Paint Stripper Market Research Methodology
- Primary Research: Analysts engaged with procurement specialists, process engineers, and supply chain directors across producing and consuming regions to map the specific decision criteria triggering purchasing and specification changes.
- Desk Research: Data collection aggregated regulatory filings, trade body publications, standards body documentation, and company disclosures relevant to the product category.
- Market-Sizing and Forecasting: Baseline values derive from a bottom-up aggregation of production volumes and trade flows, applying region-specific demand curves to project adoption velocity through 2036.
- Data Validation and Update Cycle: Projections are tested against publicly reported industry expenditure guidance and cross-referenced with primary interview data to ensure internal consistency.
Scope of the Report

| Metric | Value |
|---|---|
| Quantitative Units | USD 1146.85 million to USD 1832.82 million, at a CAGR of 4.8% |
| Market Definition | Paint strippers are chemical formulations designed to soften, dissolve, or lift cured paint, varnish, lacquer, and coating layers from substrates including wood, metal, concrete, and composites. They are classified by active chemistry into solvent-based, caustic-based, acidic-based, and bio-based/low-VOC categories. |
| Product Type Segmentation | Solvent-based, Caustic-based, Acidic-based, Bio-based/Low-VOC |
| Base Material Segmentation | Bio-based, Petroleum-derived solvents, Acidic compounds, Caustic alkali |
| Packaging Segmentation | Aerosol Spray, Brush-on/Gel, Can / Jerry Can, Immersion Format |
| Application Segmentation | Architectural Renovation, Automotive Refinishing, Marine Surface Prep, DIY Furniture Restoration |
| End-User Segmentation | Industrial & Manufacturing, Construction, Automotive & Aerospace, DIY/Homeowners |
| Sales Channel Segmentation | Online Retail, Offline, Specialty Retailers |
| Regions Covered | North America, Latin America, Europe, East Asia, South Asia, Oceania, Middle East & Africa |
| Countries Covered | China, India, UK, Germany, USA, and 40 plus countries |
| Key Companies Profiled | Akzo Nobel N.V., PPG Industries, Henkel AG & Co. KGaA, 3M, WM Barr, Socomore, Dumond Chemicals, Sunnyside Corporation, Franmar Chemical, EcoProCote |
| Forecast Period | 2026 to 2036 |
| Approach | Hybrid top-down and bottom-up methodology reconciling production, trade, and consumption data with primary research validation. |
Segmentation of Paint Stripper Market Research
-
By Product Type :
- Solvent-based
- Caustic-based
- Acidic-based
- Bio-based/Low-VOC
-
By Base Material :
- Bio-based (NMP-free)
- Petroleum-derived solvents
- Acidic compounds
- Caustic alkali
-
By Packaging :
- Aerosol Spray
- Brush-on/Gel
- Can / Jerry Can
- Immersion Format
-
By Application :
- Architectural Renovation
- Automotive Refinishing
- Marine Surface Prep
- DIY Furniture Restoration
-
By End-User :
- Industrial & Manufacturing
- Construction
- Automotive & Aerospace
- DIY/Homeowners
-
By Sales Channel :
- Online Retail
- Offline (B2B Distributors)
- Specialty Retailers
-
By Region :
- North America
- Latin America
- Western Europe
- Eastern Europe
- East Asia
- South Asia & Pacific
- Middle East & Africa
- Frequently Asked Questions -
How large is the demand for Paint Stripper in the global market in 2026?
Demand for Paint Stripper in the global market is estimated to be valued at USD 1146.85 million in 2026.
What will be the market size of Paint Stripper in the global market by 2036?
Market size for Paint Stripper is projected to reach USD 1832.82 million by 2036.
What is the expected demand growth for Paint Stripper in the global market between 2026 and 2036?
Demand for Paint Stripper is expected to grow at a CAGR of 4.8% between 2026 and 2036.
Which Product Type is poised to lead global sales by 2026?
Solvent-based accounts for 49.0% share in 2026.
How is the Base Material segment structured in this report?
Bio-based holds a 45.0% share in 2026 within the Base Material segment.
What is the growth outlook for India in this report?
India is projected to grow at a CAGR of 6.2% during 2026 to 2036.
What is Paint Stripper and what is it mainly used for?
Paint strippers are chemical formulations designed to soften, dissolve, or lift cured paint, varnish, lacquer, and coating layers from substrates including wood, metal, concrete, and composites. They are classified by active chemistry into solvent-based, caustic-based, acidic-based, and bio-based/low-VOC categories.
How does Fact.MR build and validate the Paint Stripper forecast?
Forecasting models apply a hybrid top-down and bottom-up methodology starting with production and trade data, and cross-validate projections against primary research findings and quarterly industry data releases.

Author:
S.N. Jha

Editor:
Naved Ahmed