- Market Value (2025): USD 1.77 Bn
- Estimated Value (2026): USD 1.87 Bn
- Forecast Value (2036): USD 3.16 Bn
- CAGR (2026-2036): 5.4%
What is the Back Brace Market forecast to be worth by 2036?
USD 1.9 billion in 2026 to USD 3.2 billion by 2036, at a 5.4% CAGR.
- According to Fact.MR analysis, the back brace market was valued at USD 1.77 billion in 2025.
- Sales are projected to increase from USD 1.87 billion in 2026 to USD 3.16 billion by 2036.
- The market is forecast to record a 5.4% CAGR during 2026 to 2036 as patients obtain spinal supports for recovery and daily movement.
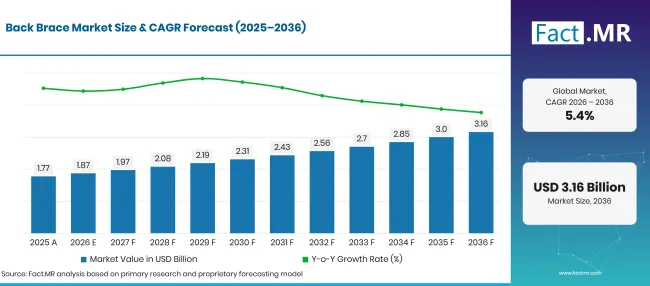
Factmr Back Brace Market Forecast Global | Source: Fact.MR
| Year | Basis | Market Value (USD billion) |
|---|---|---|
| 2025 | Actual | 1.77 |
| 2026 | Estimate | 1.87 |
| 2036 | Forecast | 3.16 |
| CAGR 2026 to 2036 | Forecast period | 5.4% |
Source: Fact.MR analysis. Updated Oct 19, 2026
What are the defining numbers behind Back Brace Market growth?
USD 1.3 billion absolute opportunity between 2026 and 2036, with soft braces and retail pharmacies shaping purchases.
- Demand Drivers in the Market
- Orthopedic clinicians select support according to the part of the spine requiring control. Adjustable lumbar braces are suited to patients whose recovery plans call for measured trunk support.
- Adults managing recurring back symptoms often compare flexible belts for comfort during routine movement. The selection process depends on individual assessment because a soft support is different from an orthosis intended for spinal immobilization.
- Hospital discharge teams arrange spinal orthoses when post-operative instructions call for controlled movement. Clear fitting guidance gives patients a way to follow the prescribed wearing schedule after leaving a clinic.
- Pharmacy customers assess sizing and ease of fastening before buying everyday braces. A product that is difficult to tighten or uncomfortable against clothing faces a higher risk of being set aside.
- Key Segments Analyzed
- By Product Type: Soft Braces hold 42.3% share in 2026, reflecting use where flexible lumbar support is appropriate.
- By Application: Post-Operative Recovery accounts for 38.7% share in 2026, linked to recovery plans requiring trunk support.
- By Distribution Channel: Retail Pharmacies capture 67.2% share in 2026, supported by accessible purchasing and sizing advice.
- By End-User: Adults account for 71.8% share in 2026, covering a broad group of prescribed and everyday users.
- Analyst Opinion at Fact.MR
- Shambhu Nath Jha, Principal Consultant at Fact.MR, states, “Back brace sales are closely tied to correct fitting and the level of support required for each user. Manufacturers that make sizing, fastening, and intended use easy to understand can reduce unsuitable purchases.”
- Strategic Implications
- Manufacturers should give clear size charts and fitting instructions for each lumbar brace so users understand how to wear the product consistently.
- Orthopedic clinics should match brace rigidity to the treatment plan and explain when the patient needs a professional adjustment.
- Retail pharmacies should separate flexible everyday supports from prescribed stabilizing braces when explaining available products.
- Distributors should keep common sizes available and give clinicians clear product specifications to compare support levels before ordering.
Germany is projected to grow at a 6.7% CAGR, supported by its established orthotic care system and older patient base. Brazil is expected to expand at 6.1% as rehabilitation access improves. The United States stands at 5.5%, followed by the United Kingdom at 4.9% and Japan at 4.4%.
How does the Back Brace Market break down by segment?
Soft Braces lead with 42.3% share, while Post-Operative Recovery accounts for 38.7% share in 2026.
Which Product Type dominates?
Soft Braces holds 42.3% share in 2026.
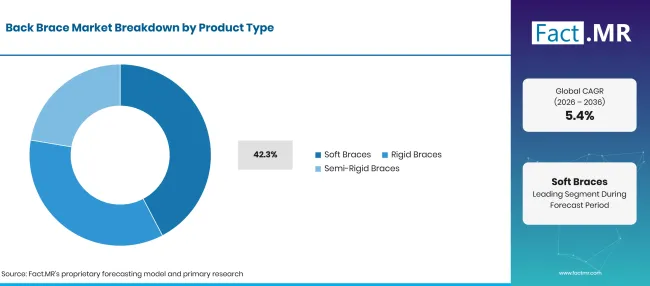
Factmr Back Brace Market Breakdown Product Type | Source: Fact.MR
| Which Product Type dominates | Share (2026) |
|---|---|
| Soft Braces (Leading segment) | 42.3% |
| Other segments combined | 57.7%* |
| Total | 100.0% |
Source: Fact.MR analysis. Updated Oct 19, 2026
Soft braces are estimated to capture a sizeable share of purchases where a flexible lumbar wrap suits the user’s support needs. Their fabric construction and adjustable closures allow wearers to manage pressure and fit during routine tasks. Rigid braces serve narrower clinical instructions that call for firmer control of the trunk. Semi-rigid designs sit between these groups for patients whose treatment plan requires a more structured support without full immobilization.
What leads the Application segment?
Post-Operative Recovery accounts for 38.7% share in 2026.
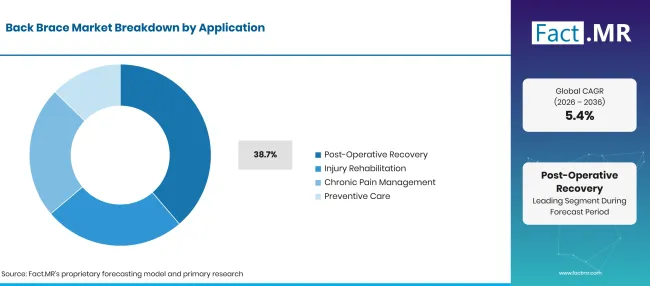
Factmr Back Brace Market Breakdown Application | Source: Fact.MR
| What leads the Application segment | Share (2026) |
|---|---|
| Post-Operative Recovery (Leading segment) | 38.7% |
| Other segments combined | 61.3%* |
| Total | 100.0% |
Source: Fact.MR analysis. Updated Oct 19, 2026
Post-operative recovery is projected to anchor a substantial part of back-brace sales because the support choice forms part of a defined care plan. Clinicians may specify a lumbar or thoracolumbar orthosis according to the operated region. Injury rehabilitation requires similar attention to the location and stability of the injury. Chronic pain management brings different buying habits because brace use should be guided by individual assessment.
Which Distribution Channel serves the largest share?
Retail Pharmacies lead with 67.2% share in 2026.
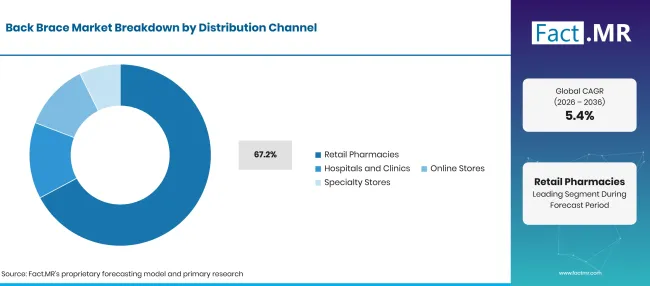
Factmr Back Brace Market Breakdown Distribution Channel | Source: Fact.MR
| Which Distribution Channel serves the largest share | Share (2026) |
|---|---|
| Retail Pharmacies (Leading segment) | 67.2% |
| Other segments combined | 32.8%* |
| Total | 100.0% |
Source: Fact.MR analysis. Updated Oct 19, 2026
Retail pharmacies are expected to remain the main selling channel for widely available back supports. Customers often want to examine size and fastening before buying, so clear packaging information helps them avoid an unsuitable purchase. Hospitals and clinics handle more specialized fittings when treatment requires a prescribed orthosis. Online stores serve people who already know the required model or measurements.
How does End-User purchasing shape sales?
Adults capture 71.8% share in 2026.
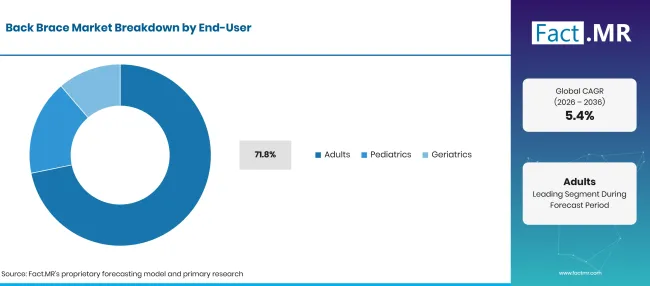
Factmr Back Brace Market Breakdown End User | Source: Fact.MR
| How does End-User purchasing shape sales | Share (2026) |
|---|---|
| Adults (Leading segment) | 71.8% |
| Other segments combined | 28.2%* |
| Total | 100.0% |
Source: Fact.MR analysis. Updated Oct 19, 2026
Adult users are forecast to account for most brace spending across recovery and everyday support needs. Their purchases range from flexible lumbar belts to clinician-selected braces designed for more controlled movement. Pediatric patients require a different fitting process because body size and treatment instructions vary with growth.
What is accelerating Back Brace Market adoption, and what is holding it back?
Post-operative support needs encourage sales; fitting errors and spending limits restrain purchases.
Drivers Impact Analysis
| DRIVER | (~) % IMPACT ON CAGR | GEOGRAPHIC RELEVANCE | IMPACT TIMELINE |
|---|---|---|---|
| Clinical recovery plans | +1.0% | Global | Medium term (2–4 years) |
| Pharmacy access | +0.8% | North America, Europe | Short term (<= 2 years) |
| Older adult population | +0.7% | Germany, Japan | Long term (>= 4 years) |
| Comfort-focused design | +0.5% | Global | Medium term (2–4 years) |
| Repeat size availability | +0.4% | Global | Short term (<= 2 years) |
Source: Fact.MR analysis. Updated Oct 19, 2026
Opportunity Impact Analysis
| OPPORTUNITY | (~) % IMPACT ON CAGR | GEOGRAPHIC RELEVANCE | IMPACT TIMELINE |
|---|---|---|---|
| Better adjustable closures | +0.8% | Global | Medium term (2–4 years) |
| Clinical fitting education | +0.6% | Europe, North America | Medium term (2–4 years) |
| Clear pharmacy sizing | +0.5% | Global | Short term (<= 2 years) |
| Post-discharge access | +0.4% | Global | Medium term (2–4 years) |
Source: Fact.MR analysis. Updated Oct 19, 2026
Restraints Impact Analysis
| RESTRAINT | (~) % IMPACT ON CAGR | GEOGRAPHIC RELEVANCE | IMPACT TIMELINE |
|---|---|---|---|
| Incorrect brace selection | -0.8% | Global | Short term (<= 2 years) |
| Comfort and heat | -0.6% | Global | Medium term (2–4 years) |
| Prescription cost limits | -0.5% | United States, Europe | Medium term (2–4 years) |
| Limited fitting services | -0.4% | Latin America | Long term (>= 4 years) |
Source: Fact.MR analysis. Updated Oct 19, 2026
Which countries are scaling the Back Brace Market through 2036?
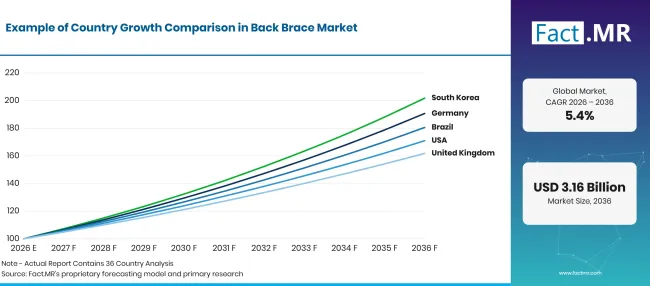
Factmr Back Brace Market Growth Index | Source: Fact.MR
| Country | CAGR (2026–2036) |
|---|---|
| Germany | 6.7% |
| Brazil | 6.1% |
| United States | 5.5% |
| United Kingdom | 4.9% |
| Japan | 4.4% |
Source: Fact.MR analysis. Updated Oct 19, 2026
Why is Germany leading back brace adoption?
6.7% CAGR, influenced by an established orthotic supply network and older patients.
German orthotic workshops and healthcare providers have established routes for fitting spinal supports after treatment. Destatis reported in August 2026 that 19.3 million residents were aged 65 or older in 2025 [1]. Older patients form an important group for mobility assessment, while younger adults also use back braces for suitable injury and recovery needs. Manufacturers such as Bauerfeind serve patients through specialist products and fitting support.
How is Brazil developing back brace sales?
6.1% CAGR, shaped by changing age profiles and access to fitted orthopedic supports.
Brazilian pharmacies serve adults choosing flexible lumbar supports, while orthopedic providers arrange more specialized fittings for patients recovering from injury. IBGE reported in December 2025 that Brazil had 34.1 million people aged 60 or older in 2024 [2]. The older population provides context for rehabilitation services and long-term mobility needs. Local orthopedic stores help customers compare sizes, and healthcare professionals assess when a firm brace is appropriate.
What shapes the United States back brace outlook?
5.5% CAGR, linked to clinical orthoses and an established retail channel.
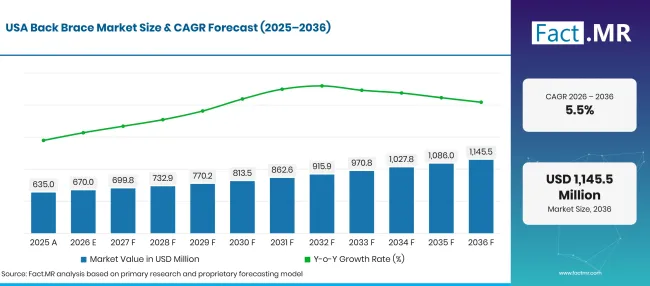
Factmr Back Brace Market Forecast Usa | Source: Fact.MR
In the United States, spinal orthoses are selected by clinicians when recovery instructions call for support or controlled trunk motion. The Centers for Medicare & Medicaid Services released its October 2026 DMEPOS fee schedule in October 2026 [3]. In its February 2026 update, CMS confirmed a 2% adjustment for certain DMEPOS fee schedule amounts that were not adjusted using Competitive Bidding Program information [7]. Pharmacies and online stores serve adults purchasing flexible back belts for suitable everyday uses.
How is the United Kingdom supporting back brace access?
4.9% CAGR, reflecting rehabilitation needs and patient fitting choices.
UK rehabilitation teams assess a patient’s ability to move and the support required after injury or treatment. The Department for Work and Pensions reported in its 2025 publication that back or neck problems accounted for 41.1% of disabled people whose main condition was musculoskeletal in 2024/25 [4]. Specialist orthotic services select rigid braces when a treatment plan requires controlled motion. Pharmacies provide access to simpler lumbar supports for appropriate everyday uses.
Why is Japan maintaining steady back brace growth?
4.4% CAGR, influenced by an older population and careful support selection.
Japan’s orthotic providers work with older patients who may need support following treatment as well as adults managing condition-specific spinal needs. The Statistics Bureau reported in September 2026 that 36.24 million people were aged 65 or older [6]. Local clinicians assess the degree of movement control required before choosing flexible or rigid supports. Rehabilitation services help patients learn how to wear a prescribed orthosis correctly.
Who leads the Back Brace Market?
Bauerfeind supplies lumbar supports, while Össur, part of Embla Medical, markets spinal orthoses including Miami LSO. The Miami LSO is designed for lumbar support and selected recovery uses [5]. Aspen Medical Products develops spinal braces that are fitted for specified degrees of support.
Enovis and Breg supply orthopedic supports, including spinal products within broader rehabilitation ranges. DeRoyal Industries and Thuasne serve clinicians and users requiring defined levels of support. Medi offers back orthoses through its medical product range. BSN medical products are associated with Essity, so the portfolio is identified under its parent brand.
Which companies are the key providers?
Key companies include Bauerfeind AG; Embla Medical hf. (Össur); Enovis Corporation; Breg Inc.; Essity AB (Actimove); DeRoyal Industries; Aspen Medical Products; Thuasne Group; medi GmbH.
- Bauerfeind AG
- Embla Medical hf. (Össur)
- Enovis Corporation
- Breg Inc.
- Essity AB (Actimove)
- DeRoyal Industries
- Aspen Medical Products
- Thuasne Group
- medi GmbH
Bibliography
- [1] Statistisches Bundesamt (Destatis). (2026, August 18). Ältere Menschen.
- [2] Instituto Brasileiro de Geografia e Estatística. (2025, December 3). Summary of Social Indicators 2025.
- [3] Centers for Medicare & Medicaid Services. (n.d.). DMEPOS fee schedule files.
- [4] Department for Work and Pensions. (2025, November 4). The employment of disabled people 2025. GOV.UK.
- [5] Össur. (n.d.). Miami LSO™.
- [6] Statistics Bureau of Japan. (2026, September 20). [Statistics on the elderly in Japan—In connection with Respect for the Aged Day] (Statistical Topics No. 149).
- [7] Centers for Medicare & Medicaid Services. (2026, February 2). DMEPOS fee schedule: CY 2026 update (MM14326).
This Report Answers
- The report examines how brace flexibility affects clinical selection and everyday lumbar support.
- Segmentation describes the roles of soft braces and post-operative recovery in 2026 sales.
- Country comparison covers Germany, Brazil, the United States, the United Kingdom and Japan.
- Distribution analysis explains pharmacy access alongside professional fitting for prescribed devices.
- Competitive assessment separates spinal orthosis specialists from broader orthopedic suppliers.
What does the Back Brace Market cover?
The market covers external supports worn around the lower back or trunk. Products range from flexible fabric braces to rigid and semi-rigid spinal orthoses used under clinical direction. Adjacent orthopedic braces and support systems include equipment for other joints as well as the spine. The scope is limited to the back-brace portion of that wider category.
What is included in the scope?
The scope includes lumbar support belts offered through pharmacies and products fitted in orthopedic care settings. Braces used during post-operative recovery and injury rehabilitation are counted when they are commercial external supports. Chronic pain management and preventive uses enter only where the product fits the defined back-brace category. The assessment also compares sizing information and the route through which the user obtains the brace.
What is excluded from the scope?
The scope excludes surgical spinal implants and internal fixation equipment. It also excludes general garments without a defined back-support function. Neck-only collars are outside the core category unless included as part of a combined trunk orthosis. Clinical treatment services are separate from the sale of the physical brace.
How Was the Analysis Built?
The analysis draws on 120+ sources, 35+ company portfolios, 25+ countries, and more than 20 industry interviews.
- Primary Research: Primary research includes discussions with manufacturers, service providers, technology developers, distributors, end users, and subject-matter experts. These conversations examine purchasing priorities, product adoption, operational challenges, approval requirements, competitive positioning, and the factors that influence wider market acceptance.
- Desk Research: Desk research covers government statistics, regulatory publications, company filings, trade data, technical studies, industry associations, standards, public policy, and other authoritative sources. Every source used in the analysis is documented in the bibliography.
- Market Sizing and Forecasting: Market estimates combine historical performance, demand indicators, pricing and volume trends, segment shares, company participation, country-level growth, adoption patterns, investment activity, and barriers to market expansion.
- Data Validation and Update Cycle: Findings are validated by comparing primary interviews with public data, company activity, regulatory changes, trade patterns, and industry developments. Regular updates review new product launches, capacity changes, partnerships, approvals, and shifts in commercial adoption.
Segmentation
What is the report’s scope and coverage?
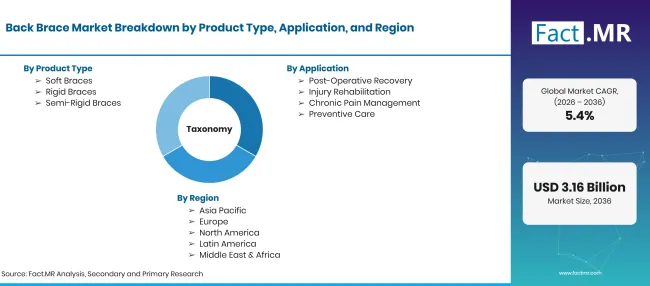
Factmr Back Brace Market Taxonomy | Source: Fact.MR
| Attribute | Details |
|---|---|
| Quantitative Units | USD billion |
| Market Definition | External back and trunk supports sold for prescribed stabilization or everyday lumbar support. |
| Product Type | Soft Braces; Rigid Braces; Semi-Rigid Braces |
| Application | Post-Operative Recovery; Injury Rehabilitation; Chronic Pain Management; Preventive Care |
| Distribution Channel | Retail Pharmacies; Hospitals and Clinics; Online Stores; Specialty Stores |
| End-User | Adults; Pediatrics; Geriatrics |
| Regions Covered | North America; Latin America; Europe; East Asia; other global regions |
| Countries Covered | Germany; Brazil; United States; United Kingdom; Japan |
| Companies Profiled | Bauerfeind; Össur; Enovis; Breg; Essity/BSN; DeRoyal; Aspen; Thuasne; medi |
| Forecast Period | 2026 to 2036 |
| Approach | Review of clinical applications, product specifications, public demographics and distribution routes |
Source: Fact.MR analysis. Updated Oct 19, 2026
How is the market segmented?
-
By Product Type:
- Soft Braces
- Rigid Braces
- Semi-Rigid Braces
-
By Application:
- Post-Operative Recovery
- Injury Rehabilitation
- Chronic Pain Management
- Preventive Care
-
By Distribution Channel:
- Retail Pharmacies
- Hospitals and Clinics
- Online Stores
- Specialty Stores
-
By End-User:
- Adults
- Pediatrics
- Geriatrics
-
By Region:
- North America
- Latin America
- Western Europe
- Eastern Europe
- East Asia
- South Asia & Pacific
- Middle East & Africa
Frequently Asked Questions
How big is the Back Brace Market in 2026?
What is the CAGR of the Back Brace Market from 2026 to 2036?
Which product type leads the Back Brace Market?
Which application leads the Back Brace Market?
Who are the leading companies in the Back Brace Market?
Who worked on this report


Preview the report firsthand - request a free sample
Free SampleGet the brochure for pricing and purchase details
Download PDF