- Market Value (2025): USD 3.9 Bn
- Estimated Value (2026): USD 4.5 Bn
- Forecast Value (2036): USD 17.9 Bn
- CAGR (2026-2036): 14.8%
What is the Building Foresight Platforms Market forecast to be worth by 2036?
USD 4.5 billion in 2026 to USD 17.9 billion by 2036 at a 14.8% CAGR.
- The Building Foresight Platforms Market reached USD 3.9 billion in 2025.
- Demand is projected to increase from USD 4.5 billion in 2026 to USD 17.9 billion by 2036.
- The market is forecast to record 14.8% CAGR from 2026 to 2036 as energy-cost pressure, automation mandates and richer building telemetry turn forecasting and predictive maintenance into portfolio operating tools.
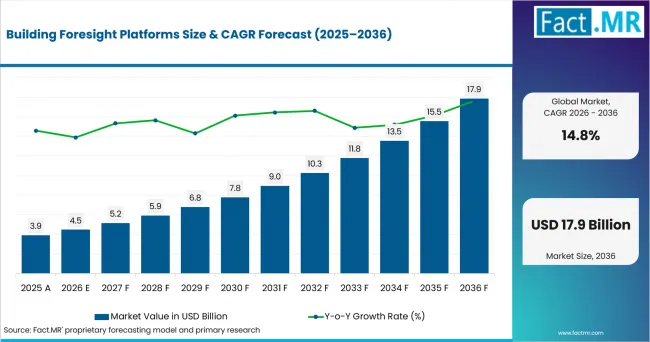
Building Foresight Platforms Value Analysis | Source: Fact.MR
What are the defining numbers behind Building Foresight Platforms Market growth?
An absolute opportunity of USD 13.4 billion is expected between 2026 and 2036.
- Demand Drivers in the Market
- European building policy is expanding automation and control expectations. The revised Energy Performance of Buildings Directive includes building automation and control requirements for non-residential systems.
- Older portfolios need a way to prioritize retrofit and maintenance. Singapore's BCA reported that close to 66% of buildings had been greened by December 2025 toward an 80% goal for 2030.
- Vendors are converting live building signals into maintenance forecasts. Honeywell Forge Performance+ uses real-time analytics, equipment models and dashboards to identify issues and track corrective action.
- Key Segments Analyzed
- Energy and load forecasting represents 27.0% of Platform Function demand in 2026. Energy and load forecasting leads because every large building has a recurring energy bill, capacity limit and operating schedule.
- Commercial offices account for 28.0% of the 2026 Building Type mix. Commercial offices lead through large multi-site portfolios, variable occupancy and pressure to manage energy, comfort and space together.
- BMS and HVAC telemetry is estimated at 34.0% of Data Source demand in 2026. BMS and HVAC telemetry leads because it supplies the operating state of the equipment responsible for much of a commercial building's energy and comfort.
- Predictive ML captures 33.0% of the Analytics Layer mix in 2026. Predictive machine learning leads because equipment and load behavior vary by weather, schedule and asset condition.
- Analyst Opinion at Fact.MR
- Shambhu Nath Jha, Principal Consultant at Fact.MR, states, “Building foresight is useful when a forecast leads to a work order, a setpoint change or a capital decision. Owners will be cautious with black-box claims. Vendors should show the operating baseline, the confidence around a prediction and the action a facilities team can safely take.”
- Strategic Implications
- Platform vendors should join energy, maintenance and comfort priorities in one queue. Schneider Electric's Building Advisor prioritizes HVAC tasks using a score that balances carbon, energy, asset performance and occupant comfort.
- Control suppliers should make forecasting available across mixed building estates. Siemens Building X Energy Manager supports monitoring and forecasting, while Lifecycle Twin brings asset and model context into operations.
- Service providers should prove that predictive alerts alter maintenance outcomes. Johnson Controls stated in April 2025 that OpenBlue service experts can identify certain chiller faults up to 48 hours before problems emerge and reported 82% failure accuracy for the cited use case.
Germany's 17.8% CAGR through 2036 reflects the combination of building-energy pressure and formal automation requirements. The UK is projected at 14.2% as performance and smart-readiness metrics evolve, while the USA reaches 13.1% on large portfolio operations. France records 11.9% around energy-flexible retrofits; Singapore is at 11.5% as Smart FM programs address an aging, control-diverse building stock.
How does the Building Foresight Platforms Market break down by segment?
Energy and load forecasting, Commercial offices, BMS and HVAC telemetry, and Predictive ML
Which Platform Function leads?
Energy and load forecasting: 27.0% share in 2026.
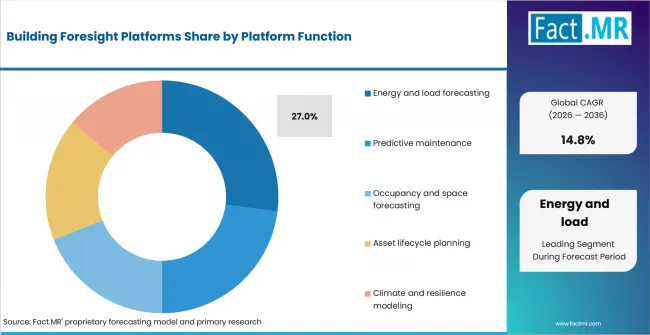
Building Foresight Platforms Analysis By Platform Function | Source: Fact.MR
Energy and load forecasting leads because every large building has a recurring energy bill, capacity limit and operating schedule. Forecasts can guide setpoints, demand response and budget planning without waiting for equipment to fail.
Why do Commercial offices lead Building Type?
Commercial offices: 28.0% share in 2026.
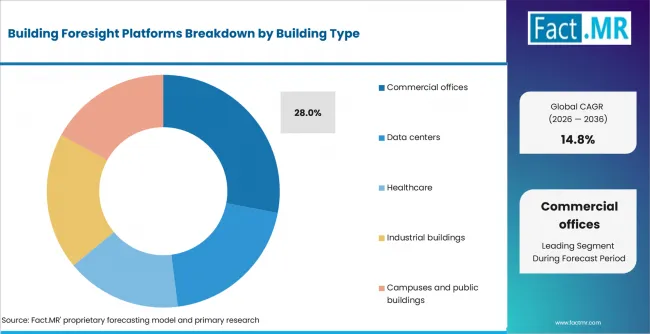
Building Foresight Platforms Analysis By Building Type | Source: Fact.MR
Commercial offices lead through large multi-site portfolios, variable occupancy and pressure to manage energy, comfort and space together. A consistent platform lets owners compare assets that use different local control systems.
Which Data Source anchors most platforms?
BMS and HVAC telemetry: 34.0% share in 2026.
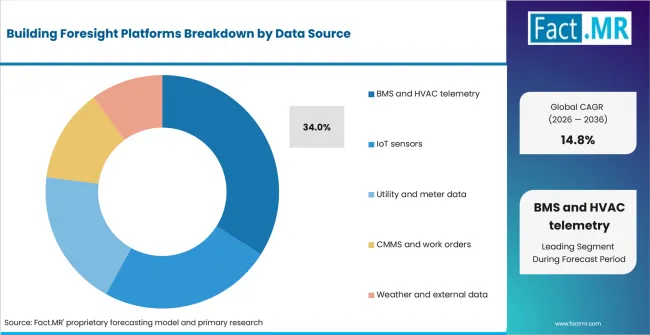
Building Foresight Platforms Analysis By Data Source | Source: Fact.MR
BMS and HVAC telemetry leads because it supplies the operating state of the equipment responsible for much of a commercial building's energy and comfort. Trend histories, alarms, setpoints and valve or fan behavior create a practical base for forecasting.
What supports Predictive machine learning?
Predictive ML: 33.0% share in 2026.
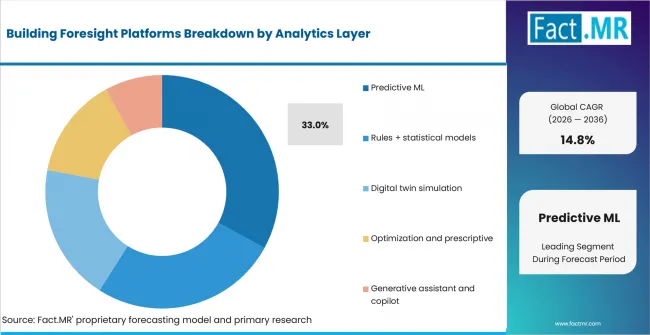
Building Foresight Platforms Analysis By Analytics Layer | Source: Fact.MR
Predictive machine learning leads because equipment and load behavior vary by weather, schedule and asset condition. Models can learn those interactions across long telemetry histories and surface deviations earlier than fixed thresholds alone.
What is accelerating Building Foresight Platforms Market adoption, and what is holding it back?
Adoption is accelerating as owners seek lower energy cost, fewer emergency repairs and clearer retrofit priorities. Poor sensor quality, fragmented controls, model explainability and unclear responsibility for acting on predictions remain the central restraints.
Drivers Impact Analysis
| DRIVER | (~) % IMPACT ON CAGR | GEOGRAPHIC RELEVANCE | IMPACT TIMELINE |
|---|---|---|---|
| Building automation and energy rules | +1.8% | Germany, UK, France, EU | Short term (<= 2 years) |
| Predictive maintenance service models | +1.4% | USA, Europe, Singapore | Medium term (2-4 years) |
| Portfolio energy and load volatility | +1.1% | Global commercial buildings | Short term (<= 2 years) |
| Digital twins and richer asset context | +0.8% | Europe, North America, Asia | Long term (>= 4 years) |
- Building automation and energy rules: Owners need better controls and evidence as performance requirements move from design intent into operations.
- Predictive maintenance service models: Fault detection becomes budgetable when alerts are tied to remote diagnostics, prioritized work and measured avoidance.
- Portfolio energy and load volatility: Weather, tariffs, electrification and variable occupancy increase the value of a short-term demand view.
Opportunity Impact Analysis
| OPPORTUNITY | (~) % IMPACT ON CAGR | GEOGRAPHIC RELEVANCE | IMPACT TIMELINE |
|---|---|---|---|
| Retrofit overlays for mixed BMS estates | +1.1% | USA, UK, Singapore | Short term (<= 2 years) |
| Climate and resilience scenario modules | +0.9% | Europe, North America, Asia | Medium term (2-4 years) |
| Generative maintenance copilots | +0.6% | Global enterprise portfolios | Long term (>= 4 years) |
- Retrofit overlays for mixed BMS estates: Vendor-neutral connectors can create portfolio visibility without replacing every field controller.
- Climate and resilience scenario modules: Owners can test heat, outage and weather assumptions against asset capacity and continuity plans.
- Generative maintenance copilots: Assistants can summarize alarms and suggest procedures, provided asset context and final approval remain controlled.
Restraints Impact Analysis
| RESTRAINT | (~) % IMPACT ON CAGR | GEOGRAPHIC RELEVANCE | IMPACT TIMELINE |
|---|---|---|---|
| Incomplete or unreliable telemetry | -0.9% | Global brownfield buildings | Short term (<= 2 years) |
| Integration across proprietary controls | -0.7% | Global | Medium term (2-4 years) |
| Weak trust in unexplained predictions | -0.5% | Healthcare, public and critical sites | Long term (>= 4 years) |
- Incomplete or unreliable telemetry: Missing sensors, overridden setpoints and mislabeled points can make a sophisticated model confidently wrong.
- Integration across proprietary controls: Portfolio owners need normalized asset identities and trend histories across different BMS generations.
- Weak trust in unexplained predictions: Facilities teams will ignore alerts that lack a cause, confidence range or safe next action.
Which countries are scaling the Building Foresight Platforms Market through 2036?
- Germany gives energy forecasting a direct operating mandate across complex non-residential buildings.
- The UK is adding forward-looking digital performance signals to a familiar disclosure and audit environment.
- The USA rewards platforms that can compare many sites and translate anomalies into service or capital priorities.
- France creates value at the intersection of building renovation, grid responsiveness and open asset information.
- Singapore's dense, cooling-intensive estate offers clear savings, but legacy-control integration limits rollout speed.
The country outlook turns on building age, control-system readiness, energy policy and facilities labor rather than a single adoption curve. Regional coverage spans North America, Latin America, Western Europe, Eastern Europe, East Asia, South Asia & Pacific, Middle East & Africa.
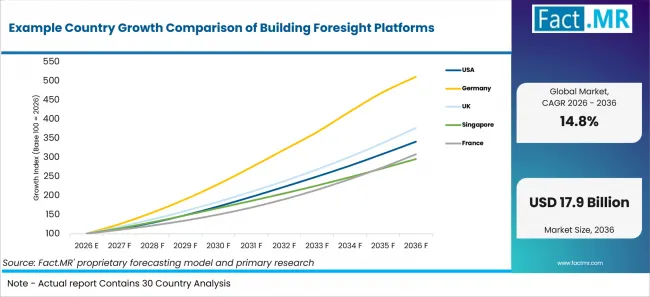
Example Country Growth Comparison Of Building Foresight Platforms | Source: Fact.MR
| Country | CAGR (2026-2036) |
|---|---|
| USA | 13.1% |
| Germany | 17.8% |
| UK | 14.2% |
| Singapore | 11.5% |
| France | 11.9% |
What makes the USA a portfolio market?
13.1% CAGR, supported by large commercial estates and performance-based operations.
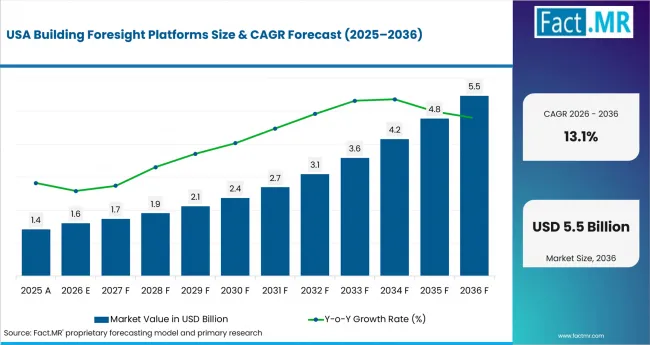
Building Foresight Platforms Country Value Analysis | Source: Fact.MR
U.S. building owners can spread platform investment across offices, campuses, healthcare and federal facilities, which makes cross-site benchmarking commercially useful. The Department of Energy's FEMP guidance treats energy management information systems as tools for tracking whole-building and interval performance. Adoption grows when forecasts connect utility cost, comfort and maintenance priorities rather than producing a separate analytics dashboard.
What is supporting Germany's 17.8% CAGR through 2036?
17.8% CAGR, driven by building-energy pressure and automation requirements.
Buildings account for roughly 35% of Germany's final energy use, according to the federal economic ministry, making operational efficiency a national cost and decarbonization issue. The strongest platform case is in non-residential portfolios where BMS telemetry can guide load, maintenance and retrofit sequencing. High engineering standards also favor vendors that can document model logic and integrate with installed controls.
How is the UK broadening performance signals?
14.2% CAGR, supported by energy disclosure and a move toward smart-readiness metrics.
The UK is extending building performance beyond a static asset rating. EPC reforms announced in March 2026 include a smart-readiness metric and a new Home Energy Model, while commercial organizations already manage ESOS and SECR information. Platforms can add value by forecasting which control change or maintenance action will improve a measured outcome before capital is committed.
What is distinctive about Singapore's installed base?
11.5% CAGR, supported by aging buildings, cooling intensity and Smart FM programs.
More than half of Singapore's buildings were expected to be at least 30 years old by 2025, giving foresight platforms a large retrofit canvas. BCA's Green Building Masterplan reported that nearly 66% of buildings had been greened by December 2025 toward an 80% target for 2030. Heat, humidity and cooling loads make early fault detection and load forecasting valuable, but fragmented legacy controls can slow scaling across portfolios.
Where does France apply foresight first?
11.9% CAGR, supported by energy-flexible buildings and public or commercial retrofit programs.
France's opportunity is strongest where building controls can respond to energy price, grid conditions and renovation plans. ADEME's 2025 participation in IEA building research includes grid-integrated control, open BIM and energy-flexible buildings. Platforms gain traction when they connect weather and occupancy expectations with HVAC operation, then preserve a clear record for facilities teams.
Who leads the Building Foresight Platforms Market?
Schneider Electric, Siemens, Honeywell, Johnson Controls, BrainBox AI (a Trane Technologies company) and Autodesk.
Schneider Electric leads through EcoStruxure Building Operation, Building Advisor and broader power-management integration. Its strength is combining HVAC, electrical, microgrid and facility information inside an operating environment.
Siemens competes through Building X applications for energy, sustainability, comfort and lifecycle information. The platform is positioned where owners want cloud analytics linked to established building automation and digital-twin assets.
Honeywell brings Forge Performance+ for Buildings and deep HVAC or control domain knowledge. Johnson Controls competes through OpenBlue, predictive services and a unified building information platform spanning equipment and space use.
BrainBox AI now operates as a Trane Technologies company following completion of the acquisition in January 2025. Its autonomous HVAC and generative building capabilities add a software-led route to Trane's equipment and service base. Autodesk participates through BIM and digital-twin workflows that support lifecycle planning.
Competition is moving from dashboards to closed operating loops. Integration breadth, model transparency, service delivery and the ability to measure avoided energy or downtime decide whether a pilot becomes a portfolio standard.
Which companies are the key providers?
Key companies include Schneider Electric; Siemens; Honeywell; Johnson Controls; BrainBox AI (a Trane Technologies company); Autodesk.
- Schneider Electric
- Siemens
- Honeywell
- Johnson Controls
- BrainBox AI (a Trane Technologies company)
- Autodesk
Bibliography
- European Commission. (2026). Energy Performance of Buildings Directive implementation and building automation requirements.
- European Commission. (2026, June). Smart Readiness Indicator progress report.
- U.S. Department of Energy, Federal Energy Management Program. (2026). Energy management information systems.
- U.S. Department of Energy, Federal Energy Management Program. (2026). Operations and maintenance best practices.
- Department for Energy Security and Net Zero. (2026, March). Energy Performance Certificate reform.
- Building and Construction Authority, Singapore. (2025). Singapore Green Building Masterplan progress.
- Federal Ministry for Economic Affairs and Energy, Germany. (2026). Energy use in buildings.
- ADEME. (2025, July). French participation in IEA Energy in Buildings and Communities research tasks.
- Schneider Electric. (2026). EcoStruxure Building Advisor and Building Operation.
- Siemens. (2026). Building X Energy Manager and Lifecycle Twin.
- Honeywell. (2026). Forge Performance+ for Buildings Predictive Maintenance.
- Johnson Controls. (2025, April 1). Predictive is more productive.
- Trane Technologies. (2025, January 3). Trane Technologies completes acquisition of BrainBox AI.
This Report Answers
- The report explains how building foresight platforms demand is distributed across Platform Function, Building Type, Data Source and Analytics Layer.
- Segment analysis identifies the 2026 leaders and explains their purchase logic: Platform Function: Energy and load forecasting at 27.0%; Building Type: Commercial offices at 28.0%; Data Source: BMS and HVAC telemetry at 34.0%; Analytics Layer: Predictive ML at 33.0%.
- Country comparisons link the USA, Germany, UK, Singapore and France to their different building-age profiles, control-system readiness, energy policy and facilities-labor constraints.
- Competitive analysis reviews current positions for Schneider Electric, Siemens, Honeywell, Johnson Controls, BrainBox AI (a Trane Technologies company) and Autodesk.
- Application analysis tests building automation and energy rules against the limiting effect of incomplete or unreliable telemetry.
What does the Building Foresight Platforms Market cover?
Software platforms that forecast building energy, equipment condition, occupancy, space use, asset lifecycle or climate resilience using operational and external information.
What is included in the scope?
The scope includes energy and load forecasting, predictive maintenance, occupancy and space forecasting, asset lifecycle planning, and climate or resilience modeling. Subscription, license and bundled analytics revenue is included.
Platforms may use BMS and HVAC telemetry, IoT sensors, utility meters, maintenance records, weather and other external information. Predictive machine learning, statistical models, digital twins, optimization and controlled assistant functions are covered.
What is excluded from the scope?
The scope excludes building-management hardware, field controllers, sensors and HVAC equipment sold without a foresight platform. General facility-management software is excluded when it lacks predictive or scenario capability.
Architecture design services, utility energy supply and stand-alone BIM authoring are outside the market. One-time energy audits without a reusable platform component are not counted.
How Was the Analysis Built?
The analysis draws on 120+ sources, 35+ company portfolios, 25+ countries, and more than 20 industry interviews.
- Primary Research: Interviews cover manufacturers, technology developers, integrators, channel partners, end users and subject-matter experts relevant to this market. Discussions test purchase triggers, specification tradeoffs, implementation barriers, supplier positioning and the conditions required for wider commercial adoption.
- Desk Research: Research covers government statistics, regulatory publications, standards, company announcements, technical studies, trade information and industry associations. Published claims used in the analysis are documented in the bibliography.
- Market Sizing and Forecasting: Sizing combines active building and portfolio subscriptions, analytic module attachment, license value, implementation components and service-linked platform revenue. Forecasts test automation rules, energy prices, retrofit rates, telemetry readiness, predictive maintenance adoption and digital-twin penetration by building type.
- Data Validation and Update Cycle: Findings are triangulated across interviews, public evidence, company activity, policy changes, trade patterns and implementation signals. Updates review product launches, capacity shifts, partnerships, approvals, procurement behavior and material changes in commercial adoption.
What is the report's scope and coverage?
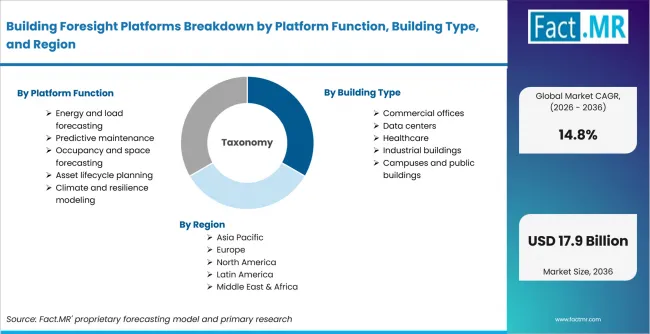
Building Foresight Platforms Breakdown By Platform Function, Building Type, And Region | Source: Fact.MR
| Attribute | Details |
|---|---|
| Quantitative Units | USD Billion |
| Market Definition | Software platforms that forecast building energy, equipment condition, occupancy, space use, asset lifecycle or climate resilience using operational and external information. |
| Platform Function | Energy and load forecasting; Predictive maintenance; Occupancy and space forecasting; Asset lifecycle planning; Climate and resilience modeling |
| Building Type | Commercial offices; Data centers; Healthcare; Industrial buildings; Campuses and public buildings |
| Data Source | BMS and HVAC telemetry; IoT sensors; Utility and meter data; CMMS and work orders; Weather and external data |
| Analytics Layer | Predictive ML; Rules + statistical models; Digital twin simulation; Optimization and prescriptive; Generative assistant and copilot |
| Regions Covered | North America; Latin America; Western Europe; Eastern Europe; East Asia; South Asia & Pacific; Middle East & Africa |
| Countries Covered | USA; Germany; UK; Singapore; France |
| Key Companies | Schneider Electric; Siemens; Honeywell; Johnson Controls; BrainBox AI (a Trane Technologies company); Autodesk |
| Forecast Period | 2026 to 2036 |
| Approach | Sizing combines active building and portfolio subscriptions, analytic module attachment, license value, implementation components and service-linked platform revenue. Forecasts test automation rules, energy prices, retrofit rates, telemetry readiness, predictive maintenance adoption and digital-twin penetration by building type. |
How is the market segmented?
-
By Platform Function
- Energy and load forecasting
- Predictive maintenance
- Occupancy and space forecasting
- Asset lifecycle planning
- Climate and resilience modeling
-
By Building Type
- Commercial offices
- Data centers
- Healthcare
- Industrial buildings
- Campuses and public buildings
-
By Data Source
- BMS and HVAC telemetry
- IoT sensors
- Utility and meter data
- CMMS and work orders
- Weather and external data
-
By Analytics Layer
- Predictive ML
- Rules + statistical models
- Digital twin simulation
- Optimization and prescriptive
- Generative assistant and copilot
-
By Region
- North America
- Latin America
- Western Europe
- Eastern Europe
- East Asia
- South Asia & Pacific
- Middle East & Africa