- Market Value (2025): USD 567.1 Mn
- Estimated Value (2026): USD 600.0 Mn
- Forecast Value (2036): USD 1100.0 Mn
- CAGR (2026-2036): 5.8%
What is the Volt VAR Management Market forecast to be worth by 2036?
USD 600.0 Million in 2026 to USD 1100.0 Million by 2036 at 5.8% CAGR.
- The volt var management market reached USD 567.1 Million in 2025 as utilities continued to review voltage regulation and capacitor control investments.
- Demand is projected to increase from USD 600.0 Million in 2026 to USD 1100.0 Million by 2036.
- The market is forecast to record 5.8% CAGR from 2026 to 2036 owing to feeder modernization and pressure to improve service quality.
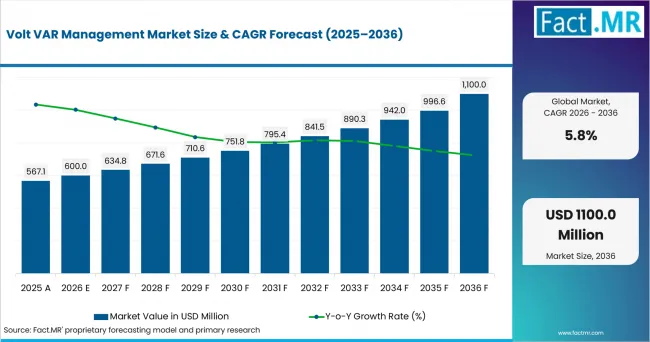
Volt Var Management Market Value Analysis | Source: Fact.MR
What are the defining numbers behind Volt VAR Management Market growth?
USD 0.5 billion absolute opportunity by 2036.
- Demand Drivers in the Market
- Distribution utilities require voltage control packages that coordinate regulators and capacitor banks across feeders.
- Hardware keeps the first approval position because utilities need proven field devices before software optimization earns budget support.
- Distribution applications gain preference where feeder load changes require faster switching and voltage visibility.
- Key Segments Analyzed
- By Product Type: Hardware is projected to hold 37.9% share in 2026 because regulators and capacitor banks remain the first visible investment layer.
- By Application: Distribution is expected to account for 41.3% share in 2026. Feeder-level voltage management is easier to approve than broad transmission upgrades.
- By End User: Investor-Owned Utilities is anticipated to capture 33.4% share in 2026 because larger regulated utilities have clearer program budgets and asset records.
- By Distribution Channel: Direct Sales is estimated to represent 31.4% share in 2026 since utilities often need direct engineering support before selection.
- By Deployment Level: Distribution Network is forecast to hold 45.1% share in 2026 because medium-voltage feeders create the clearest need for voltage correction.
- Analyst Opinion at Fact.MR
- Shambhu Nath Jha, Principal Consultant at Fact.MR, states, “Volt VAR management suppliers must show how field hardware and control software reduce voltage excursions without adding operating complexity. Utility customers are expected to favor feeder pilot evidence and service response over catalog breadth.”
- Strategic Implications
- Utility planners should separate equipment replacement from full optimization programs before approving budgets.
- Technology providers need to connect voltage data and field control actions in one operating story.
- Investors should compare hardware-led revenue with software and service follow-on demand.
South Korea is expected to record 4.6% CAGR from 2026 to 2036. USA is projected to record 7.5% CAGR. Canada is anticipated to grow at 5.3% through service coverage needs. Germany is estimated to post 6.4% CAGR through power quality review. Australia is forecast at 4.1% due to dispersed feeder needs. Japan is projected to reach 7.0% through reliability-focused upgrades. UK is expected to reach 5.8% through measured replacement and control-system review.
How does the Volt VAR Management Market break down by segment?
Hardware is expected to lead Product Type at 37.9% share in 2026. Distribution is projected to lead Application at 41.3% share in 2026.
Which product type dominates?
Hardware is projected to account for 37.9% share in 2026.
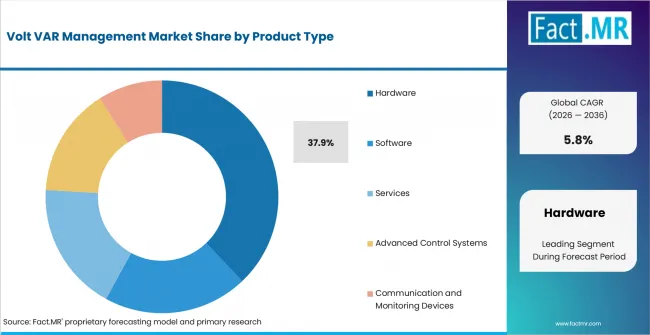
Volt Var Management Market Analysis By Product Type | Source: Fact.MR
Hardware leads because utilities still need regulators and capacitor banks before automated optimization is trusted. Software and services retain demand where field devices are already installed. Control systems become more valuable when feeders require tighter coordination.
What leads the Application segment?
Distribution is expected to hold 41.3% share in 2026.
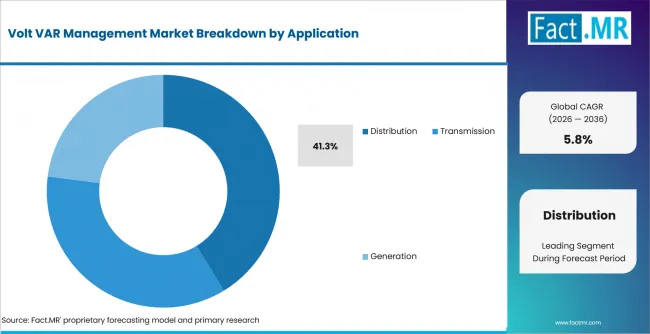
Volt Var Management Market Analysis By Application | Source: Fact.MR
Distribution holds the largest use case because feeder voltage changes with load and switching conditions. Distribution substations create repeat control points for voltage and reactive power. Transmission and generation applications remain selective because planning cycles are longer.
How does End User shape demand?
Investor-Owned Utilities are anticipated to lead with 33.4% share in 2026.
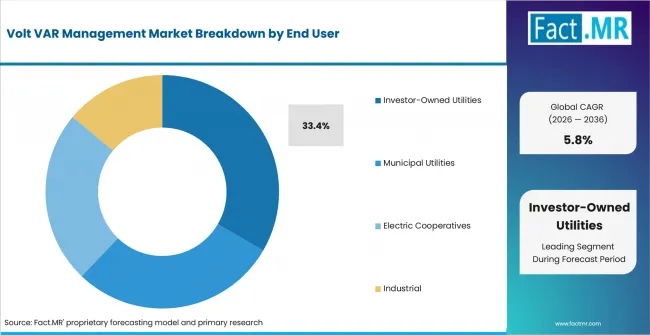
Volt Var Management Market Analysis By End User | Source: Fact.MR
Investor-owned utilities usually have larger capital programs and clearer documentation processes for grid modernization. Municipal utilities still purchase equipment where service quality requirements are defined. Industrial users add demand when voltage quality affects plant operations.
What supports Direct Sales within Distribution Channel?
Direct Sales is estimated to represent 31.4% share in 2026.
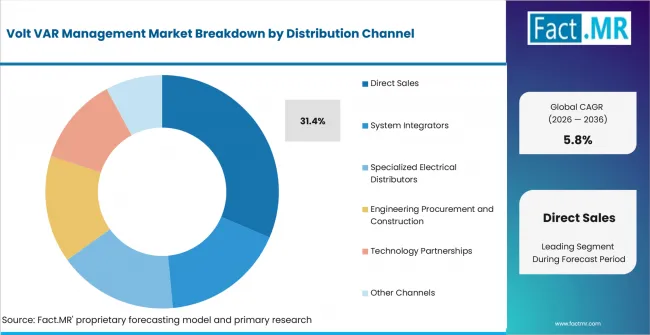
Volt Var Management Market Analysis By Distribution Channel | Source: Fact.MR
Direct Sales leads because utility projects require engineering review before procurement. System integrators remain relevant when ADMS or SCADA platforms must be coordinated. Electrical distributors support smaller projects where standard packages are easier to specify.
Why does Distribution Network lead Deployment Level?
Distribution Network is forecast to hold 45.1% share in 2026.
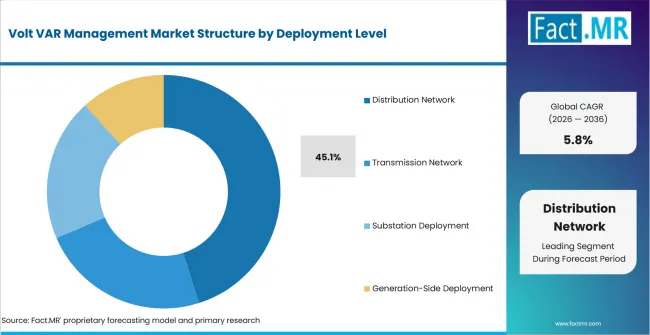
Volt Var Management Market Analysis By Deployment Level | Source: Fact.MR
Distribution network deployment fits volt var management because voltage correction is most visible on medium-voltage and low-voltage feeders. Substation deployment supports wider control. Transmission and generation-side deployment stay smaller because review follows different operating rules.
What is accelerating Volt VAR Management Market adoption, and what is holding it back?
Demand is expected to rise through feeder-voltage control and equipment replacement. Growth may be limited by project engineering and budget approvals.
Drivers Impact Analysis
| DRIVER | (~) % IMPACT ON CAGR | GEOGRAPHIC RELEVANCE | IMPACT TIMELINE |
|---|---|---|---|
| Feeder voltage control requirements | +1.6% | South Korea, USA | Short term (<= 2 years) |
| Hardware replacement and controller upgrades | +1.4% | South Korea, Canada | Short term (<= 2 years) |
| Distribution automation integration | +1.1% | USA, Germany | Medium term (2-4 years) |
| Utility service-quality review | +0.8% | Australia; Japan; UK | Medium term (2-4 years) |
| DER and reverse power-flow management | +0.6% | Selected distribution grids | Long term (>= 4 years) |
Source: Fact.MR analysis. Updated Aug 3, 2026
- Feeder voltage control requirements: Utilities are expected to value systems that coordinate regulators before voltage issues reach customers.
- Hardware replacement and controller upgrades: Aging field devices are expected to create a practical route for adding more precise voltage control.
- Distribution automation integration: Volt VAR management earns approval value when it works with SCADA and feeder switching tools.
Opportunity Impact Analysis
| OPPORTUNITY | (~) % IMPACT ON CAGR | GEOGRAPHIC RELEVANCE | IMPACT TIMELINE |
|---|---|---|---|
| Hardware-software retrofit packages | +1.1% | South Korea and USA | Medium term (2-4 years) |
| ADMS control modules | +0.9% | USA and Germany | Medium term (2-4 years) |
| Service contracts and field tuning | +0.7% | Canada and Australia | Long term (>= 4 years) |
| DER-ready voltage management | +0.5% | Japan and UK | Long term (>= 4 years) |
Source: Fact.MR analysis. Updated Aug 3, 2026
- Hardware-software retrofit packages: Providers that package controllers and software are expected to lower approval friction.
- ADMS control modules: Control packages are expected to gain acceptance when operators do not need a separate screen.
- Service contracts and field tuning: Utilities are expected to value tuning because feeder behavior changes after load growth.
Restraints Impact Analysis
| RESTRAINT | (~) % IMPACT ON CAGR | GEOGRAPHIC RELEVANCE | IMPACT TIMELINE |
|---|---|---|---|
| Site-specific engineering burden | -1.0% | Global | Short term (<= 2 years) |
| Capital approval delays | -0.8% | Investor-owned utilities | Short term (<= 2 years) |
| Interoperability and data-quality gaps | -0.6% | Distribution automation projects | Medium term (2-4 years) |
| Service coverage limits | -0.4% | Remote operating territories | Long term (>= 4 years) |
Source: Fact.MR analysis. Updated Aug 3, 2026
- Site-specific engineering burden: Each feeder has different load behavior and regulator settings. This raises study time before approval and slows rollout decisions.
- Capital approval delays: Utility customers often compare volt var projects with protection and reliability priorities inside the same budget cycle.
- Interoperability and data-quality gaps: Control systems are expected to slow when field data is incomplete or device communication is unstable.
Which countries are scaling Volt VAR Management Market fastest?
- South Korea leads through strong domestic engineering and readiness for hardware-based volt-var projects. The USA follows as regulated utility spending supports feeder automation reviews.
- Canada remains slightly above the global rate due to remote voltage-control needs across large territories. Germany grows steadily through selective industrial power-quality demand.
- Australia benefits from dispersed networks and service-response requirements. Japan and the UK expand more slowly as replacement timing, integration proof and local support carry greater weight in purchasing decisions.
The full report provides country-level CAGR analysis across North America; Latin America; Europe; East Asia; South Asia and Oceania; and the Middle East and Africa.
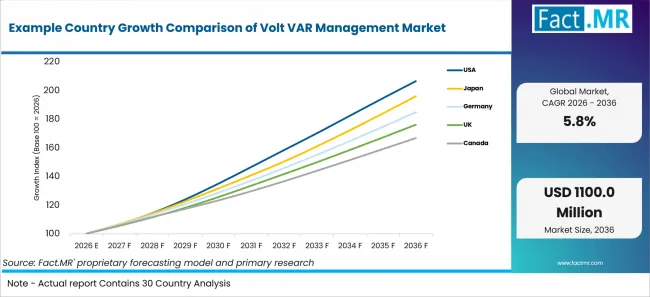
Example Country Growth Comparison Of Volt Var Management Market | Source: Fact.MR
| Country | CAGR (2026-2036) |
|---|---|
| South Korea | 4.6% |
| USA | 7.5% |
| Canada | 5.3% |
| Germany | 6.4% |
| Australia | 4.1% |
| Japan | 5.1% |
| UK | 5.8% |
Source: Fact.MR analysis. Updated Aug 3, 2026
What is shaping South Korea’s outlook through 2036?
4.6% CAGR, supported by grid modernization and domestic equipment capability.
South Korea’s growth reflects strong local engineering support and readiness for hardware-led volt-var projects. Domestic equipment capabilities can shorten technical review and improve coordination during installation. Utilities are likely to favor suppliers that provide clear system integration, field support and performance evidence before moving from pilot projects to wider feeder deployment.
What supports USA adoption?
7.5% CAGR, backed by regulated utility programs and feeder automation review.
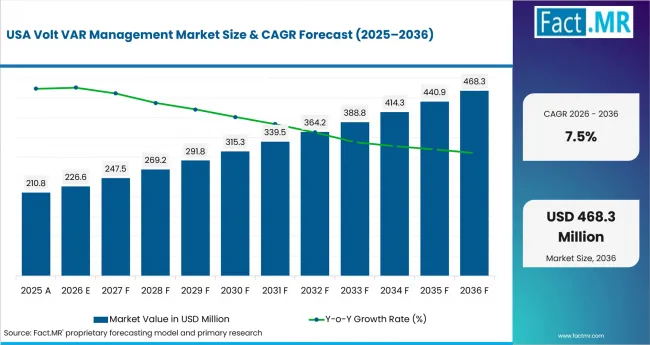
Volt Var Management Market Country Value Analysis | Source: Fact.MR
The USA’s growth is tied to regulated utility spending and planned feeder modernization. Utilities are expected to evaluate compatibility with advanced distribution management systems before approving wider rollout. Procurement is likely to focus on voltage-control performance, integration with existing network systems and evidence that hardware can support long-term feeder automation goals.
How is Canada scaling demand?
5.3% CAGR, driven by service coverage needs across large operating areas.
Canada’s growth is shaped by long feeders and wide utility service territories. Remote voltage control becomes more valuable where field access is costly and response times are longer. Providers that offer dependable communication, remote monitoring and strong regional support are likely to gain preference during grid-upgrade and equipment-replacement programs.
How does Germany perform?
6.4% CAGR, supported by power quality review and distribution-grid control needs.
Germany’s growth reflects evidence-led purchasing and selective investment in distribution-grid control. Industrial power-quality requirements keep technical validation central to approval. Utilities and industrial users are expected to compare voltage regulation, reactive power support and system compatibility before committing to broader deployment. Interest in synchronous condenser systems also supports related planning activity.
What supports Australia’s growth?
4.1% CAGR, backed by dispersed network operations and voltage-management needs.
Australia’s growth is supported by wide service areas and distributed network infrastructure. Utilities need voltage-management systems that can operate reliably across remote locations. Packages that simplify remote control, reduce site visits and provide strong service response are likely to gain attention as operators replace aging hardware and improve feeder performance.
How is Japan developing demand?
7.0% CAGR, led by reliability expectations and compact network upgrades.
Japan’s growth is shaped by careful replacement programs and high reliability standards. Utilities are expected to review equipment quality, integration performance and long-term service support before approving upgrades. Local engineering capability remains important where compact networks require precise installation and dependable operation across existing distribution systems.
What supports UK adoption?
5.8% CAGR, driven by measured replacement and network control review.
The UK’s growth reflects selective equipment replacement rather than rapid network expansion. Utilities are likely to focus on system compatibility, control integration and proven operating performance. Suppliers that demonstrate smooth connection with existing grid-management systems and provide clear maintenance support may improve their position during procurement reviews.
Who leads the Volt VAR Management Market?
Hitachi Energy Ltd. and Siemens AG show direct relevance because their portfolios cover distribution automation and grid control. Schneider Electric SE and Eaton Corporation plc support the software and utility-control side. GE Vernova Inc.; Landis+Gyr Group AG; S&C Electric Company; and Hubbell Incorporated (Beckwith Electric) extend the provider field through voltage regulation and field-device control. Competition is expected to depend on proven feeder performance and service response.
From 2026 to 2036, providers are expected to compete on hardware reliability and control-room integration. Products that work with advanced metering infrastructure can gain review value when meter data improves voltage decisions. Edge-control planning remains close to solid state transformer systems.
Which companies are the key providers?
Key companies include Hitachi Energy Ltd.; Siemens AG; Schneider Electric SE; Eaton Corporation plc; GE Vernova Inc.; Landis+Gyr Group AG; S&C Electric Company; Hubbell Incorporated (Beckwith Electric)
- Hitachi Energy Ltd.
- Siemens AG
- Schneider Electric SE
- Eaton Corporation plc
- GE Vernova Inc.
- Landis+Gyr Group AG
- S&C Electric Company
- Hubbell Incorporated (Beckwith Electric)
Bibliography
- U.S. Department of Energy. (2025, January 13). DOE selects utilities for groundbreaking technical assistance program to advance grid deployment and integration.
- U.S. Energy Information Administration. (2025, December 1). Hurricanes in 2024 led to the most hours without power in the United States in 10 years.
- Hitachi Energy Ltd. (2025, June 17). Hitachi Energy launches Compact Line Voltage Regulator to address the controllability of distribution grids.
- Siemens AG. (2025, June 16). AcegasApsAmga leverages Siemens’ Gridscale X to build digital twin of Trieste’s energy grid.
This Report Answers
- The report provides strategic intelligence across Product Type and Application choices.
- Segment analysis covers Hardware and Distribution as the share leaders within the 2026 market structure.
- Country outlook evaluates South Korea and USA alongside Canada and Germany.
- Competitive analysis profiles Hitachi Energy Ltd.; Siemens AG; Schneider Electric SE; Eaton Corporation plc; GE Vernova Inc.; Landis+Gyr Group AG; S&C Electric Company; and Hubbell Incorporated (Beckwith Electric)
- Deployment assessment covers Distribution Network; Substation Deployment; Transmission Network; and Generation-Side Deployment.
What does the Volt VAR Management Market cover?
Volt VAR management systems are used to manage voltage and reactive power where utility customers need stable feeder performance and clearer operating control.
The Volt VAR Management Market covers hardware; software; controls; and services used across distribution assets. Coverage extends to voltage regulators; capacitor banks; automation controls; grid analytics; communication devices; and field service work.
What is included in the scope?
Volt VAR management systems are used across distribution networks and substations when voltage control is the purpose.
The scope includes Product Type and Application alongside End User. Distribution Channel and Deployment Level complete the framework. Coverage spans hardware; software; services; automated voltage control; monitoring devices; and grid communication devices.
What is excluded from the scope?
Unrelated electrical equipment and broad grid software remain outside the scope of this market. General infrastructure spending is excluded when voltage control is not the purpose.
The scope excludes purchases that do not address voltage regulation; reactive power management; feeder control; or connected grid monitoring. General metering programs are excluded unless they support volt var actions.
How Was the Analysis Built?
The analysis draws on 120+ sources, 35+ company portfolios, 25+ countries, and more than 20 interviews.
- Primary Research: Interviews with manufacturers, retailers, salon operators, and experts examine purchase priorities, adoption, approval requirements, and competitive positioning.
- Desk Research: Desk research covers government statistics, regulatory publications, company filings, trade data, technical studies, industry associations, standards, and public policy.
- Market Sizing and Forecasting: Estimates combine historical performance, demand indicators, pricing, segment shares, company participation, country growth, adoption patterns, and barriers to expansion.
- Data Validation and Update Cycle: Findings are validated against public data, company activity, regulatory changes, product launches, recalls, and adoption shifts.
Segmentation
What is the report's scope and coverage?
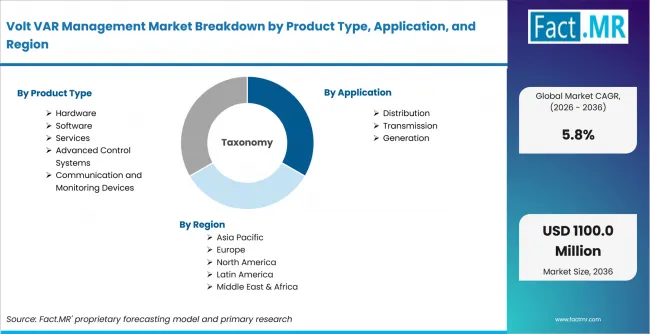
Volt Var Management Market Breakdown By Product Type, Application, And Region | Source: Fact.MR
| Attribute | Details |
|---|---|
| Quantitative Units | USD billion in 2026 to USD billion by 2036 at CAGR |
| Market Definition | Hardware; controls; software; and services used to manage voltage and reactive power across utility distribution and related grid assets |
| Product Type | Hardware; Voltage Regulators; Capacitor Banks; Software; Volt VAR Optimization Software; Grid Analytics and Monitoring Software; Services; Consulting and System Integration; Installation and Maintenance; Advanced Control Systems; Automated Voltage Control; Real-Time Reactive Power Control; Communication and Monitoring Devices; Smart Grid Communication Devices; Remote Monitoring and Control Devices |
| Application | Distribution; Distribution Feeders; Distribution Substations; Transmission; Transmission Networks; Sub-Transmission Networks; Generation; Conventional Power Generation; Renewable Power Generation |
| End User | Investor-Owned Utilities; Regional Electric Utilities; Integrated Investor-Owned Utilities; Municipal Utilities; City-Owned Utilities; Public Power Utilities; Electric Cooperatives; Rural Electric Cooperatives; Member-Owned Distribution Cooperatives; Industrial; Manufacturing Facilities; Industrial Captive Power Networks |
| Distribution Channel | Direct Sales; Direct Utility Contracts; Direct Industrial Contracts; System Integrators; Grid Automation Integrators; Smart Grid Solution Integrators; Specialized Electrical Distributors; Power Equipment Distributors; Electrical Automation Distributors; Engineering Procurement and Construction; Utility EPC Contractors; Power Infrastructure EPC Firms; Technology Partnerships; Smart Grid Technology Partnerships; Grid Software Partnerships; Other Channels; Regional Representatives; Independent Sales Agents |
| Deployment Level | Distribution Network; Medium-Voltage Distribution Networks; Low-Voltage Distribution Networks; Transmission Network; High-Voltage Transmission Networks; Sub-Transmission Networks; Substation Deployment; Distribution Substations; Transmission Substations; Generation-Side Deployment; Conventional Generation Sites; Renewable Generation Sites |
| Regions Covered | North America; Latin America; Europe; East Asia; South Asia and Oceania; Middle East and Africa |
| Countries Covered | South Korea; USA; Canada; Germany; Australia; Japan; UK |
| Key Companies Profiled | Hitachi Energy Ltd.; Siemens AG; Schneider Electric SE; Eaton Corporation plc; GE Vernova Inc.; Landis+Gyr Group AG; S&C Electric Company; Hubbell Incorporated (Beckwith Electric) |
| Forecast Period | 2026 to 2036 |
| Approach | Hybrid top-down and bottom-up approach using demand indicators; segment mix; country growth; approval patterns; replacement needs; automation fit; service depth; and portfolio review |
Source: Fact.MR analysis. Updated Aug 3, 2026
How is the market segmented?
-
By Product Type:
- Hardware
- Software
- Services
- Advanced Control Systems
- Communication and Monitoring Devices
-
By Application:
- Distribution
- Transmission
- Generation
-
By End User:
- Investor-Owned Utilities
- Municipal Utilities
- Electric Cooperatives
- Industrial
-
By Distribution Channel:
- Direct Sales
- System Integrators
- Specialized Electrical Distributors
- Engineering Procurement and Construction
- Technology Partnerships
- Other Channels
-
By Deployment Level:
- Distribution Network
- Transmission Network
- Substation Deployment
- Generation-Side Deployment
-
By Region:
- North America
- Latin America
- Europe
- East Asia
- South Asia and Oceania
- Middle East and Africa
Frequently Asked Questions
Which Product Type leads the market?
Which Application leads the market?
Which End User category leads the market?
Which Distribution Channel leads the market?
Which Deployment Level leads the market?
Which country records the highest listed CAGR?
What is the primary driver in this market?
Who worked on this report


Preview the report firsthand - request a free sample
Free SampleGet the brochure for pricing and purchase details
Download PDF