
Foliar Fertilizers Market Outlook (2025 to 2035)
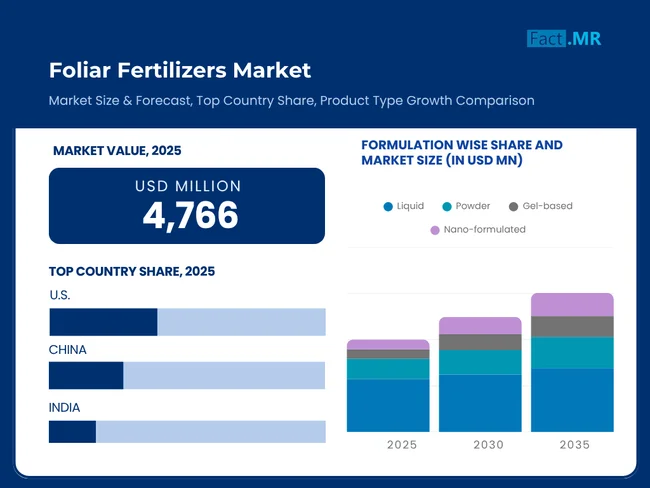
The global foliar fertilizers market is expected to reach USD 8,881 million by 2035, up from USD 4,487 million in 2024. During the forecast period (2025 to 2035), the industry is projected to grow at a CAGR of 6.4%.
The dynamic increase in the foliar fertilizers market can be attributed to the fact that the world has adopted the agenda of promoting green agriculture and increasing yields, driven by the prevailing pressure on food supply. These fertilizers are placed directly on plant leaves, allowing for rapid absorption of nutrients, which helps correct deficiencies that are not well corrected through soil application. The growing integration of precision farming methods stimulates the market as they maximise the delivery of nutrients and reduce wastefulness.
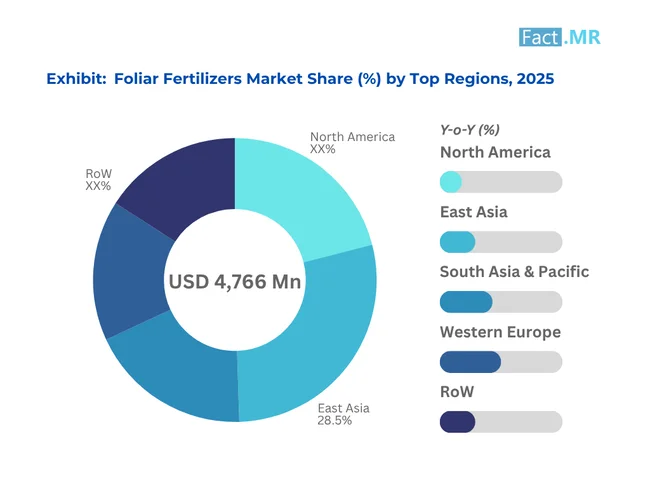
The growing demand for crops with high yields and nutritious fruits, vegetables, and field crops is also driving the increased growth in the market. Innovations such as water-soluble products and slow-release fertilizers help improve the efficiency of applications, leading modern farmers to prefer foliar fertilizers. The Asia-Pacific region is ahead, largely due to its extensive agricultural foundation, whereas high-value segments of crops are growing in North America and Europe.
Environmental issues and the necessity to educate farmers on the correct methods of applying them also affect market dynamics. Players are targeting product innovation and strategic partnerships to meet the diverse crop requirements. With the growth of global populations and the decline of arable land, foliar fertilizers have become a crucial pillar in maintaining food security, aligning with the sustainable agriculture approach in the agricultural sector, which is evolving towards utilizing limited resources for high-quality production.
What are the drivers of the Foliar Fertilizers Market?
Precision agriculture has been a major contributor to the intensification of foliar fertilization, and the leading countries in the production of this fertilizer include China. Nutrient-specific application technologies, such as drones and soil sensors, can minimize waste and increase crop yields.
Farmers are also able to optimize their production of wheat and bring nutrients to the plant via leaf sprays powered by the IoT and AI in the province of Shandong, China. This knowledge brings into focus the dynamic of the relationship between technology and the farming sector, where precision tools have come to the rescue of both workforce issues and environmental concerns. China's investment in smart farming infrastructure has made it a leader, with India and the U.S. following suit to acquire similar solutions in rice and apple agriculture, respectively.
What are the regional trends of the Foliar Fertilizers Market?
Rice and wheat are field crops with the highest share of foliar fertilizer application, particularly in India and China. Foliar sprays can also increase wheat production in India, where zinc deficiency is a problem in Punjab. This awareness aligns with the significance of staple crops in global farming and the high volumes of cultivation that result from demand.
China and India, with their focus on rice and cereals, respectively, also demonstrate their market advantages, with the U.S. targeting corn. The quick application of foliar fertilizers makes them highly suitable for large-scale agricultural practices, as the crops will be more secure. The population drives food demand, which presents growth opportunities for the segment and requires effective means of fertilization.
An opportunity that companies will recognize is the development of cost-effective foliar solutions ideally suited for field crops, which will enhance market share in strategic regions.
What are the challenges and restraining factors of the Foliar Fertilizers Market?
Tight control, particularly in the U.S. and Europe, is fueling creativity in the formulation of foliar fertilizers. In the U.S, they produce low residue sprays on apples to measure up to the standards, which are set by the EPA, making them environmental safe. The role of regulatory systems in product development and regulation has encouraged environmentally friendly product development.
China has fewer restrictions, allowing it to produce quickly, while India maintains a balance between cost and compliance. The regulations require firms to invest in research and development, resulting in the creation of water-soluble and organic fertilizers that are less harmful to the environment. The trend helps to contribute to achieving global environmental objectives through sustainable agriculture. These stakeholders must navigate diverse regulatory environments to gain market access, particularly in high-value regions, by adopting compliant and innovative products.
Country-Wise Insights
Precision Nutrition Takes Root in China’s Foliar Fertilizer Surge
-2025-to-2035.webp)
The increased market for foliar fertilizer in China is driven by intensive agriculture, stringent agricultural standards, and demand for sustainable agriculture. Government zero growth of fertilizer use policy fosters the efficient use of nutrients and foliar sprays is an appealing alternative to high volume feeding.
Foliar fertilizer has been receiving growing applications on rice, corn, fruits, and vegetables largely in their deficiency of micronutrients. The market is turning to drone-based spraying systems, nano-chelated nutrients and formulation specific to crops. The Agro-Tech platforms are also assisting farmers to optimize on the timing and dosage of such products.
Local players are bolstering their portfolios with bio-based and slow-release foliar solutions that complement high-value crops. With the massaging of food security with the environmental imperatives, foliar fertilizers are making their presence felt steadily in China.
United States Innovating High-Value Crop Nutrition
U.S. foliar fertilizers market stands on the edge of the technology and attention to such high value crops as apples and strawberries. Newer higher performance spraying equipment such as drone-based equipment’s can present a higher level of accuracy with regard to nutrient dispensing as witnessed in the Washington apple orchards where foliar sprays of high potassium levels lead to higher quality fruits.
The industry is motivated by consumer demand of high quality products and environmental friendliness, where organic formulations are emerging to deal with increased requirements of environmentally friendly chemical regulations by the EPA. The most advanced turf is done in U.S., where golf courses in Florida feature sprays of micronutrients that keep the land looking green.
The investments in research and development by the firms are directed toward water-soluble fertilizers, and these are compatible with various crops. The precision agriculture is an area stimulated in the country to overcome labor shortage-related issues and environmental problems, which makes it a leader in foliar technology worldwide.
India’s Foliar Fertilizers Boosting Smallholder Crop Yields
Foliar sprays boost government subsidies and the requirements of smallholder farmers, especially in the state of Maharashtra, where pulse crops such as gram, drive the Indian foliar fertilizers market. Demand is concentrated on staple crops such as rice and wheat, and empty fields are filled with the need for nitrogenous sprays to compensate for the nutrient gap. The fertilizers are cheap, water-soluble and favored by the programs aimed at sustainable agriculture. With a huge amount of agricultural land base and a rapidly increasing population, India requires an optimized nutrient delivery system to be able to have food security.
Policy support and cost-effective solutions lead to the growth of the market because it makes the use of foliar fertilizers affordable to resource-limited farmers. Such an understanding highlights the importance of India in the international foliar fertilizers market, and how productivity and price affordability is a top priority in reaching goals of satisfying food needs in the country and promoting sustainable agriculture methods.
Category-Wise Analysis
Field Crops: Powering Global Food Security
The foliar fertilizers market is dominated by the field crops segment, which includes the staples (rice and wheat). The application of nitrogen-based foliar sprays in increase of rice yields in the Jiangsu province of China helps to rectify the nutrient deficiency high-yield cultivation. Such a segment is dependent on the necessity to deliver nutrients in an efficient way in order to achieve the maximum possible productivity on the limited arable land, specifically in the Asian-Pacific region.
The fertilizers being used should be water-soluble and cost effective in order to be affordable to the large-scale farmers. The use of precision agriculture with the application of tools, such as IoT sensors, minimizes application, but the impact on the environment is minimized.
Corporations such as Yara International ASA are coming up with customized mixtures of fertilizer to make crops more resilient as the demand of food rises with the growth of population. The development of this segment is driven by the size and demand, and the foliar fertilizers guarantee staple crops to deliver steady outputs. The understanding underlines the importance of the segment contribution to the agricultural stability to stress that the segment focuses on volume-based, sustainable solutions to food production.
Horticultural Crops: Enhancing Premium Produce Quality
The segment of horticultural crops such as fruits and vegetables is one of the primary factors behind the foliar fertilizers industry as they emphasize the high-quality produce. Potassium-enriched foliar spray extend shelf life of strawberry in high valued markets. The preferred segment is where the quick rate at which nutrients are absorbed is important so that aesthetics and nutrition value get addressed by the crops to fulfill the need of consumers who have demand of fresh nutritious produce.
High-tech formulas, such as micronutrient blends, guarantee bright colors and a long stay on the market, especially in North America. The demand for urban farming and greenhouse crop culture is increasing, and foliar fertilizers are used to apply specifically to vulnerable crops.
This information highlights the importance of the segment in providing high-quality and market-ready produce with a special focus on the value-driven mechanism and its harmony with the interests of the health-oriented consumers.
Competitive Analysis
Key players in the foliar fertilizers industry include Yara International ASA, Haifa Group, ICL Group Ltd., K+S Aktiengesellschaft, Nutrien Ltd., The Mosaic Company, EuroChem Group AG, Coromandel International Ltd., Uralchem Group, Compass Minerals, Valagro S.p.A., AgroLiquid, Helena Agri-Enterprises, LLC, GSFC (Gujarat State Fertilizers & Chemicals Ltd.), Zuari Agro Chemicals Ltd., Compo Expert GmbH, BMS Micro-Nutrients NV, J.R. Simplot Company, Plant Food Company, Inc., AgroBioTek Laboratories, Atlantica Agricola SA, Wilbur-Ellis Company, Brandt Consolidated, Inc., AkzoNobel Specialty Chemicals (now Nouryon), Tradecorp International, Verdesian Life Sciences, Shandong Lvfeng Fertilizer Co., Ltd., Agrium Asia Pacific Ltd., Nippon Soda Co., Ltd. (Fertilizer Division), and Sichuan Shucan Chemical Co., Ltd.
Foliar fertilizers market is very competitive as major and minor players compete at the local and international levels to acquire market share by way of innovating, forming strategic relationships and offering localized solutions. Major competitors such as Yara International ASA, Nutrien Ltd., and Haifa Group have superior formulations and are dealing with various crops; these include water-soluble and organic fertilizers.
Market reach is increased through mergers, acquisition, and network distribution expansion like those of ICL Group, which found partners in Asia-Pacific. Such competitive measures are adding precision agriculture and certification of environmentally friendly products to comply with regulatory conditions.
Recent Development
- In March 2025, Haifa Group launched new water-soluble foliar fertilizers, and targeted at horticultural crops, such as tomatoes. Such combinations enhance nutrient absorption and the quality of yield, and they meet precision agriculture needs.
- In May 2025, Nutrien Ltd. extended its digital farming tools on foliar fertilizers applications. The technology enhances nutrient fertilization of field crops, in this case, wheat, boosts farmlands in Canada.
Fact.MR has provided detailed information about the price points of key manufacturers of Foliar Fertilizers Market positioned across regions, sales growth, production capacity, and speculative technological expansion, in the recently published report.
Methodology and Industry Tracking Approach
The foliar fertilizers market report was developed by Fact.MR in 2025 relies on extensive data collected through the survey of more than 4,300 participants in 20 countries, each with 120 respondents. The totality of samples was comprised of 61 percent end users, e.g., cereal farmers, fruit and vegetable producers, and plantation crop managers, and 39 percent agronomists, soil scientists, procurement leads, and sustainability consultants.
This robust study was conducted over 12 months from June 2024 to May 2025, focusing on crop responsiveness, foliar nutrient solubility, application efficiency under climatic variability, compatibility with pest management programs, and compliance with evolving agricultural standards. A stratified regional sampling model ensured balanced data across both developed and developing agricultural economies.
The study incorporated over 140 validated inputs, such as agronomic trial results, extension program feedback, formulation datasheets, field testing reports, and corporate sustainability disclosures. Advanced predictive models, including ridge regression, probabilistic scenario planning, and adoption sensitivity diagnostics, were employed to maintain data accuracy and identify market inflection points. This makes the report an essential reference for stakeholders seeking yield optimization, innovation, and compliance across the foliar fertilizer landscape.
Segmentation of Foliar Fertilizers Market
-
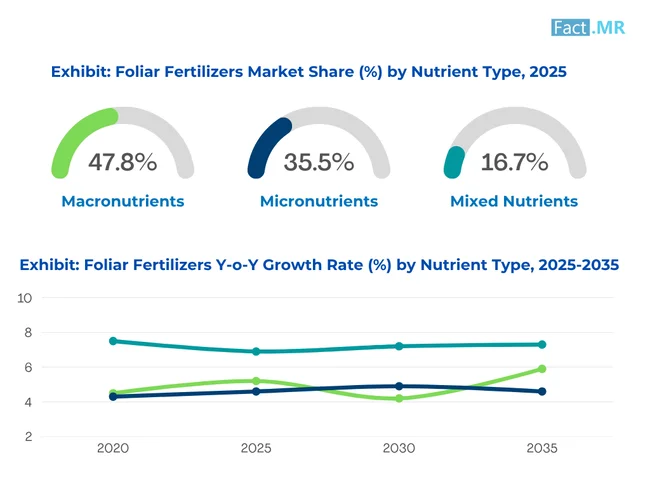
By Nutrient Type :
- Macronutrients (N, P, K, Ca, Mg, S)
- Micronutrients (Zn, Fe, Cu, Mn, B, Mo, Cl)
- Mixed Nutrients (NPK + Micronutrients)
-
By Formulation :
- Liquid
- Powder
- Gel-based
- Nano-formulated
-
By Nature :
- Inorganic (Synthetic)
- Organic
- Bio-based
-
By Crop Type :
- Cereals & Grains
- Fruits & Vegetables
- Oilseeds & Pulses
- Commercial Crops
- Turf & Ornamentals
- Horticultural Crops
- Others (Forestry, Medicinal Plants)
-
By Application Method :
- Manual Spraying
- Mechanical Spraying
- Aerial Spraying
- Electrostatic Spraying
-
By End-User :
- Commercial Agricultural Enterprises
- Smallholder Farmers
- Greenhouse Growers
- Landscapers & Horticulturists
-
By Region :
- North America
- Latin America
- Western Europe
- Eastern Europe
- East Asia
- South Asia & Pacific
- Middle East & Africa
- Frequently Asked Questions -
What was the Global Foliar Fertilizers Market Size Reported by Fact.MR for 2025?
The global Foliar Fertilizers market was valued at USD 4,765.7 million in 2025.
Who are the Major Players Operating in the Foliar Fertilizers Market?
Prominent players in the market are Yara International ASA, Haifa Group, ICL Group Ltd., K+S Aktiengesellschaft among others.
What is the Estimated Valuation of the Foliar Fertilizers Market in 2035?
The market is expected to reach a valuation of USD 8,881 million in 2035.
What Value CAGR did the Foliar Fertilizers Market Exhibit Over the Last Five Years?
The historic growth rate of the Foliar Fertilizers market was 5.9% from 2020 to 2024.

Author:
S.N. Jha

Editor:
Naved Ahmed