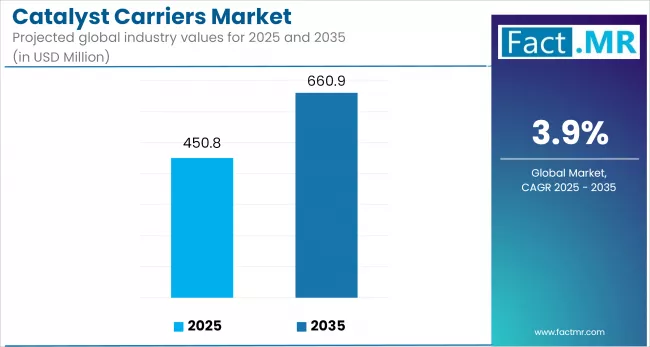
Catalyst Carriers Market

Catalyst Carriers Market Analysis, By Type, By Form, By Surface Area, By Pore Volume, By End-use Industry and Region - Market Insights 2025 to 2035

Analysis of Catalyst Carriers Market Covering 30+ Countries Including Analysis of US, Canada, UK, Germany, France, Nordics, GCC countries, Japan, Korea and many more.

Catalyst Carriers Market Outlook from 2025 to 2035

The global catalyst carriers market is projected to reach USD 660.9 million by 2035, rising from USD 450.8 million in 2025. Over the forecast period, the market is expected to grow at a CAGR of 3.9%.

Catalyst Carriers Market

Growth is driven by increasing demand from the petrochemical and refining industries. Advancements in nanomaterials, 3D printing, and optimized porosity designs are enhancing carrier efficiency and durability. Additional opportunities lie in scaling the production of eco-friendly catalyst carriers. The market is also supported by tightening environmental regulations and rising demand for cleaner processing technologies

Don't Need a Global Report?

save 40%! on Country & Region specific reports

What are the Drivers of the Catalyst Carriers Market?

Global industrial energy efficiency goals and resource optimization efforts are driving demand for catalyst carriers. Industries require advanced catalytic solutions that enhance process efficiency, conserve energy, and reduce carbon emissions. Catalyst carriers enhance catalyst performance, improve chemical reaction efficiency, and optimize energy utilization in industrial systems. In petrochemical and refining operations, even marginal improvements in catalytic efficiency can yield measurable cost savings and environmental benefits.

Growth in the petrochemical sector is a significant driver for the adoption of catalyst carriers. According to the USA Energy Information Administration (EIA), global petrochemical output is projected to increase at a rate of 3.5% annually through 2027.

The rising demand for polymers and chemical intermediates, both of which rely on efficient catalytic systems, is driving this expansion. Catalyst carriers play a key role in enhancing catalyst activity and extending lifespan in refining and chemical manufacturing. Increased investments in petrochemical infrastructure, particularly in the Middle East and Asia-Pacific, underscore the strategic importance of catalyst carriers in meeting sector needs.

Tightening environmental regulations are also boosting demand for catalyst-based fuels, including petrol and diesel. Catalytic converters, widely used in vehicles and industrial facilities, help reduce NOx and SOx emissions. As developed regions enforce stricter air quality standards, demand for efficient catalyst carriers is expected to increase. Cleaner fuel production and emissions control technologies will continue to be central to the market's growth trajectory.

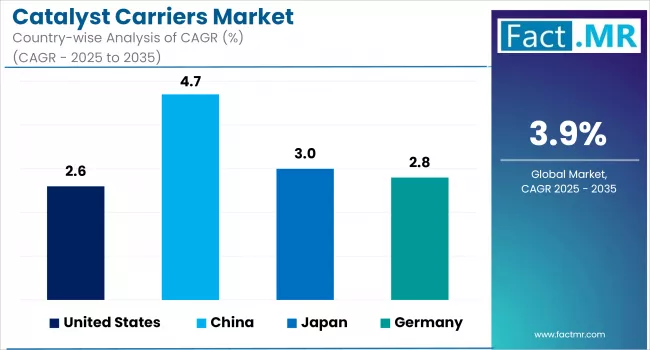
What are the Regional Trends of the Catalyst Carriers Market?

North America's catalyst carriers market remains strong, supported by a well-established refining and petrochemical sector. In the United States, catalyst carriers are in demand for hydroprocessing and catalytic cracking applications. This demand is reinforced by EPA regulations that mandate the use of more efficient and environmentally compliant catalysts.

In Europe, environmental policies such as REACH and the European Green Deal are driving uptake in a mature market. Sustainable manufacturing goals and energy transitions in Germany, the United Kingdom, and France are increasing the need for advanced catalyst carriers in emissions control systems. The automotive and chemical processing sectors generate significant demand across the region.

In the Asia-Pacific region, China, India, Japan, and South Korea lead the growth in catalyst carrier consumption. Industrial expansion, rising petrochemical production, and increasing energy demands are driving demand. Government-led initiatives to reduce pollution and adopt cleaner technologies are accelerating the shift toward advanced catalysts. The region also plays a key role in global supply due to cost-effective manufacturing capabilities.

In the Middle East and Africa, countries such as Saudi Arabia, the UAE, and South Africa are contributing to market growth through their large oil refining and petrochemical bases. Continued investments in downstream processing and industrial diversification, particularly in GCC nations, support long-term demand. While Africa's market remains nascent, it is expanding steadily, driven by industrial development and growing interest in clean energy adoption.

More Insights, Lesser Cost (-50% off)

Insights on import/export production,
pricing analysis, and more – Only @ Fact.MR

What are the Challenges and Restraining Factors of the Catalyst Carriers Market?

The high cost of developing and producing advanced catalyst carrier materials is a major concern. Carrier structures with specific properties often require complex manufacturing processes, specialized equipment, and high-purity raw materials. This cost barrier may hinder smaller manufacturers and price-sensitive applications. Research and development aimed at improving carrier performance and meeting industry demands may increase costs, potentially limiting adoption in certain sectors.

The long lifespan and slow replacement cycle of many industrial catalytic systems limit market growth. Replacement of catalyst carriers and systems can take years. Long lifecycles may limit carrier demand to new installations or major process upgrades, slowing market growth. Durable and regenerable catalyst carriers may reduce end-user market volume growth by extending replacement cycles.

The catalyst carriers market faces raw-material scarcity and concentrated supply chains, especially for rare-earth elements used in high-performance ceramic carriers. In April 2025, China imposed export restrictions and a tracking system for rare-earth magnets, leading to a 75% decline in export volumes and global production delays. High prices, procurement volatility, and increased efforts by manufacturers to secure alternative sources and develop non-rare-earth carrier technologies evolved from this disruption.

Country-Wise Outlook

Catalyst Carriers Market Cagr Analysis By Country

Catalyst Carrier Production in the United States Rises Due to Demand, Innovation, And Local Resources

Catalyst carrier production in North America, particularly in the United States, has increased significantly over the years due to the expansion of production facilities, the establishment of research laboratories, and the ease of sourcing raw materials locally. Governments have increased their spending on chemical synthesis and related processes.

Moreover, the increasing use of chemicals and petrochemicals in the United States is a significant driver of demand for the market. The presence of prominent market players in the United States, combined with timely value-added innovations and advancements, is also driving market growth.

Under the Clean Air Act, the USA EPA restricts emissions from industrial, electricity, and transportation sectors. New refinery and chemical plant NOx and VOC emission regulations in 2024 have raised demand for improved catalyst carriers. Under the Inflation Reduction Act (IRA), incentives encourage the use of cleaner technology and high-efficiency, low-emission catalytic processes that employ specialized carriers.

China Witnesses Rapid Industrial Growth

China's robust industrial base, combined with its leadership in the chemical, petrochemical, and refining sectors, drives demand for catalyst carriers. With over USD 1.9 trillion in chemical output in 2024, the country's increasing emphasis on efficiency and process optimisation in production facilities is accelerating catalyst adoption. The rising demand for clean energy and polymers, along with the expansion of downstream sectors, supports continued market growth.

Rapid industrialisation, large-scale refinery expansions, and China's role as a global manufacturing hub position it as the region's largest consumer of catalyst carriers. Its strong presence in the chemical, oil and gas, and environmental sectors reinforces this status. The Made in China 2025 initiative, which focuses on domestic innovation and high-end manufacturing, including advanced catalyst technologies, is a key market driver.

The Ministry of Ecology and Environment (MEE) is tightening regulations on VOC emissions and waste treatment, prompting industries to adopt more efficient catalysts. Eco-friendly carrier materials and local production of high-value carriers are also gaining momentum. Increasing investments in renewable energy, combined with the country's goal for carbon neutrality by 2060, are creating growth opportunities in green chemistry and pollution control.

Japan's Catalyst Carriers Market Thrives on Technology and Sustainability

Japan's catalyst carriers market is defined by precision manufacturing, advanced technology, and regulatory alignment. The automotive and chemical sectors, both of which are significant users of high-performance catalyst carriers, drive much of the demand. Government initiatives, such as the Green Growth Strategy, promote cleaner technologies and fuel-efficient vehicles, thereby increasing the need for innovative catalyst solutions.

Titania- and zeolite-based carriers, widely applied in energy and environmental uses, are being developed domestically. Circular economy approaches, including catalyst regeneration and recycling, are gaining traction. Specialized carriers for clean energy benefit from Japan’s ongoing push toward hydrogen and fuel-cell vehicle technology.

Japan’s commitment to net-zero emissions by 2050, alongside public investment in clean technologies, opens significant opportunities. The country aims to support CO₂ capture pilot plants and reach 200,000 fuel-cell vehicles by 2025. Catalyst carriers are in growing demand for hydrogen production, reforming processes, and CO₂ conversion. Japan’s precision chemical and pharmaceutical sectors, valued at over USD 70 billion, also use ultra-pure, high-surface-area carriers for niche applications.

Know thy Competitors

Competitive landscape highlights only certain players
Complete list available upon request

Category-wise Analysis

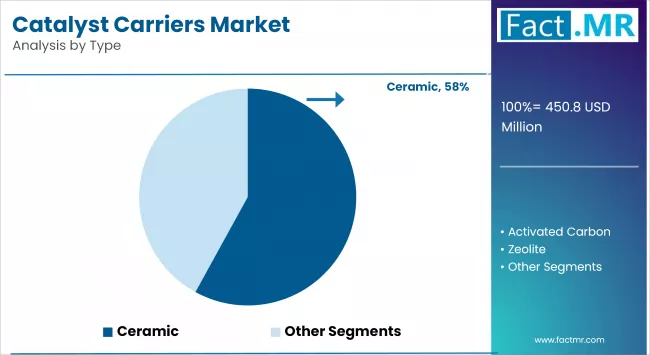
Activated Carbon Emerges as a Competitive Catalyst Carrier Alternative to Ceramics

Ceramics are nonmetallic inorganic solid compounds composed primarily of metals or, in some cases, nonmetals. These compounds become strong and hard through intensive heating in high-temperature applications. Ceramic materials are hard and brittle, offering corrosion resistance across a wide range of uses.

Activated carbon, among other forms of carbon, has become one of the most widely used catalyst carriers. It offers several strategic advantages over alternatives, such as alumina and silica. Key benefits include a significant increase in internal surface area, substantial cost reduction per cubic meter, and suitability for various shapes, particularly in powder, granular, or extruded forms.

Catalyst Carriers Market Analysis By Type

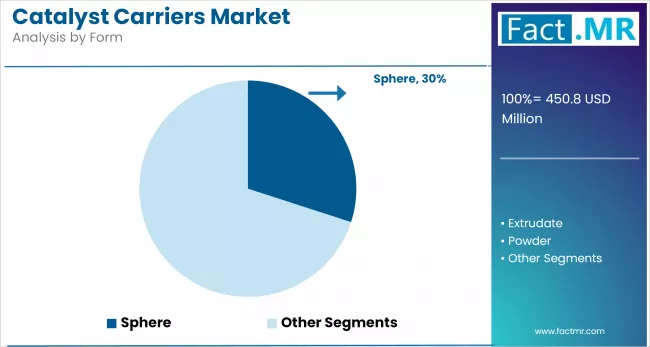
Powder and Spherical Catalyst Carriers Improve Efficiency via Surface Area and Dispersion

Powder catalysts have a higher surface area-to-volume ratio, providing more active sites for chemical reactions. This enhances their catalytic efficiency compared to other forms, such as pellets or granules, and makes them more effective at accelerating processes. Powders are easily combined with reactants to ensure uniform dispersion of the catalyst in the reaction mixture. Catalytic activity must be consistent; this consistency is essential. They are suitable for a wide range of industrial applications because they dissolve easily in various solvents and substrates.

Spherical-shaped carriers are porous catalyst carriers used across a wide range of catalyst support applications. These carriers stand out due to their structural advantages in catalysis. Their spherical form features surface-engraved pores, offering a large surface area for catalyst distribution and accelerating the reaction rate.

Catalyst Carriers Market Analysis By Form

High Surface Area Leads the Market, While Intermediate Segment Grows Fastest

The high surface area segment takes over the catalyst carriers market due to its superior performance in complex catalytic reactions. Refining, petrochemicals, and emission control require these carriers due to their high porosity and surface reactivity. Activated alumina, silica, and zeolites are the primary materials in this segment. Their ability to improve catalyst dispersion and lifespan has driven demand in high-efficiency industrial processes. Environmental regulations and the shift to clean fuels boost this segment's global dominance.

The intermediate surface area segment is growing fastest due to its balanced performance and low cost. It is increasingly used in specialty chemicals, gas purification, and moderate-temperature processes where high surface area is not needed. Advancements in water treatment, renewable energy adoption, and carrier material design are driving growth. The industry values this segment for its affordability, mechanical strength, and catalytic activity, particularly in developing regions.

Catalyst Carriers Enable Effective Diffusion and Stability in Reactions

Catalyst carriers have a bulk pore volume of 0.3-0.7 cm³/g, striking a balance between surface area and accessibility. The moderate porosity allows reactant diffusion and stability under high pressure, making it ideal for catalytic hydrocracking, desulfurization, and chemical synthesis. The consistency of this segment’s gas- and liquid-phase reactions is valued by the industry. Because it works with alumina, silica, and clay-based carriers, it is reliable across multiple end-use sectors.

The rising demand for advanced catalysts in high-mass transport applications, such as environmental remediation and biofuel production, drives the fastest growth in the segment, with a mass transport rate exceeding 0.7 cm³/g. Heavy hydrocarbons and complex organics can be processed with these carriers because bulky molecules pass through more easily. In fuel processing and emission control, demand is rising for clean energy technologies. Global R&D favors their high porosity for catalyst longevity and thermal resistance.

Oil and Gas Dominate Catalyst Carrier Market for Refining Processes

The oil and gas industry controls the catalyst carrier market due to its heavy use of catalytic refining and petrochemical production. Oil and gas companies, among the world's most critical industries, utilize catalyst carriers to enhance hydrocracking, catalytic reforming, and hydrotreating processes. These steps are essential for converting crude oil into petrol, diesel, and other petrochemical products. Advances in catalytic technologies are being driven by global energy demand and rising fuel quality standards.

Petrochemical products are utilized in various industries, including electronics, automotive, construction, packaging, and textiles, thereby increasing global consumption. To meet this demand, petrochemical production facilities have expanded, leading to increased catalyst usage. Due to environmental regulations and efficiency targets, the industry is adopting eco-friendly and effective catalytic processes.

Competitive Analysis

The global catalyst carriers market is moderately consolidated and highly competitive, driven by rising demand from industries such as oil and gas, petrochemicals, the automotive sector, and environmental applications. Almatis, Evonik Industries, BASF, Cabot Corporation, Magma Catalysts, Noritake Co., Ltd., CeramTec, CoorsTek, Sasol, W.R. Grace, and other players dominate the market due to their diverse product portfolios and global reach.

These companies compete based on material innovation (for instance, high-purity alumina, silica, activated carbon, and zirconia), carrier shapes (such as spheres, extrudates, and honeycombs), and application-specific performance (including thermal stability, surface area, and mechanical strength). BASF and Evonik Industries are market leaders in integrated catalyst systems and R&D-driven solutions, while Almatis and Noritake Co. dominate the structured ceramics and automotive carrier segments.

Companies are also focusing on backward integration and local production to reduce supply chain risks and increase profit margins. However, the market faces challenges such as raw material price volatility (particularly for rare earths and alumina), stringent regulatory standards, and high capital costs, which create entry barriers for new players.

Recent Development

  • In February 2024, BASF SE introduced a new high-performance alumina catalyst carrier for the hydrogen production industry. This new carrier has improved thermal stability and mechanical strength, making it suitable for harsh operating conditions.
  • In April 2024, Clariant, a specialty chemical manufacturer that prioritizes sustainability, announced the release of CATOFIN 312, its most recent catalyst for propane dehydrogenation. The new catalyst lasts 20% longer and is more selective in its application.

Segmentation of the Catalyst Carriers Market

  • By Type :

    • Ceramic
      • Alumina
      • Titania
      • Magnesia
      • Silicon Carbide
      • Silica
      • Others
    • Activated Carbon
    • Zeolite
    • Others
  • By Form :

    • Sphere
    • Extrudate
    • Powder
    • Honeycomb
    • Others
  • By Surface Area :

    • Low (0-10 m2/g)
    • Intermediate (10 - 120 m2/g)
    • High (>120 m2/g)
  • By Pore Volume :

    • 0-0.3 cm3/g
    • 0.3-0.7 cm3/g
    • >0.7 cm3/g
  • By End-use Industry :

    • Chemicals
    • Petrochemicals
    • Oil & Gas
    • Automotive
    • Pharmaceuticals
    • Agrochemicals
    • Others
  • By Region :

    • North America
    • Latin America
    • Western Europe
    • Eastern Europe
    • East Asia
    • South Asia & Pacific
    • Middle East & Africa

Table of Content

  1. Executive Summary
    • Global Market Outlook
    • Demand-side Trends
    • Supply-side Trends
    • Technology Roadmap Analysis
    • Analysis and Recommendations
  2. Market Overview
    • Market Coverage / Taxonomy
    • Market Definition / Scope / Limitations
  3. Market Background
    • Market Dynamics
      • Drivers
      • Restraints
      • Opportunity
      • Trends
    • Scenario Forecast
      • Demand in Optimistic Scenario
      • Demand in Likely Scenario
      • Demand in Conservative Scenario
    • Opportunity Map Analysis
    • Product Life Cycle Analysis
    • Supply Chain Analysis
      • Supply Side Participants and their Roles
        • Producers
        • Mid-Level Participants (Traders/ Agents/ Brokers)
        • Wholesalers and Distributors
      • Value Added and Value Created at Node in the Supply Chain
      • List of Raw Material Suppliers
      • List of Existing and Potential Buyers
    • Investment Feasibility Matrix
    • Value Chain Analysis
      • Profit Margin Analysis
      • Wholesalers and Distributors
    • PESTLE and Porter’s Analysis
    • Regulatory Landscape
      • By Key Regions
      • By Key Countries
    • Production and Consumption Statistics
    • Import and Export Statistics
  4. Global Market Analysis 2020 to 2024 and Forecast, 2025 to 2035
    • Historical Market Size Value (US$ Mn) & Volume (Units) Analysis, 2020 to 2024
    • Current and Future Market Size Value (US$ Mn) & Volume (Units) Projections, 2025 to 2035
      • Y-o-Y Growth Trend Analysis
      • Absolute $ Opportunity Analysis
  5. Global Market Pricing Analysis 2020 to 2024 and Forecast 2025 to 2035
  6. Global Market Analysis 2020 to 2024 and Forecast 2025 to 2035, By Type
    • Introduction / Key Findings
    • Historical Market Size Value (US$ Mn) & Volume (Units) Analysis By Type, 2020 to 2024
    • Current and Future Market Size Value (US$ Mn) & Volume (Units) Analysis and Forecast By Type, 2025 to 2035
      • Ceramic
        • Alumina
        • Titania
        • Magnesia
        • Silicon Carbide
        • Silica
        • Others
      • Activated Carbon
      • Zeolite
      • Others
    • Y-o-Y Growth Trend Analysis By Type, 2020 to 2024
    • Absolute $ Opportunity Analysis By Type, 2025 to 2035
  7. Global Market Analysis 2020 to 2024 and Forecast 2025 to 2035, By Form
    • Introduction / Key Findings
    • Historical Market Size Value (US$ Mn) & Volume (Units) Analysis By Form, 2020 to 2024
    • Current and Future Market Size Value (US$ Mn) & Volume (Units) Analysis and Forecast By Form, 2025 to 2035
      • Sphere
      • Extrudate
      • Powder
      • Honeycomb
      • Others
    • Y-o-Y Growth Trend Analysis By Form, 2020 to 2024
    • Absolute $ Opportunity Analysis By Form, 2025 to 2035
  8. Global Market Analysis 2020 to 2024 and Forecast 2025 to 2035, By Surface Area
    • Introduction / Key Findings
    • Historical Market Size Value (US$ Mn) & Volume (Units) Analysis By Surface Area, 2020 to 2024
    • Current and Future Market Size Value (US$ Mn) & Volume (Units) Analysis and Forecast By Surface Area, 2025 to 2035
      • Low (0-10 m²/g)
      • Intermediate (10-120 m²/g)
      • High (>120 m²/g)
    • Y-o-Y Growth Trend Analysis By Surface Area, 2020 to 2024
    • Absolute $ Opportunity Analysis By Surface Area, 2025 to 2035
  9. Global Market Analysis 2020 to 2024 and Forecast 2025 to 2035, By Pore Volume
    • Introduction / Key Findings
    • Historical Market Size Value (US$ Mn) & Volume (Units) Analysis By Pore Volume, 2020 to 2024
    • Current and Future Market Size Value (US$ Mn) & Volume (Units) Analysis and Forecast By Pore Volume, 2025 to 2035
      • 0-0.3 cm³/g
      • 0.3-0.7 cm³/g
      • >0.7 cm³/g
    • Y-o-Y Growth Trend Analysis By Pore Volume, 2020 to 2024
    • Absolute $ Opportunity Analysis By Pore Volume, 2025 to 2035
  10. Global Market Analysis 2020 to 2024 and Forecast 2025 to 2035, By End-use Industry
    • Introduction / Key Findings
    • Historical Market Size Value (US$ Mn) & Volume (Units) Analysis By End-use Industry, 2020 to 2024
    • Current and Future Market Size Value (US$ Mn) & Volume (Units) Analysis and Forecast By End-use Industry, 2025 to 2035
      • Chemicals
      • Petrochemicals
      • Oil & Gas
      • Automotive
      • Pharmaceuticals
      • Agrochemicals
      • Others
    • Y-o-Y Growth Trend Analysis By End-use Industry, 2020 to 2024
    • Absolute $ Opportunity Analysis By End-use Industry, 2025 to 2035
  11. Global Market Analysis 2020 to 2024 and Forecast 2025 to 2035, By Region
    • Introduction
    • Historical Market Size Value (US$ Mn) & Volume (Units) Analysis By Region, 2020 to 2024
    • Current Market Size Value (US$ Mn) & Volume (Units) Analysis and Forecast By Region, 2025 to 2035
      • North America
      • Latin America
      • Europe
      • East Asia
      • South Asia
      • Oceania
      • MEA
    • Market Attractiveness Analysis By Region
  12. North America Market Analysis 2020 to 2024 and Forecast 2025 to 2035, By Country
    • Historical Market Size Value (US$ Mn) & Volume (Units) Trend Analysis By Market Taxonomy, 2020 to 2024
    • Market Size Value (US$ Mn) & Volume (Units) Forecast By Market Taxonomy, 2025 to 2035
      • By Country
        • USA
        • Canada
      • By Type
      • By Form
      • By Surface Area
      • By Pore Volume
      • By End-use Industry
    • Market Attractiveness Analysis
      • By Country
      • By Type
      • By Form
      • By Surface Area
      • By Pore Volume
      • By End-use Industry
    • Key Takeaways
  13. Latin America Market Analysis 2020 to 2024 and Forecast 2025 to 2035, By Country
    • Historical Market Size Value (US$ Mn) & Volume (Units) Trend Analysis By Market Taxonomy, 2020 to 2024
    • Market Size Value (US$ Mn) & Volume (Units) Forecast By Market Taxonomy, 2025 to 2035
      • By Country
        • Brazil
        • Mexico
        • Argentina
        • Chile
        • Peru
        • Rest of Latin America
      • By Type
      • By Form
      • By Surface Area
      • By Pore Volume
      • By End-use Industry
    • Market Attractiveness Analysis
      • By Country
      • By Type
      • By Form
      • By Surface Area
      • By Pore Volume
      • By End-use Industry
    • Key Takeaways
  14. Europe Market Analysis 2020 to 2024 and Forecast 2025 to 2035, By Country
    • Historical Market Size Value (US$ Mn) & Volume (Units) Trend Analysis By Market Taxonomy, 2020 to 2024
    • Market Size Value (US$ Mn) & Volume (Units) Forecast By Market Taxonomy, 2025 to 2035
      • By Country
        • Germany
        • Italy
        • France
        • UK
        • Spain
        • Russia
        • BENELUX
        • Rest of Europe
      • By Type
      • By Form
      • By Surface Area
      • By Pore Volume
      • By End-use Industry
    • Market Attractiveness Analysis
      • By Country
      • By Type
      • By Form
      • By Surface Area
      • By Pore Volume
      • By End-use Industry
    • Key Takeaways
  15. East Asia Market Analysis 2020 to 2024 and Forecast 2025 to 2035, By Country
    • Historical Market Size Value (US$ Mn) & Volume (Units) Trend Analysis By Market Taxonomy, 2020 to 2024
    • Market Size Value (US$ Mn) & Volume (Units) Forecast By Market Taxonomy, 2025 to 2035
      • By Country
        • China
        • Japan
        • South Korea
      • By Type
      • By Form
      • By Surface Area
      • By Pore Volume
      • By End-use Industry
    • Market Attractiveness Analysis
      • By Country
      • By Type
      • By Form
      • By Surface Area
      • By Pore Volume
      • By End-use Industry
    • Key Takeaways
  16. South Asia Market Analysis 2020 to 2024 and Forecast 2025 to 2035, By Country
    • Historical Market Size Value (US$ Mn) & Volume (Units) Trend Analysis By Market Taxonomy, 2020 to 2024
    • Market Size Value (US$ Mn) & Volume (Units) Forecast By Market Taxonomy, 2025 to 2035
      • By Country
        • India
        • Thailand
        • Malaysia
        • Indonesia
        • Rest of South Asia
      • By Type
      • By Form
      • By Surface Area
      • By Pore Volume
      • By End-use Industry
    • Market Attractiveness Analysis
      • By Country
      • By Type
      • By Form
      • By Surface Area
      • By Pore Volume
      • By End-use Industry
    • Key Takeaways
  17. Oceania Market Analysis 2020 to 2024 and Forecast 2025 to 2035, By Country
    • Historical Market Size Value (US$ Mn) & Volume (Units) Trend Analysis By Market Taxonomy, 2020 to 2024
    • Market Size Value (US$ Mn) & Volume (Units) Forecast By Market Taxonomy, 2025 to 2035
      • By Country
        • Australia
        • New Zealand
      • By Type
      • By Form
      • By Surface Area
      • By Pore Volume
      • By End-use Industry
    • Market Attractiveness Analysis
      • By Country
      • By Type
      • By Form
      • By Surface Area
      • By Pore Volume
      • By End-use Industry
    • Key Takeaways
  18. MEA Market Analysis 2020 to 2024 and Forecast 2025 to 2035, By Country
    • Historical Market Size Value (US$ Mn) & Volume (Units) Trend Analysis By Market Taxonomy, 2020 to 2024
    • Market Size Value (US$ Mn) & Volume (Units) Forecast By Market Taxonomy, 2025 to 2035
      • By Country
        • GCC
        • Rest of MEA
      • By Type
      • By Form
      • By Surface Area
      • By Pore Volume
      • By End-use Industry
    • Market Attractiveness Analysis
      • By Country
      • By Type
      • By Form
      • By Surface Area
      • By Pore Volume
      • By End-use Industry
    • Key Takeaways
  19. Key Countries Market Analysis
    • Value (US$ Mn) & Volume (Units)ed States
      • Pricing Analysis
      • Market Share Analysis, 2024
        • By Type
        • By Form
        • By Surface Area
        • By Pore Volume
        • By End-use Industry
    • China
      • Pricing Analysis
      • Market Share Analysis, 2024
        • By Type
        • By Form
        • By Surface Area
        • By Pore Volume
        • By End-use Industry
    • Germany
      • Pricing Analysis
      • Market Share Analysis, 2024
        • By Type
        • By Form
        • By Surface Area
        • By Pore Volume
        • By End-use Industry
    • Japan
      • Pricing Analysis
      • Market Share Analysis, 2024
        • By Type
        • By Form
        • By Surface Area
        • By Pore Volume
        • By End-use Industry
    • India
      • Pricing Analysis
      • Market Share Analysis, 2024
        • By Type
        • By Form
        • By Surface Area
        • By Pore Volume
        • By End-use Industry
  20. Market Structure Analysis
    • Competition Dashboard
    • Competition Benchmarking
    • Market Share Analysis of Top Players
      • By Regional
      • By Type
      • By Form
      • By Surface Area
      • By Pore Volume
      • By End-use Industry
  21. Competition Analysis
    • Competition Deep Dive
      • Almatis
        • Overview
        • Product Portfolio
        • Profitability by Market Segments (Product/Age /Sales Channel/Region)
        • Sales Footprint
        • Strategy Overview
          • Marketing Strategy
          • Product Strategy
          • Channel Strategy
      • Evonik Industries
        • Overview
        • Product Portfolio
        • Profitability by Market Segments (Product/Age /Sales Channel/Region)
        • Sales Footprint
        • Strategy Overview
          • Marketing Strategy
          • Product Strategy
          • Channel Strategy
      • BASF
        • Overview
        • Product Portfolio
        • Profitability by Market Segments (Product/Age /Sales Channel/Region)
        • Sales Footprint
        • Strategy Overview
          • Marketing Strategy
          • Product Strategy
          • Channel Strategy
      • Cabot Corporation
        • Overview
        • Product Portfolio
        • Profitability by Market Segments (Product/Age /Sales Channel/Region)
        • Sales Footprint
        • Strategy Overview
          • Marketing Strategy
          • Product Strategy
          • Channel Strategy
      • Magma Catalysts
        • Overview
        • Product Portfolio
        • Profitability by Market Segments (Product/Age /Sales Channel/Region)
        • Sales Footprint
        • Strategy Overview
          • Marketing Strategy
          • Product Strategy
          • Channel Strategy
      • Noritake Co. Limited
        • Overview
        • Product Portfolio
        • Profitability by Market Segments (Product/Age /Sales Channel/Region)
        • Sales Footprint
        • Strategy Overview
          • Marketing Strategy
          • Product Strategy
          • Channel Strategy
      • CeramTec
        • Overview
        • Product Portfolio
        • Profitability by Market Segments (Product/Age /Sales Channel/Region)
        • Sales Footprint
        • Strategy Overview
          • Marketing Strategy
          • Product Strategy
          • Channel Strategy
      • CoorsTek
        • Overview
        • Product Portfolio
        • Profitability by Market Segments (Product/Age /Sales Channel/Region)
        • Sales Footprint
        • Strategy Overview
          • Marketing Strategy
          • Product Strategy
          • Channel Strategy
      • SASOL
        • Overview
        • Product Portfolio
        • Profitability by Market Segments (Product/Age /Sales Channel/Region)
        • Sales Footprint
        • Strategy Overview
          • Marketing Strategy
          • Product Strategy
          • Channel Strategy
      • W.R. Grace
        • Overview
        • Product Portfolio
        • Profitability by Market Segments (Product/Age /Sales Channel/Region)
        • Sales Footprint
        • Strategy Overview
          • Marketing Strategy
          • Product Strategy
          • Channel Strategy
  22. Assumptions & Acronyms Used
  23. Research Methodology

List Of Table

  • Table 1: Global Market Value (US$ Mn) Forecast by Region, 2020 to 2035
  • Table 2: Global Market Volume (Units) Forecast by Region, 2020 to 2035
  • Table 3: Global Market Value (US$ Mn) Forecast by Type, 2020 to 2035
  • Table 4: Global Market Volume (Units) Forecast by Type, 2020 to 2035
  • Table 5: Global Market Value (US$ Mn) Forecast by Form, 2020 to 2035
  • Table 6: Global Market Volume (Units) Forecast by Form, 2020 to 2035
  • Table 7: Global Market Value (US$ Mn) Forecast by Surface Area, 2020 to 2035
  • Table 8: Global Market Volume (Units) Forecast by Surface Area, 2020 to 2035
  • Table 9: Global Market Value (US$ Mn) Forecast by Pore Volume, 2020 to 2035
  • Table 10: Global Market Volume (Units) Forecast by Pore Volume, 2020 to 2035
  • Table 11: Global Market Value (US$ Mn) Forecast by End-use Industry, 2020 to 2035
  • Table 12: Global Market Volume (Units) Forecast by End-use Industry, 2020 to 2035
  • Table 13: North America Market Value (US$ Mn) Forecast by Country, 2020 to 2035
  • Table 14: North America Market Volume (Units) Forecast by Country, 2020 to 2035
  • Table 15: North America Market Value (US$ Mn) Forecast by Type, 2020 to 2035
  • Table 16: North America Market Volume (Units) Forecast by Type, 2020 to 2035
  • Table 17: North America Market Value (US$ Mn) Forecast by Form, 2020 to 2035
  • Table 18: North America Market Volume (Units) Forecast by Form, 2020 to 2035
  • Table 19: North America Market Value (US$ Mn) Forecast by Surface Area, 2020 to 2035
  • Table 20: North America Market Volume (Units) Forecast by Surface Area, 2020 to 2035
  • Table 21: North America Market Value (US$ Mn) Forecast by Pore Volume, 2020 to 2035
  • Table 22: North America Market Volume (Units) Forecast by Pore Volume, 2020 to 2035
  • Table 23: North America Market Value (US$ Mn) Forecast by End-use Industry, 2020 to 2035
  • Table 24: North America Market Volume (Units) Forecast by End-use Industry, 2020 to 2035
  • Table 25: Latin America Market Value (US$ Mn) Forecast by Country, 2020 to 2035
  • Table 26: Latin America Market Volume (Units) Forecast by Country, 2020 to 2035
  • Table 27: Latin America Market Value (US$ Mn) Forecast by Type, 2020 to 2035
  • Table 28: Latin America Market Volume (Units) Forecast by Type, 2020 to 2035
  • Table 29: Latin America Market Value (US$ Mn) Forecast by Form, 2020 to 2035
  • Table 30: Latin America Market Volume (Units) Forecast by Form, 2020 to 2035
  • Table 31: Latin America Market Value (US$ Mn) Forecast by Surface Area, 2020 to 2035
  • Table 32: Latin America Market Volume (Units) Forecast by Surface Area, 2020 to 2035
  • Table 33: Latin America Market Value (US$ Mn) Forecast by Pore Volume, 2020 to 2035
  • Table 34: Latin America Market Volume (Units) Forecast by Pore Volume, 2020 to 2035
  • Table 35: Latin America Market Value (US$ Mn) Forecast by End-use Industry, 2020 to 2035
  • Table 36: Latin America Market Volume (Units) Forecast by End-use Industry, 2020 to 2035
  • Table 37: Europe Market Value (US$ Mn) Forecast by Country, 2020 to 2035
  • Table 38: Europe Market Volume (Units) Forecast by Country, 2020 to 2035
  • Table 39: Europe Market Value (US$ Mn) Forecast by Type, 2020 to 2035
  • Table 40: Europe Market Volume (Units) Forecast by Type, 2020 to 2035
  • Table 41: Europe Market Value (US$ Mn) Forecast by Form, 2020 to 2035
  • Table 42: Europe Market Volume (Units) Forecast by Form, 2020 to 2035
  • Table 43: Europe Market Value (US$ Mn) Forecast by Surface Area, 2020 to 2035
  • Table 44: Europe Market Volume (Units) Forecast by Surface Area, 2020 to 2035
  • Table 45: Europe Market Value (US$ Mn) Forecast by Pore Volume, 2020 to 2035
  • Table 46: Europe Market Volume (Units) Forecast by Pore Volume, 2020 to 2035
  • Table 47: Europe Market Value (US$ Mn) Forecast by End-use Industry, 2020 to 2035
  • Table 48: Europe Market Volume (Units) Forecast by End-use Industry, 2020 to 2035
  • Table 49: East Asia Market Value (US$ Mn) Forecast by Country, 2020 to 2035
  • Table 50: East Asia Market Volume (Units) Forecast by Country, 2020 to 2035
  • Table 51: East Asia Market Value (US$ Mn) Forecast by Type, 2020 to 2035
  • Table 52: East Asia Market Volume (Units) Forecast by Type, 2020 to 2035
  • Table 53: East Asia Market Value (US$ Mn) Forecast by Form, 2020 to 2035
  • Table 54: East Asia Market Volume (Units) Forecast by Form, 2020 to 2035
  • Table 55: East Asia Market Value (US$ Mn) Forecast by Surface Area, 2020 to 2035
  • Table 56: East Asia Market Volume (Units) Forecast by Surface Area, 2020 to 2035
  • Table 57: East Asia Market Value (US$ Mn) Forecast by Pore Volume, 2020 to 2035
  • Table 58: East Asia Market Volume (Units) Forecast by Pore Volume, 2020 to 2035
  • Table 59: East Asia Market Value (US$ Mn) Forecast by End-use Industry, 2020 to 2035
  • Table 60: East Asia Market Volume (Units) Forecast by End-use Industry, 2020 to 2035
  • Table 61: South Asia Market Value (US$ Mn) Forecast by Country, 2020 to 2035
  • Table 62: South Asia Market Volume (Units) Forecast by Country, 2020 to 2035
  • Table 63: South Asia Market Value (US$ Mn) Forecast by Type, 2020 to 2035
  • Table 64: South Asia Market Volume (Units) Forecast by Type, 2020 to 2035
  • Table 65: South Asia Market Value (US$ Mn) Forecast by Form, 2020 to 2035
  • Table 66: South Asia Market Volume (Units) Forecast by Form, 2020 to 2035
  • Table 67: South Asia Market Value (US$ Mn) Forecast by Surface Area, 2020 to 2035
  • Table 68: South Asia Market Volume (Units) Forecast by Surface Area, 2020 to 2035
  • Table 69: South Asia Market Value (US$ Mn) Forecast by Pore Volume, 2020 to 2035
  • Table 70: South Asia Market Volume (Units) Forecast by Pore Volume, 2020 to 2035
  • Table 71: South Asia Market Value (US$ Mn) Forecast by End-use Industry, 2020 to 2035
  • Table 72: South Asia Market Volume (Units) Forecast by End-use Industry, 2020 to 2035
  • Table 73: Oceania Market Value (US$ Mn) Forecast by Country, 2020 to 2035
  • Table 74: Oceania Market Volume (Units) Forecast by Country, 2020 to 2035
  • Table 75: Oceania Market Value (US$ Mn) Forecast by Type, 2020 to 2035
  • Table 76: Oceania Market Volume (Units) Forecast by Type, 2020 to 2035
  • Table 77: Oceania Market Value (US$ Mn) Forecast by Form, 2020 to 2035
  • Table 78: Oceania Market Volume (Units) Forecast by Form, 2020 to 2035
  • Table 79: Oceania Market Value (US$ Mn) Forecast by Surface Area, 2020 to 2035
  • Table 80: Oceania Market Volume (Units) Forecast by Surface Area, 2020 to 2035
  • Table 81: Oceania Market Value (US$ Mn) Forecast by Pore Volume, 2020 to 2035
  • Table 82: Oceania Market Volume (Units) Forecast by Pore Volume, 2020 to 2035
  • Table 83: Oceania Market Value (US$ Mn) Forecast by End-use Industry, 2020 to 2035
  • Table 84: Oceania Market Volume (Units) Forecast by End-use Industry, 2020 to 2035
  • Table 85: MEA Market Value (US$ Mn) Forecast by Country, 2020 to 2035
  • Table 86: MEA Market Volume (Units) Forecast by Country, 2020 to 2035
  • Table 87: MEA Market Value (US$ Mn) Forecast by Type, 2020 to 2035
  • Table 88: MEA Market Volume (Units) Forecast by Type, 2020 to 2035
  • Table 89: MEA Market Value (US$ Mn) Forecast by Form, 2020 to 2035
  • Table 90: MEA Market Volume (Units) Forecast by Form, 2020 to 2035
  • Table 91: MEA Market Value (US$ Mn) Forecast by Surface Area, 2020 to 2035
  • Table 92: MEA Market Volume (Units) Forecast by Surface Area, 2020 to 2035
  • Table 93: MEA Market Value (US$ Mn) Forecast by Pore Volume, 2020 to 2035
  • Table 94: MEA Market Volume (Units) Forecast by Pore Volume, 2020 to 2035
  • Table 95: MEA Market Value (US$ Mn) Forecast by End-use Industry, 2020 to 2035
  • Table 96: MEA Market Volume (Units) Forecast by End-use Industry, 2020 to 2035

List Of Figures

  • Figure 1: Global Market Volume (Units) Forecast 2020 to 2035
  • Figure 2: Global Market Pricing Analysis
  • Figure 3: Global Market Value (US$ Mn) Forecast 2020 to 2035
  • Figure 4: Global Market Value Share and BPS Analysis by Type, 2025 and 2035
  • Figure 5: Global Market Y-o-Y Growth Comparison by Type, 2025 to 2035
  • Figure 6: Global Market Attractiveness Analysis by Type
  • Figure 7: Global Market Value Share and BPS Analysis by Form, 2025 and 2035
  • Figure 8: Global Market Y-o-Y Growth Comparison by Form, 2025 to 2035
  • Figure 9: Global Market Attractiveness Analysis by Form
  • Figure 10: Global Market Value Share and BPS Analysis by Surface Area, 2025 and 2035
  • Figure 11: Global Market Y-o-Y Growth Comparison by Surface Area, 2025 to 2035
  • Figure 12: Global Market Attractiveness Analysis by Surface Area
  • Figure 13: Global Market Value Share and BPS Analysis by Pore Volume, 2025 and 2035
  • Figure 14: Global Market Y-o-Y Growth Comparison by Pore Volume, 2025 to 2035
  • Figure 15: Global Market Attractiveness Analysis by Pore Volume
  • Figure 16: Global Market Value Share and BPS Analysis by End-use Industry, 2025 and 2035
  • Figure 17: Global Market Y-o-Y Growth Comparison by End-use Industry, 2025 to 2035
  • Figure 18: Global Market Attractiveness Analysis by End-use Industry
  • Figure 19: Global Market Value (US$ Mn) Share and BPS Analysis by Region, 2025 and 2035
  • Figure 20: Global Market Y-o-Y Growth Comparison by Region, 2025 to 2035
  • Figure 21: Global Market Attractiveness Analysis by Region
  • Figure 22: North America Market Incremental $ Opportunity, 2025 to 2035
  • Figure 23: Latin America Market Incremental $ Opportunity, 2025 to 2035
  • Figure 24: Europe Market Incremental $ Opportunity, 2025 to 2035
  • Figure 25: East Asia Market Incremental $ Opportunity, 2025 to 2035
  • Figure 26: South Asia Market Incremental $ Opportunity, 2025 to 2035
  • Figure 27: Oceania Market Incremental $ Opportunity, 2025 to 2035
  • Figure 28: MEA Market Incremental $ Opportunity, 2025 to 2035
  • Figure 29: North America Market Value Share and BPS Analysis by Country, 2025 and 2035
  • Figure 30: North America Market Value Share and BPS Analysis by Type, 2025 and 2035
  • Figure 31: North America Market Y-o-Y Growth Comparison by Type, 2025 to 2035
  • Figure 32: North America Market Attractiveness Analysis by Type
  • Figure 33: North America Market Value Share and BPS Analysis by Form, 2025 and 2035
  • Figure 34: North America Market Y-o-Y Growth Comparison by Form, 2025 to 2035
  • Figure 35: North America Market Attractiveness Analysis by Form
  • Figure 36: North America Market Value Share and BPS Analysis by Surface Area, 2025 and 2035
  • Figure 37: North America Market Y-o-Y Growth Comparison by Surface Area, 2025 to 2035
  • Figure 38: North America Market Attractiveness Analysis by Surface Area
  • Figure 39: North America Market Value Share and BPS Analysis by Pore Volume, 2025 and 2035
  • Figure 40: North America Market Y-o-Y Growth Comparison by Pore Volume, 2025 to 2035
  • Figure 41: North America Market Attractiveness Analysis by Pore Volume
  • Figure 42: North America Market Value Share and BPS Analysis by End-use Industry, 2025 and 2035
  • Figure 43: North America Market Y-o-Y Growth Comparison by End-use Industry, 2025 to 2035
  • Figure 44: North America Market Attractiveness Analysis by End-use Industry
  • Figure 45: Latin America Market Value Share and BPS Analysis by Country, 2025 and 2035
  • Figure 46: Latin America Market Value Share and BPS Analysis by Type, 2025 and 2035
  • Figure 47: Latin America Market Y-o-Y Growth Comparison by Type, 2025 to 2035
  • Figure 48: Latin America Market Attractiveness Analysis by Type
  • Figure 49: Latin America Market Value Share and BPS Analysis by Form, 2025 and 2035
  • Figure 50: Latin America Market Y-o-Y Growth Comparison by Form, 2025 to 2035
  • Figure 51: Latin America Market Attractiveness Analysis by Form
  • Figure 52: Latin America Market Value Share and BPS Analysis by Surface Area, 2025 and 2035
  • Figure 53: Latin America Market Y-o-Y Growth Comparison by Surface Area, 2025 to 2035
  • Figure 54: Latin America Market Attractiveness Analysis by Surface Area
  • Figure 55: Latin America Market Value Share and BPS Analysis by Pore Volume, 2025 and 2035
  • Figure 56: Latin America Market Y-o-Y Growth Comparison by Pore Volume, 2025 to 2035
  • Figure 57: Latin America Market Attractiveness Analysis by Pore Volume
  • Figure 58: Latin America Market Value Share and BPS Analysis by End-use Industry, 2025 and 2035
  • Figure 59: Latin America Market Y-o-Y Growth Comparison by End-use Industry, 2025 to 2035
  • Figure 60: Latin America Market Attractiveness Analysis by End-use Industry
  • Figure 61: Europe Market Value Share and BPS Analysis by Country, 2025 and 2035
  • Figure 62: Europe Market Value Share and BPS Analysis by Type, 2025 and 2035
  • Figure 63: Europe Market Y-o-Y Growth Comparison by Type, 2025 to 2035
  • Figure 64: Europe Market Attractiveness Analysis by Type
  • Figure 65: Europe Market Value Share and BPS Analysis by Form, 2025 and 2035
  • Figure 66: Europe Market Y-o-Y Growth Comparison by Form, 2025 to 2035
  • Figure 67: Europe Market Attractiveness Analysis by Form
  • Figure 68: Europe Market Value Share and BPS Analysis by Surface Area, 2025 and 2035
  • Figure 69: Europe Market Y-o-Y Growth Comparison by Surface Area, 2025 to 2035
  • Figure 70: Europe Market Attractiveness Analysis by Surface Area
  • Figure 71: Europe Market Value Share and BPS Analysis by Pore Volume, 2025 and 2035
  • Figure 72: Europe Market Y-o-Y Growth Comparison by Pore Volume, 2025 to 2035
  • Figure 73: Europe Market Attractiveness Analysis by Pore Volume
  • Figure 74: Europe Market Value Share and BPS Analysis by End-use Industry, 2025 and 2035
  • Figure 75: Europe Market Y-o-Y Growth Comparison by End-use Industry, 2025 to 2035
  • Figure 76: Europe Market Attractiveness Analysis by End-use Industry
  • Figure 77: East Asia Market Value Share and BPS Analysis by Country, 2025 and 2035
  • Figure 78: East Asia Market Value Share and BPS Analysis by Type, 2025 and 2035
  • Figure 79: East Asia Market Y-o-Y Growth Comparison by Type, 2025 to 2035
  • Figure 80: East Asia Market Attractiveness Analysis by Type
  • Figure 81: East Asia Market Value Share and BPS Analysis by Form, 2025 and 2035
  • Figure 82: East Asia Market Y-o-Y Growth Comparison by Form, 2025 to 2035
  • Figure 83: East Asia Market Attractiveness Analysis by Form
  • Figure 84: East Asia Market Value Share and BPS Analysis by Surface Area, 2025 and 2035
  • Figure 85: East Asia Market Y-o-Y Growth Comparison by Surface Area, 2025 to 2035
  • Figure 86: East Asia Market Attractiveness Analysis by Surface Area
  • Figure 87: East Asia Market Value Share and BPS Analysis by Pore Volume, 2025 and 2035
  • Figure 88: East Asia Market Y-o-Y Growth Comparison by Pore Volume, 2025 to 2035
  • Figure 89: East Asia Market Attractiveness Analysis by Pore Volume
  • Figure 90: East Asia Market Value Share and BPS Analysis by End-use Industry, 2025 and 2035
  • Figure 91: East Asia Market Y-o-Y Growth Comparison by End-use Industry, 2025 to 2035
  • Figure 92: East Asia Market Attractiveness Analysis by End-use Industry
  • Figure 93: South Asia Market Value Share and BPS Analysis by Country, 2025 and 2035
  • Figure 94: South Asia Market Value Share and BPS Analysis by Type, 2025 and 2035
  • Figure 95: South Asia Market Y-o-Y Growth Comparison by Type, 2025 to 2035
  • Figure 96: South Asia Market Attractiveness Analysis by Type
  • Figure 97: South Asia Market Value Share and BPS Analysis by Form, 2025 and 2035
  • Figure 98: South Asia Market Y-o-Y Growth Comparison by Form, 2025 to 2035
  • Figure 99: South Asia Market Attractiveness Analysis by Form
  • Figure 100: South Asia Market Value Share and BPS Analysis by Surface Area, 2025 and 2035
  • Figure 101: South Asia Market Y-o-Y Growth Comparison by Surface Area, 2025 to 2035
  • Figure 102: South Asia Market Attractiveness Analysis by Surface Area
  • Figure 103: South Asia Market Value Share and BPS Analysis by Pore Volume, 2025 and 2035
  • Figure 104: South Asia Market Y-o-Y Growth Comparison by Pore Volume, 2025 to 2035
  • Figure 105: South Asia Market Attractiveness Analysis by Pore Volume
  • Figure 106: South Asia Market Value Share and BPS Analysis by End-use Industry, 2025 and 2035
  • Figure 107: South Asia Market Y-o-Y Growth Comparison by End-use Industry, 2025 to 2035
  • Figure 108: South Asia Market Attractiveness Analysis by End-use Industry
  • Figure 109: Oceania Market Value Share and BPS Analysis by Country, 2025 and 2035
  • Figure 110: Oceania Market Value Share and BPS Analysis by Type, 2025 and 2035
  • Figure 111: Oceania Market Y-o-Y Growth Comparison by Type, 2025 to 2035
  • Figure 112: Oceania Market Attractiveness Analysis by Type
  • Figure 113: Oceania Market Value Share and BPS Analysis by Form, 2025 and 2035
  • Figure 114: Oceania Market Y-o-Y Growth Comparison by Form, 2025 to 2035
  • Figure 115: Oceania Market Attractiveness Analysis by Form
  • Figure 116: Oceania Market Value Share and BPS Analysis by Surface Area, 2025 and 2035
  • Figure 117: Oceania Market Y-o-Y Growth Comparison by Surface Area, 2025 to 2035
  • Figure 118: Oceania Market Attractiveness Analysis by Surface Area
  • Figure 119: Oceania Market Value Share and BPS Analysis by Pore Volume, 2025 and 2035
  • Figure 120: Oceania Market Y-o-Y Growth Comparison by Pore Volume, 2025 to 2035
  • Figure 121: Oceania Market Attractiveness Analysis by Pore Volume
  • Figure 122: Oceania Market Value Share and BPS Analysis by End-use Industry, 2025 and 2035
  • Figure 123: Oceania Market Y-o-Y Growth Comparison by End-use Industry, 2025 to 2035
  • Figure 124: Oceania Market Attractiveness Analysis by End-use Industry
  • Figure 125: MEA Market Value Share and BPS Analysis by Country, 2025 and 2035
  • Figure 126: MEA Market Value Share and BPS Analysis by Type, 2025 and 2035
  • Figure 127: MEA Market Y-o-Y Growth Comparison by Type, 2025 to 2035
  • Figure 128: MEA Market Attractiveness Analysis by Type
  • Figure 129: MEA Market Value Share and BPS Analysis by Form, 2025 and 2035
  • Figure 130: MEA Market Y-o-Y Growth Comparison by Form, 2025 to 2035
  • Figure 131: MEA Market Attractiveness Analysis by Form
  • Figure 132: MEA Market Value Share and BPS Analysis by Surface Area, 2025 and 2035
  • Figure 133: MEA Market Y-o-Y Growth Comparison by Surface Area, 2025 to 2035
  • Figure 134: MEA Market Attractiveness Analysis by Surface Area
  • Figure 135: MEA Market Value Share and BPS Analysis by Pore Volume, 2025 and 2035
  • Figure 136: MEA Market Y-o-Y Growth Comparison by Pore Volume, 2025 to 2035
  • Figure 137: MEA Market Attractiveness Analysis by Pore Volume
  • Figure 138: MEA Market Value Share and BPS Analysis by End-use Industry, 2025 and 2035
  • Figure 139: MEA Market Y-o-Y Growth Comparison by End-use Industry, 2025 to 2035
  • Figure 140: MEA Market Attractiveness Analysis by End-use Industry
  • Figure 141: Global Market - Tier Structure Analysis
  • Figure 142: Global Market - Company Share Analysis

- FAQs -

What is the Global Catalyst Carriers Market size in 2025?

The Catalyst Carriers market is valued at USD 450.8 million in 2025.

Who are the Major Players Operating in the Catalyst Carriers Market?

Prominent players in the market include Almatis, Evonik Industries, BASF, Cabot Corporation, and Magma Catalysts.

What is the Estimated Valuation of the Catalyst Carriers Market by 2035?

The market is expected to reach a valuation of USD 660.9 million by 2035.

What Value CAGR did the Catalyst Carriers Market Exhibit over the Last Five Years?

The historic growth rate of the Catalyst Carriers market was 2.5% from 2020 to 2024.

- Also of Interest -

Catalyst Carrier Industry Analysis in Middle East & Africa

Study on Catalyst Carriers in Middle East & Africa by Ceramics, Activated Carbon, and Zeolites for Chemicals, Oil & Gas, Automotive, Pharmaceuticals, and Agrochemicals from 2024 to 2034

Catalyst Carrier Industry Analysis in South Asia & Oceania

Study on Catalyst Carriers in South Asia & Oceania by Ceramics, Activated Carbon, and Zeolites for Chemicals, Oil & Gas, Automotive, Pharmaceuticals, and Agrochemicals from 2024 to 2034

Catalyst Carrier Industry Analysis in East Asia

Study on Catalyst Carriers in East Asia by Ceramics, Activated Carbon, and Zeolites for Chemicals, Petrochemicals, Oil & Gas, Automotive, Pharmaceuticals, and Agrochemicals from 2024 to 2034

Catalyst Carrier Industry Analysis in Latin America

Study on Catalyst Carriers in Latin America by Ceramics, Activated Carbon, and Zeolites for Chemicals, Petrochemicals, Oil & Gas, Automotive, Pharmaceuticals, and Agrochemicals from 2024 to 2034

Catalyst Carriers Market

Schedule a Call