- Market Value (2025): USD 1.7 Bn
- Estimated Value (2026): USD 1.8 Bn
- Forecast Value (2036): USD 4.0 Bn
- CAGR (2026-2036): 8.3%
What is the Landfill Gas Market forecast to be worth by 2036?
USD 1.8 billion in 2026 to USD 4.0 billion by 2036 at 8.3% CAGR.
- The landfill gas market reached USD 1.7 billion in 2025 as landfill owners upgraded wells and power assets.
- Demand is projected to increase from USD 1.8 billion in 2026 to USD 4.0 billion by 2036.
- The market is forecast to record 8.3% CAGR from 2026 to 2036 as operators convert methane into electricity and pipeline-quality gas.
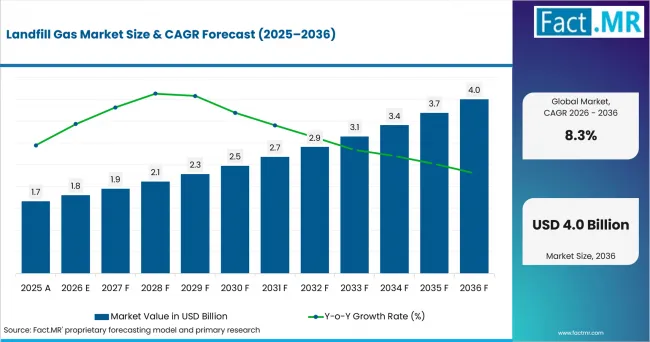
Landfill Gas Market Value Analysis | Source: Fact.MR
What are the defining numbers behind Landfill Gas Market growth?
USD 2.2 billion absolute opportunity by 2036, led by Landfill Gas Collection Systems, Electricity Generation and Municipal Landfill Operators.
- Demand Drivers in the Market
- Municipal landfill operators need gas collection systems for methane control and post-closure compliance. EPA defines the Subpart HH source category as MSW landfills that accepted waste on or after January 1, 1980 and generate methane in amounts equivalent to 25,000 metric tons of CO2e or more per year.
- Utilities value landfill gas where engines already connect to local grids.
- RNG developers need gas cleaning so landfill methane meets fuel specifications.
- Environmental service providers use monitoring systems to document wellfield performance. UNEP announced on May 4, 2026 that MARS expanded methane alerts to the waste sector. UNEP’s MARS page states that the system uses data from more than 30 satellite instruments.
- Key Segments Analyzed
- By Product: Landfill Gas Collection Systems are expected to hold 52.80% share in 2026 due to methane capture needs.
- By Application: Electricity Generation is projected to account for 67.40% share in 2026 owing to the engine base.
- By End Use: Municipal Landfill Operators are anticipated to capture 61.70% share in 2026 as public sites control gas assets.
- By Technology: Gas Collection Technology is estimated to represent 43.50% share in 2026 due to wellfield needs.
- By Formulation: Integrated Recovery Systems are forecast to hold 74.10% share in 2026 due to bundled project design.
- By Distribution Channel: Direct Project Sales are projected to account for 36.20% share in 2026 as contracts are site-specific.
- Analyst Opinion at Fact.MR
- Shambhu Nath Jha, Principal Consultant at Fact.MR, states, “Landfill gas projects are judged first by gas volume and offtake certainty. Procurement is expected to favor suppliers that prove cleanup performance and operating service depth. Better bids combine wellfield balancing, gas treatment, power or RNG expertise, and compliance reporting.”
- Strategic Implications
- Landfill owners should test methane flow before choosing electricity or RNG routes.
- Project developers should secure offtake terms before financing.
- Equipment providers should pair extraction, condensate control, and monitoring.
- Investors should separate legacy power assets from newer RNG projects.
Germany is expected to record 9.6% CAGR through 2036. Brazil follows at 8.7%, the USA at 7.9%, the UK at 7.1%, and Japan at 6.2%.
How does the Landfill Gas Market break down by segment?
Landfill Gas Collection Systems lead Product at 52.80%; Electricity Generation leads Application at 67.40%.
Which product dominates?
Landfill Gas Collection Systems are expected to hold 52.8% share in 2026.
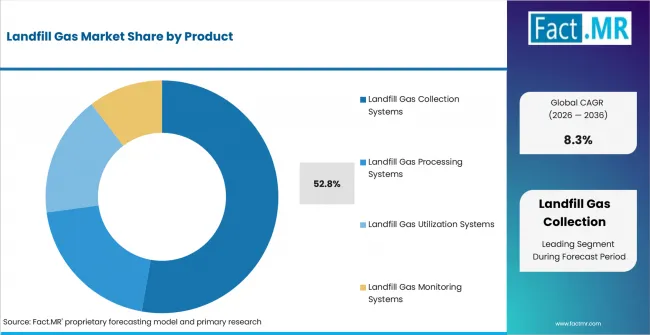
Landfill Gas Market Analysis By Product | Source: Fact.MR
Landfill Gas Collection Systems are expected to lead Product because every energy or compliance route starts with reliable methane capture. Active systems support larger sites, while passive systems fit smaller or older assets.
What leads the Application segment?
Electricity Generation is projected to lead with 67.4% share in 2026.
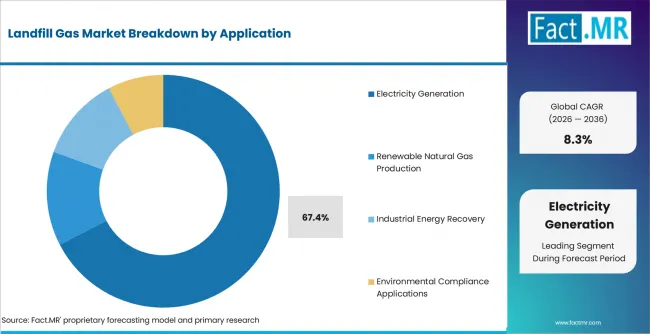
Landfill Gas Market Analysis By Application | Source: Fact.MR
Electricity Generation is projected to lead Application owing to the installed base of engines, turbines, and utility export links. RNG production rises where pipeline access and fuel credits improve economics. EIA’s July 23, 2026 Electric Power Monthly reports preliminary 2025 landfill-gas consumption of 171,520 million cubic feet for electricity generation and 175,262 million cubic feet for electricity generation plus useful thermal output across all sectors.
How does End Use shape demand?
Municipal Landfill Operators are anticipated to lead with 61.7% share in 2026.
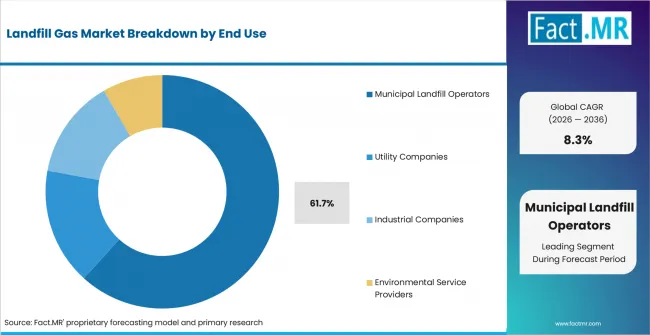
Landfill Gas Market Analysis By End Use | Source: Fact.MR
Municipal Landfill Operators are anticipated to lead End Use as public disposal assets carry long-term gas control duties. Private operators focus on monetizing large sites. Utilities and industrial users buy gas or power when offtake terms are clear.
What supports Technology demand?
Gas Collection Technology is estimated to represent 43.5% share in 2026.
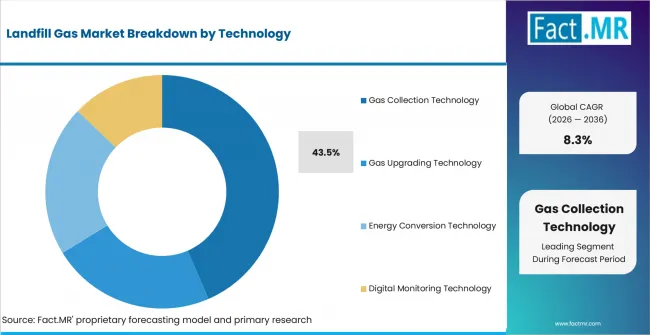
Landfill Gas Market Analysis By Technology | Source: Fact.MR
Gas Collection Technology is estimated to lead Technology due to the wellfields, vacuum extraction systems, and controls needed before processing begins. Upgrading systems expand when projects target RNG. Digital monitoring gains budget where leak detection and wellfield balance affect permits.
What leads the Formulation segment?
Integrated Recovery Systems are forecast to hold 74.1% share in 2026.
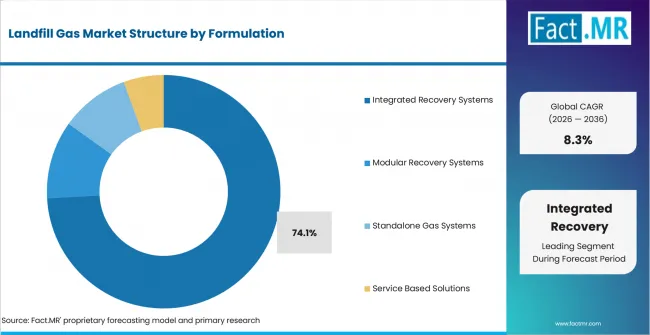
Landfill Gas Market Analysis By Formulation | Source: Fact.MR
Integrated Recovery Systems are forecast to lead Formulation since landfill owners prefer one design linking collection, processing, and utilization. Modular and standalone systems suit staged upgrades. Service-based solutions support long-term operations and field performance checks.
How does Distribution Channel shape procurement?
Direct Project Sales are projected to account for 36.2% share in 2026.
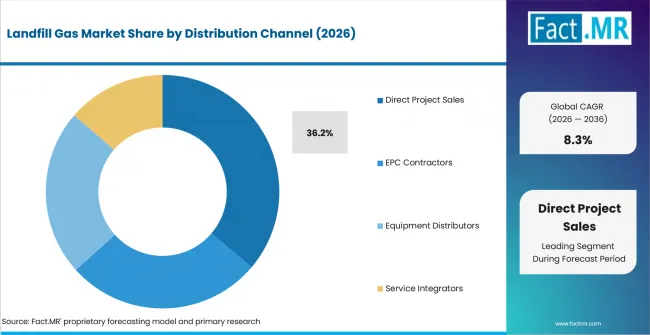
Landfill Gas Market Analysis By Distribution Channel | Source: Fact.MR
Direct Project Sales are projected to lead Distribution Channel because each landfill gas system depends on site yield, piping layout, and offtake route. EPC contractors handle complex builds, while service integrators support monitoring, parts, and maintenance.
What is accelerating Landfill Gas Market adoption, and what is holding it back?
Methane capture drives it; gas-yield decline restrains it.
Drivers Impact Analysis
| DRIVER | (~) % IMPACT ON CAGR | GEOGRAPHIC RELEVANCE | IMPACT TIMELINE |
|---|---|---|---|
| Landfill methane compliance | +2.3% | Germany, USA, UK | Short term (<= 2 years) |
| RNG and biomethane offtake | +1.9% | USA, Brazil, Germany | Medium term (2-4 years) |
| Installed power generation base | +1.6% | USA, UK, Japan | Short term (<= 2 years) |
| Integrated project contracting | +1.1% | Municipal landfill clusters | Medium term (2-4 years) |
| Remote monitoring and leak control | +0.8% | Regulated landfill markets | Long term (>= 4 years) |
Source: Fact.MR analysis. Updated Aug 14, 2026
- Landfill methane compliance: Operators collect gas when methane reporting, odor control, and post-closure rules tighten. Germany’s UBA reported methane emissions below 1.6 million tonnes in 2024 after a 67% reduction since 1990.
- Integrated project contracting: Landfill owners prefer project models that bundle collection design, gas processing, and long-term operation. This reduces handover risk between contractors and energy-system providers.
- Remote monitoring and leak control: Digital monitoring helps operators adjust wells before emissions or odor problems escalate. The value is highest where reporting and community exposure are both high. The Environment Agency reported in February 2026 that 20 TDM surveys were conducted at four English landfill sites and 21 UAV mass-balance surveys at three of those sites between September 2024 and March 2025, with methane collection efficiency values across the four sites ranging from 52% to 99%.
Opportunity Impact Analysis
| OPPORTUNITY | (~) % IMPACT ON CAGR | GEOGRAPHIC RELEVANCE | IMPACT TIMELINE |
|---|---|---|---|
| Landfill-gas-to-RNG conversion | +1.4% | USA, Brazil, Germany | Medium term (2-4 years) |
| Aging power asset retrofit | +1.0% | USA, UK, Japan | Short term (<= 2 years) |
| Municipal PPP structures | +0.8% | Brazil and emerging municipal markets | Medium term (2-4 years) |
| Leak detection services | +0.6% | Regulated landfill markets | Long term (>= 4 years) |
Source: Fact.MR analysis. Updated Aug 14, 2026
- Landfill-gas-to-RNG conversion: RNG conversion creates opportunity when gas volume, cleanup cost, and fuel offtake fit together. Ameresco said in September 2025 that its Lee County facility is designed to process 4,500 scfm of raw landfill gas and has annual renewable-energy generation of nearly 1.2 million dekatherms.
- Aging power asset retrofit: Older electricity projects need engine, control, and gas-treatment upgrades as gas quality changes. Retrofit work extends useful life without rebuilding a full project.
- Municipal PPP structures: Public landfill owners often need private capital and operating skill to commercialize methane. PPP structures can help combine public site control with private project development and operations.
- Leak detection services: Leak detection and wellfield audits give service firms repeatable work after installation. Remote checks reduce delay between field problems and corrective action.
Restraints Impact Analysis
| RESTRAINT | (~) % IMPACT ON CAGR | GEOGRAPHIC RELEVANCE | IMPACT TIMELINE |
|---|---|---|---|
| Mature-site gas yield decline | -1.2% | UK, Japan, Germany | Short term (<= 2 years) |
| Gas quality delays | -0.9% | USA, Brazil | Medium term (2-4 years) |
| Capital cost and incentive exposure | -0.7% | RNG project markets | Medium term (2-4 years) |
| Landfill diversion policies | -0.5% | Japan, Germany, UK | Long term (>= 4 years) |
Source: Fact.MR analysis. Updated Aug 14, 2026
- Declining gas yield at mature sites: Landfill gas output falls as disposal volumes decline and waste ages. Japan’s Ministry of the Environment reported 3.06 million tonnes of landfill waste in FY2024, down 3.2% from FY2023.
- Interconnection and gas quality delays: RNG projects need pipeline access, gas testing, and safety approval before revenue starts. Delays can weaken payback even when landfill gas is available.
- Capital cost and incentive exposure: Upgrading plants require compression, treatment, and monitoring equipment. Financing remains sensitive to fuel credit prices and offtake terms.
- Landfill diversion policies: Recycling and diversion reduce future methane generation at new sites. The effect is gradual, but it limits long-term gas volume in mature systems.
Which countries are scaling Landfill Gas Market fastest?
- The country comparison spans 3.4 percentage points and forms three practical growth bands across the forecast period.
- Germany remains 0.9 percentage point above Brazil through landfill methane control, regulated waste recovery and established gas-recovery infrastructure.
- Brazil remains 0.8 percentage point above the USA as biomethane policy, municipal disposal reform and PPP planning support landfill-gas development.
- The USA remains 0.8 percentage point above the UK through operating landfill-gas assets, RNG conversion opportunities and digital monitoring demand.
- The UK remains 0.9 percentage point above Japan as legacy landfill assets and methane accountability sustain collection and monitoring requirements.
- Japan closes the displayed range as low landfill volumes, strict disposal control and high incineration limit future methane generation.
Comparable CAGRs can create different entry conditions due to landfill scale, gas yield, biomethane policy, project economics and local compliance requirements. Full report coverage includes North America, Latin America, Europe, East Asia, South Asia and Pacific, Middle East and Africa.
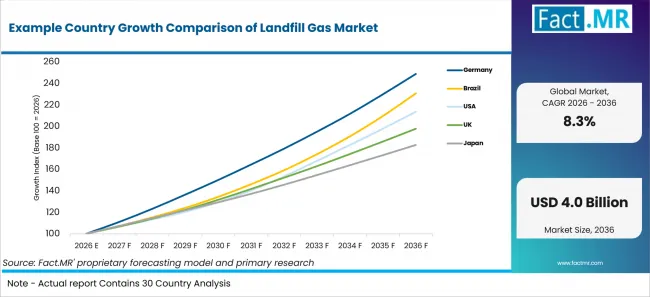
Example Country Growth Comparison Of Landfill Gas Market | Source: Fact.MR
| Country | CAGR (2026-2036) |
|---|---|
| Germany | 9.6% |
| Brazil | 8.7% |
| USA | 7.9% |
| UK | 7.1% |
| Japan | 6.2% |
Source: Fact.MR analysis. Updated Aug 14, 2026
What supports Germany adoption?
9.6% CAGR through 2036, shaped by landfill methane control and regulated waste recovery.
Germany’s growth is supported by established landfill-gas recovery and continued investment in older gas-producing sites. Destatis reported on February 27, 2026 that German landfills in the deposition and closure phase recovered 256.8 million cubic metres of landfill gas in 2024, while aftercare-phase landfills recovered 69.2 million cubic metres. Separately, Destatis reported in December 2025 that Germany generated 37.7 million tonnes of household waste in 2024, up 2.8% from 2023.Electricity projects favor upgrades where older sites maintain stable gas output, while operators use integrated systems when flare-only operation leaves energy value unused.
How is Brazil scaling landfill gas demand?
8.7% CAGR through 2036, driven by biomethane policy and municipal disposal reform.
Brazil’s growth is supported by biomethane policy, large sanitary landfills and municipal project development. Brazil’s Fuel of the Future Law established the National Program for Decarbonization of Natural Gas Producers and Importers and Incentive to Biomethane. In 2026, ANP adopted Resolutions 995/2026 and 996/2026, respectively covering the individualization of compulsory annual targets for natural-gas producers and importers and the certification framework for Biomethane Guarantee of Origin Certificates (CGOBs). ANP also opened a public consultation in December 2025 on revised biomethane quality rules, including a proposal for daily total-sulfur monitoring of biomethane from sanitary landfills and wastewater treatment plants.
What supports the USA outlook?
7.9% CAGR through 2036, supported by operating LFG assets and RNG conversion.
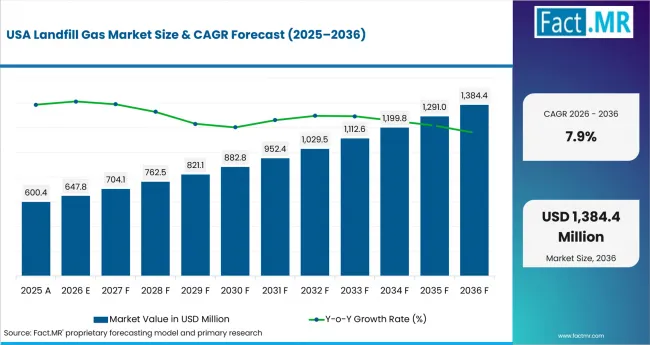
Landfill Gas Market Country Value Analysis | Source: Fact.MR
The USA’s growth reflects its large operating landfill-gas base and opportunities to convert captured methane into RNG, electricity, heat and vehicle fuel. EPA stated in June 2026 that landfills in 48 states and one U.S. territory provide landfill gas for electricity, heat, pipeline-quality gas, or vehicle fuel. EIA Table 2.5.B reports preliminary 2025 U.S. landfill-gas consumption for useful thermal output of 3,742 million cubic feet. RNG projects benefit when landfill owners control gas collection, while air monitoring raises demand for digital systems at large sites.
What underpins the UK growth path?
7.1% CAGR through 2036, led by legacy landfill assets and methane accountability.
The UK’s growth is shaped by legacy landfill infrastructure, methane-management obligations and continued operation of older gas-producing sites. England managed 25.2 million tonnes of local authority waste in 2024/25, while DESNZ provisionally estimated that the waste sector accounted for 6% of UK net territorial greenhouse gas emissions in 2025. Landfill operators are required to maintain gas collection, extraction and monitoring systems to control emissions and demonstrate compliance with environmental permit requirements.
How does Japan perform?
6.2% CAGR through 2036, shaped by low landfill volumes and strict disposal control.
Japan’s growth reflects selective landfill-gas recovery from older sites within a waste system characterized by low landfill volumes and strict disposal management. Japan’s Ministry of the Environment reported 38.11 million tonnes of municipal waste in FY2024, while METI reported that renewable energy, including hydroelectric power, accounted for 23.1% of Japan’s FY2024 power-generation mix.
Who leads the Landfill Gas Market?
WM, Ameresco, Montauk Renewables, and Infinis are directly active in landfill-gas recovery, RNG, or captured-methane power.
Their inclusion reflects documented landfill-gas project, RNG-production, and operating activity. WM said in April 2025 that its sustainability growth strategy was expected to result in 20 new WM-owned RNG facilities. Montauk reported 1.4 million MMBtu of RNG production in the second quarter of 2025. Ameresco said in January 2026 that its 5.2 MWe Upper Rock facility is designed to process 2,000 scfm of landfill gas and produce more than 500,000 dekatherms of RNG each year.
Tetra Tech, SUEZ, Veolia Environnement, and Infinis extend the provider set through engineering services, biogas recovery, and captured methane power. Tetra Tech supports landfill gas design, construction, and operations. SUEZ and Veolia link landfill gas recovery with wider waste services. Infinis remains relevant in the UK through captured methane power at landfill assets. Veolia said in October 2025 that it was studying deployment of TotalEnergies’ AUSEA drone-based methane-measurement technology for measurement campaigns at its landfill sites; the deployment would support Veolia’s target of 80% methane capture at landfills by 2032.
Which companies are the key providers?
Companies profiled in the report include WM, Ameresco, Montauk Renewables, Infinis, Tetra Tech, SUEZ, and Veolia.
- WM
- Ameresco Inc.
- Montauk Renewables Inc.
- Infinis
- Tetra Tech, Inc.
- SUEZ
- Veolia Environnement S.A.
Bibliography
- U.S. Environmental Protection Agency. (2026, June 11). Landfill Methane Outreach Program (LMOP).
- U.S. Energy Information Administration. (2026, July 23). Table 2.5.A. Landfill gas: Consumption for electricity generation, by sector, 2016–May 2026 (million cubic feet).
- Umweltbundesamt. (2026, July 2). Methan-Emissionen [Methane emissions].
- Heyer, K.-U., Hupe, K., Benkus, P., & Ritzkowski, M. (2026, March). Stand der Technik der Abfallablagerung auf Deponien in Deutschland und deren Beitrag zum Klimaschutz zur Vorbereitung der Arbeiten für ein BVT-Merkblatt Deponien [State of the art of waste disposal in landfills in Germany and its contribution to climate protection in preparation for work on a landfill BREF]. Umweltbundesamt.
- Statistisches Bundesamt (Destatis). (2025, December 16). 2,8 % mehr Haushaltsabfälle im Jahr 2024 [2.8% more household waste in 2024].
- Statistisches Bundesamt (Destatis). (2026, February 27). Abfallentsorgung 2024 – Gewonnenes Deponie- und Biogas [Waste disposal 2024 – Recovered landfill and biogas].
- Empresa de Pesquisa Energética. (2025, June 13). EPE divulga Fact Sheet sobre potencial econômico de biometano como alternativa veicular [EPE releases fact sheet on the economic potential of biomethane as a vehicle alternative].
- Agência Nacional do Petróleo, Gás Natural e Biocombustíveis. (2025, December 18). ANP fará consulta e audiência públicas sobre revisão de normas para biometano [ANP will hold public consultation and hearing on revision of biomethane regulations].
- Loschi, M., & Renaux, P. (2025, August 22). In 2024, waste collection reaches 93% of housing units, but 4.7 million still burn waste. IBGE News Agency.
- Department for Environment, Food & Rural Affairs. (2026, March 31). Local authority collected waste management – annual results 2024/25.
- Department for Energy Security and Net Zero. (2026, April 2). 2025 UK greenhouse gas emissions: Provisional figures – statistical release.
This Report Addresses
- The report provides strategic intelligence on the Landfill Gas Market across Product and Application choices that define recovery economics.
- Segment analysis covers Landfill Gas Collection Systems and Electricity Generation as the share leaders in 2026.
- Country outlook evaluates Germany and Brazil alongside the USA, UK, and Japan. South Korea is retained as a 2026 value point.
- Competitive analysis profiles WM and Ameresco alongside Montauk Renewables and Infinis. Tetra Tech, SUEZ, and Veolia complete the provider set.
- Technology assessment covers Gas Collection Technology and Gas Upgrading Technology. Energy Conversion and Digital Monitoring complete the operating view.
What does the Landfill Gas Market cover?
Landfill gas systems collect methane-rich gas from decomposing waste and direct it into energy or environmental-control uses.
The Landfill Gas Market covers collection wells, vacuum systems, gas cleaning, gas upgrading, engine-based power generation, monitoring, and service contracts. Coverage includes landfill gas recovery, biomethane production, and landfill power assets where methane capture creates revenue or compliance value. It also links to waste management services when landfill owners control disposal assets and energy offtake.
What is included in the scope?
The scope includes municipal and private landfill operators, utility companies, gas utilities, industrial users, EPC contractors, service integrators, and equipment distributors. Product coverage includes collection, processing, utilization, and monitoring systems. Adjacent coverage includes waste management equipment, leachate evaporation, and landfill mining where the activity influences landfill asset operation.
What is excluded from the scope?
The scope excludes general waste collection, incineration, anaerobic digestion assets that do not use landfill gas, and power systems without a landfill methane feedstock. It also excludes general gas engine systems unless the engine is applied to landfill gas. Renewable heating fuels, methane oxidation catalysts, odor neutralizing agents, and food waste reduction remain adjacent categories unless directly tied to landfill gas project economics.
How Was the Analysis Built?
The analysis draws on public agency data, company disclosures, country-level evidence, and industry interviews.
- Primary Research: Primary research includes discussions with landfill operators, EPC contractors, gas upgrading specialists, utilities, environmental service providers, procurement teams, and subject-matter experts. These discussions examine project design, gas yield, offtake terms, compliance burden, operating risk, and supplier selection.
- Desk Research: Desk research covers government statistics, methane inventories, energy datasets, company releases, regulatory publications, public waste data, standards, and official agency material. Key public sources cited in this report are documented in the bibliography.
- Market Sizing and Forecasting: Market estimates combine historical values from 2021 to 2025 with 2026 to 2036 forecasts, segment shares, country CAGRs, landfill project counts, gas consumption, municipal waste flows, company activity, and project barriers.
- Data Validation and Update Cycle: Findings are checked against public data, official waste statistics, company project updates, policy changes, and landfill gas operating evidence. Updates review new RNG projects, power-retrofit activity, regulatory changes, procurement trends, and country-level adoption shifts.
Segmentation
What is the report’s scope and coverage?
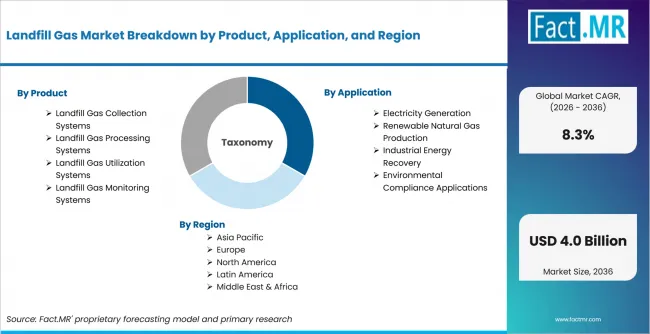
Landfill Gas Market Breakdown By Product, Application, And Region | Source: Fact.MR
| Attribute | Details |
|---|---|
| Quantitative Units | USD billion |
| Market Definition | Systems and services used to collect, process, upgrade, utilize, and monitor methane-rich gas recovered from landfills for energy or compliance use |
| Product | Landfill Gas Collection Systems; Active Gas Collection Systems; Passive Gas Collection Systems; Landfill Gas Processing Systems; Gas Cleaning Systems; Gas Upgrading Systems; Landfill Gas Utilization Systems; Electricity Generation Systems; Thermal Energy Recovery Systems; Landfill Gas Monitoring Systems; Emission Monitoring Systems; Operational Monitoring Systems |
| Application | Electricity Generation; Utility Scale Power Generation; Distributed Power Generation; Renewable Natural Gas Production; Pipeline Injection Applications; Transportation Fuel Applications; Industrial Energy Recovery; Process Heat Applications; Direct Fuel Applications; Environmental Compliance Applications; Emission Reduction Applications; Carbon Management Applications |
| End Use | Municipal Landfill Operators; Public Landfill Operators; Private Landfill Operators; Utility Companies; Electric Utilities; Gas Utilities; Industrial Companies; Manufacturing Facilities; Energy Intensive Industries; Environmental Service Providers; Waste Management Companies; Sustainability Service Providers |
| Technology | Gas Collection Technology; Vacuum Extraction Systems; Passive Collection Systems; Gas Upgrading Technology; Membrane Separation Systems; Pressure Swing Adsorption Systems; Energy Conversion Technology; Engine Based Systems; Turbine Based Systems; Digital Monitoring Technology; Remote Monitoring Systems; Predictive Analytics Systems |
| Formulation | Integrated Recovery Systems; Collection and Processing Systems; Processing and Utilization Systems; Modular Recovery Systems; Containerized Processing Units; Scalable Recovery Platforms; Standalone Gas Systems; Dedicated Collection Systems; Dedicated Processing Systems; Service Based Solutions; Managed Operations Services; Engineering Services |
| Distribution Channel | Direct Project Sales; Municipal Project Contracts; Private Project Contracts; EPC Contractors; Engineering Procurement Contractors; Turnkey Solution Providers; Equipment Distributors; Regional Equipment Suppliers; Specialized Technology Distributors; Service Integrators; Environmental System Integrators; Energy Solution Integrators |
| Regions Covered | North America; Latin America; Europe; East Asia; South Asia and Pacific; Middle East and Africa |
| Countries Covered | Germany; Brazil; USA; UK; Japan; South Korea value point |
| Key Companies Profiled | WM; Ameresco Inc.; Montauk Renewables Inc.; Infinis; Tetra Tech, Inc.; SUEZ; Veolia Environnement S.A. |
| Forecast Period | 2026 to 2036 |
| Approach | Hybrid top-down and bottom-up approach using landfill gas project counts, landfill gas consumption, municipal waste data, methane policy, biomethane rules, electricity generation use, RNG project activity, country adoption patterns, and company portfolio review |
Source: Fact.MR analysis. Updated Aug 14, 2026
How is the market segmented?
-
By Product:
- Landfill Gas Collection Systems
- Active Gas Collection Systems
- Passive Gas Collection Systems
- Landfill Gas Processing Systems
- Gas Cleaning Systems
- Gas Upgrading Systems
- Landfill Gas Utilization Systems
- Electricity Generation Systems
- Thermal Energy Recovery Systems
- Landfill Gas Monitoring Systems
- Emission Monitoring Systems
- Operational Monitoring Systems
- Landfill Gas Collection Systems
-
By Application:
- Electricity Generation
- Utility Scale Power Generation
- Distributed Power Generation
- Renewable Natural Gas Production
- Pipeline Injection Applications
- Transportation Fuel Applications
- Industrial Energy Recovery
- Process Heat Applications
- Direct Fuel Applications
- Environmental Compliance Applications
- Emission Reduction Applications
- Carbon Management Applications
- Electricity Generation
-
By End Use:
- Municipal Landfill Operators
- Public Landfill Operators
- Private Landfill Operators
- Utility Companies
- Electric Utilities
- Gas Utilities
- Industrial Companies
- Manufacturing Facilities
- Energy Intensive Industries
- Environmental Service Providers
- Waste Management Companies
- Sustainability Service Providers
- Municipal Landfill Operators
-
By Technology:
- Gas Collection Technology
- Vacuum Extraction Systems
- Passive Collection Systems
- Gas Upgrading Technology
- Membrane Separation Systems
- Pressure Swing Adsorption Systems
- Energy Conversion Technology
- Engine Based Systems
- Turbine Based Systems
- Digital Monitoring Technology
- Remote Monitoring Systems
- Predictive Analytics Systems
- Gas Collection Technology
-
By Formulation:
- Integrated Recovery Systems
- Collection and Processing Systems
- Processing and Utilization Systems
- Modular Recovery Systems
- Containerized Processing Units
- Scalable Recovery Platforms
- Standalone Gas Systems
- Dedicated Collection Systems
- Dedicated Processing Systems
- Service Based Solutions
- Managed Operations Services
- Engineering Services
- Integrated Recovery Systems
-
By Distribution Channel:
- Direct Project Sales
- Municipal Project Contracts
- Private Project Contracts
- EPC Contractors
- Engineering Procurement Contractors
- Turnkey Solution Providers
- Equipment Distributors
- Regional Equipment Suppliers
- Specialized Technology Distributors
- Service Integrators
- Environmental System Integrators
- Energy Solution Integrators
- Direct Project Sales
-
By Region:
- North America
- Latin America
- Western Europe
- Eastern Europe
- East Asia
- South Asia and Pacific
- Middle East & Africa
Frequently Asked Questions
How big is the landfill gas market in 2026?
What is the CAGR of the landfill gas market from 2026 to 2036?
Which product leads the landfill gas market?
Which application leads the landfill gas market?
Who are the leading companies in the landfill gas market?
Who worked on this report


Preview the report firsthand - request a free sample
Free SampleGet the brochure for pricing and purchase details
Download PDF