Aerial Work Platforms Market

Aerial Work Platforms Market Analysis, By Product Type (Scissor Lifts Boom Lifts, and others), By End-Use Industry, By Propulsion Type and By Region- Market Insights 2025 to 2035

The Scissor Lifts segment is projected to grow at a CAGR of 5.5%, whereas another segment Boom Lifts is likely to grow at 6.9%. In terms of countries USA is projected to grow at 5.7%, followed by China at 7% and Germany to grow at 6.4%

Aerial Work Platforms Market Outlook (2025 to 2035)

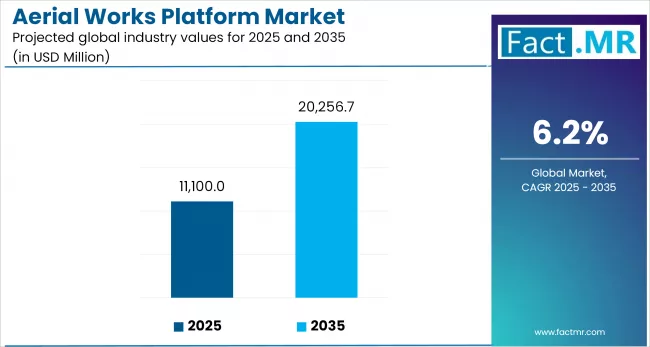
The global aerial work platforms market is expected to reach USD 20.3 billion by 2035, up from USD 10.5 billion in 2024. During the forecast period (2025 to 2035), the industry is projected to expand at a CAGR of 6.2%.

The aerial work platforms market is growing with urbanization and the development of high-rise construction projects that require secure access solutions. Implementation of stringent safety codes is compelling industries to replace conventional methods with compliant and stable technologies.

Aerial Works Platform Market

A contributing factor to this demand is the adoption of electric and engine-powered AWPs, which support emission-free and sustainable processes. These factors collectively broaden the applications of AWP in the construction, manufacturing and facility maintenance sectors.

Quick Facts for Aerial Work Platforms Market

  • Industry Value (2025): USD 11,100 Million
  • Projected Value (2035): USD 20,256 Million
  • Forecast CAGR (2025 to 2035): 6.2%
  • Leading Segment (2025): Scissor Lift (44% Market Share)
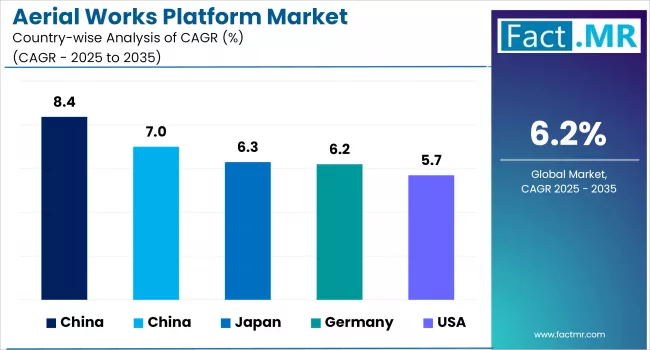
  • Country Growth Rate (2025 to 2035): China (8.4% CAGR)
  • Top Key Players: Terex Corporation, Oshkosh Corporation, Palfinger AG, IMER Group, and Snorkel Lifts

What are the drivers of the aerial works platform market?

Urbanization is a significant factor in the aerial work platforms market, as new infrastructure, real estate, and smart cities are developing rapidly, and dependable elevated work is mandatory. The use of AWPs in high-rise construction projects is becoming significant with safer and convenient operations as compared to traditional scaffolding.

This ability to access hard-to-reach heights with precision improves both productivity and safety. The need for AWPs is on the rise as urbanization levels are recorded to have increased in both developed and developing economies. Such systems are now required in the construction of new buildings as well as retrofitting works. Their implementations are expected to increase further in response to the demand for more construction efficiency.

Stringent safety standards are compelling the industries to use aerial work platforms as they provide a safer and more efficient alternative to scaffolding and ladders. Safety standards are also being maintained at job sites, particularly during construction and utility operations, by the procurement bodies to prevent falls and other accidents.

AWPs provide increased stability, future potential for integrated safety harness systems, and enhanced vertical reach. Companies are able to reduce liability while improving workplace safety through their use. The demand for compliance is growing in both the public and private infrastructure. Safety will continue to be a significant variable that contributes to market growth as legislations increase in terms of its stringency.

Indoor operational requirements and environmental sustainability considerations are driving the transition to electric and hybrid aerial work platforms. These models produce zero emissions and operate at significantly lower noise levels than diesel-powered alternatives.

They are regulated to be used in indoor areas, inner-city construction works and sensitive areas. The manufacturers are focusing on the efficiency of batteries, fast charging and smaller design to ensure the batteries keep up with the rising demand. This shift is being supported by government incentive programs promoting low-emission construction equipment.

What are the regional trends of the aerial works platform market?

The aerial work platforms market is experiencing steady expansion in North America, driven by the growth in construction and stringent safety standards, especially in the U.S. Additional drivers include the rehabilitation of aging infrastructure and the growing popularity of electric models.

Strict environmental regulations and safety standards make Europe market more focused on hybrid and electric AWPs consumption. Countries such as Germany and the UK are leading in applications across industrial maintenance and warehousing.

Asia Pacific is becoming the most rapidly developing region with its high rates of urbanization, industrialization, and investments in its infrastructure in countries like China and India. AWP usage is supported by increasing demand for high-rise construction and expanding logistics operations.

Growth in the Middle East and Africa region is taking shape, with future expansion expected from ongoing construction activity, especially in the United Arab Emirates and Saudi Arabia. Regional demand is caused by the increasing requirement for oil and gas, as well as commercial development to increase the capacity of its platforms.

The Latin American market is growing at a gradual pace, with Brazil leading in construction and energy projects. As infrastructure projects advance and workplace safety awareness increases, the use of aerial work platforms continues to rise across the region.

Country-Wise Insights

Advanced safety mandates and electrification drive USA’s aerial work platforms market

Aerial Works Platform Market By Country

The aerial work platform market in the USA is growing due to the Occupational Safety and Health Administration (OSHA) standards and the enforcement of stricter labor safety practices. Policies at the federal and state level, along with the promotion of electrified equipment, have supported the adoption of zero-emission scissor lifts, boom lifts, and vertical mast equipment in indoor areas, warehouses and urban construction zones.

States such as California, New York, and Illinois are advancing battery-swapping facilities and mobile charging trailers to facilitate more extensive platform electrification. Predictive maintenance and operator monitoring integration of IoT enabled load sensors and platform diagnostics are being developed by companies like JLG Industries and Genie.

Attachments, modules, and hybrid chassis now conform to FEMA standards of post-disaster access and elevation. Rental firms working to subsidize equipment that meets ANSI standards are changing the orientation, with an emphasis on platform high specification instead of the expansion of fleet volume, particularly in tech campuses, delivery hubs, and energy sector refineries.

Logistics optimization and safety protocols advance china’s aerial work platforms market

The aerial work platforms industry is experiencing a structural upgrade in China under the influence of the national guidance to strengthen the worksite safety, increase vertical mobility and reduce city emissions.

The expansion of zero-emission construction fleet regulatory framework, as well as the introduction of height-based safety audits, has increased demand in the real estate, rail, and public utilities sectors. Guangdong, Zhejiang and Shandong are developing smart manufacturing parks on battery-driven lifts and AI-controlled operator panels to enable localized production.

OEMs collaborations with agencies in charge of public infrastructure supported by Sinopec and CSCEC are promoting sensor-linked telematics, automatic leveling tools, and insulated boom systems for live-line maintenance.  

The modules of stacking lifts, the rapid folding guardrail, and the corrosion-proof alloy mast have become central elements in the national streamlining of logistics. Platform manufacturers are being given grants to meet with GB standards, particularly benefiting small and mid-sized manufacturing companies. This support is contributing to increased deployment of post-installing modules in high-speed rail, offshore wind farms, and dense urban areas.

Eco-regulations and robotics integration fuel Germany’s aerial work platforms market

The EU emission guidelines, TUV-approved safety standards, and green building regulations have led to the development of the market of aerial work platforms in Germany. The trend driven by automation in the country in industrial and logistics is catalyzing the implementation of robotic-assisted platforms to operate on precision-based procedures in automotive plants, wind turbines, and data centres.

German states like Bavaria, North Rhine-Westphalia, and Baden-Wuerttemberg are investing in the AI-integrated lift systems, as they have proximity sensors, an autonomous docking system, and multiple diagnostics functions.

Partnerships are fueling the next-gen controller software with the Fraunhofer Institutes and German OEMs that meet the DGUV and CE norms while improving the ergonomics and platform stability. Lightweight aluminum frames, recycled polymer paneling, and designed for quick terrain adaptation, all facilitate green jobsite compliance and smart construction objectives.

Category-Wise Analysis

Compact design and vertical efficiency position scissor lifts as market mainstay

Aerial Works Platform Market By Product Type

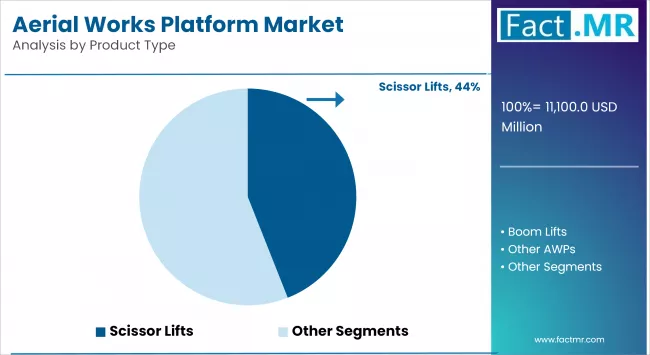
The attributes of a scissor lift, including its compact design, vertical-only elevation, and the ability to operate indoors or in confined spaces, has positioned it as a fundamental product segment in the aerial work platforms market. Its applications are commonly found in warehouse management, signage repairs and electrical fitting in shopping centers and commercial premises.  

Scissor lifts are considered safer, stable and suitable for vertical lifting tasks because of the non-rotating platform surface. Electric-based scissor lift with narrow base frame is preferred in the developed markets due to its quiet, non-emission operation in restricted corridors.

Continued advancements include features such as fold-out extensions, smart control interfaces, and emergency descent mechanisms in recently manufactured models. Demand from small contractors and facility managers continues to be shaped by factors such as maneuverability, load support capacity, and height safety limitations.  

Elevated access and safety standards cement construction as core application area

The end-use market with the most significant influence on the aerial work platforms is the construction industry, given their application in safe, repetitive, and elevated access during framing, cladding and finishing processes.

Aerial platforms are integral to construction activities involving high-rise buildings, bridges and various commercial facilities that need precision at different levels. These platforms minimize the use of scaffolding and ladders, ensuring quicker set-up and minimum risk of falls on-site.

In both developed and developing regions, construction companies are currently using electric-gas and hybrid models to comply with city-based emission and noise standards. Rental service operators are building fleets that are customized to civil infrastructure and modular building works. These machines have become essential in the high-compliance, performance-oriented construction sites, offering improved load-bearing capacity, guard rail stability and terrain adaptability.

Emission-free operation and urban usability establish electric platforms as sustainable choice

Aerial Works Platform Market By Electric Engine

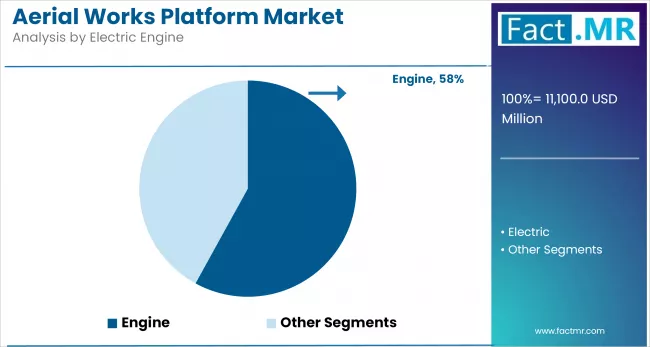
There is an emerging popularity of electric-powered aerial work platforms because of their silent air operations, absence of exhaust emissions, and suitability for use in indoor or heavily occupied construction zones. This has strengthened their market position, aligned with global sustainability requirements, and built certifications that promote the use of electric equipment over diesel equipment.

These are the platforms that are getting more common in warehouses, airports, hospitals and high-rise interiors where noise and fumes are limited. Multi-shift operations and other requirements are being increased to long battery ranges, recharge cycles and terrain safety.

A combination of smart diagnostics and regenerative braking is also becoming the norm to increase efficiency. Motivators by the government and reducing the carbon emissions of their fleets largely add to the growth of the electric-powered platforms in both developed and emerging markets.

Competitive Analysis

The aerial work platforms industry is highly competitive, with manufacturers relying on innovation, product safety, and application-specific customization. There is an increasing focus on electric and hybrid models, with more emphasis on compact design, better maneuverability and adherence to emission regulations. Collaborations with rental companies and integration on digital platforms are helping to expand coverage in the construction, maintenance, and warehousing fields.

A significant portion of R&D involves automation and features of smart controls, as well as predictive maintenance to increase safety and operational uptime. The manufacturing companies are also globalizing to produce in areas with high demand, aiming to reduce lead time and to align better with local safety regulations.

With growing regulatory pressure and evolving user needs, market differentiation is currently based on advanced functionality, economical deployment, and engineering sustainability.

Key players in the aerial works platform industry include Terex Corporation, Oshkosh Corporation, Palfinger AG, IMER Group, Aichi Corporation, Snorkel Lifts, and others.

Recent Developments

  • In May 2025, MEC launches the 66-RJ Telescopic Boom, Providing Ultimate Reach Versatility that delivers exceptional performance for working at height.
  • In January 2025, Tadano Ltd. announced the successful completion of its acquisition of the transportation system business of IHI Transport Machinery Co., Ltd., a consolidated subsidiary of IHI Corporation.

Fact.MR has provided detailed information about the price points of key manufacturers of the Aerial Works Platform Market positioned across regions, sales growth, production capacity, and speculative technological expansion, in the recently published report.

Methodology and Industry Tracking Approach

The global aerial work platforms market 2025 covers the input of more than 10,000 professionals in 28 countries, and the average number of validated answers per regional cluster totaled 250. Those who had taken part were site safety officers, managers of lift rentals, height access engineers, heads of equipment procurement, and regulatory consultants.

The research event was a structured survey conducted from July 2024 to June 2025. It involved the evaluation of the use of platforms, the safety and height performance of platforms, compliance with platform emissions, and operations in construction, warehousing, utilities, and maintenance facilitation.

More than 300 validated sources of safety codes, machinery compliance handbook, ergonomic research studies, and records on fleet upgrading were consulted. The growth was predicted at the segment and propulsion levels by making use of regional adoption indexes and time-series regressions.

Recommendations are assigned to OEMs, rental companies, infrastructure developers, and facility managers, and they are related to the sustainable, electric-powered, safety-improved, and compact aerial work platforms that fit both indoor and outdoor deployment requirements.

With Fact.MR has been monitoring consumer behavior, product efficacy, industry trends, and market opportunities since 2018, and this report is becoming an authoritative source of information that stakeholders can rely on.

Segmentation of Aerial Works Platform Market

  • By Product Type :

    • Scissor Lifts
    • Boom Lifts
    • Other AWPs
  • By End-User Industry :

    • Construction
    • Entertainment
    • Commercial Uses
    • Manufacturing
    • Others (Public Administration, Mining, Agriculture, etc.)
  • By Propulsion :

    • Electric
    • Engine
  • By Region :

    • North America
    • Latin America
    • Western Europe
    • Eastern Europe
    • East Asia
    • South Asia & Pacific
    • Middle East & Africa

Table of Content

  1. Executive Summary
    • Global Market Outlook
    • Demand-side Trends
    • Supply-side Trends
    • Technology Roadmap Analysis
    • Analysis and Recommendations
  2. Market Overview
    • Market Coverage / Taxonomy
    • Market Definition / Scope / Limitations
  3. Market Background
    • Market Dynamics
      • Drivers
      • Restraints
      • Opportunity
      • Trends
    • Scenario Forecast
      • Demand in Optimistic Scenario
      • Demand in Likely Scenario
      • Demand in Conservative Scenario
    • Opportunity Map Analysis
    • Product Life Cycle Analysis
    • Supply Chain Analysis
      • Supply Side Participants and their Roles
        • Producers
        • Mid-Level Participants (Traders/ Agents/ Brokers)
        • Wholesalers and Distributors
      • Value Added and Value Created at Node in the Supply Chain
      • List of Component Suppliers
      • List of Existing and Potential Buyers
    • Investment Feasibility Matrix
    • Value Chain Analysis
      • Profit Margin Analysis
      • Wholesalers and Distributors
    • PESTLE and Porter’s Analysis
    • Regulatory Landscape
      • By Key Regions
      • By Key Countries
    • Production and Consumption Statistics
    • Import and Export Statistics
  4. Global Market Analysis 2020-2024 and Forecast, 2025-2035
    • Historical Market Size Value (USD Bn) & Volume (Units) Analysis, 2020-2024
    • Current and Future Market Size Value (USD Bn) & Volume (Units) Projections, 2025-2035
      • Y-o-Y Growth Trend Analysis
      • Absolute $ Opportunity Analysis
  5. Global Market Pricing Analysis 2020-2024 and Forecast 2025-2035
  6. Global Market Analysis 2020-2024 and Forecast 2025-2035, By Product Type
    • Introduction / Key Findings
    • Historical Market Size Value (USD Bn) & Volume (Units) Analysis By Product Type, 2020-2024
    • Current and Future Market Size Value (USD Bn) & Volume (Units) Analysis and Forecast By Product Type, 2025-2035
      • Scissor Lifts
      • Boom Lifts
      • Other AWPs
    • Y-o-Y Growth Trend Analysis By Product Type, 2020-2024
    • Absolute $ Opportunity Analysis By Product Type, 2025-2035
  7. Global Market Analysis 2020-2024 and Forecast 2025-2035, By End-User Industry
    • Introduction / Key Findings
    • Historical Market Size Value (USD Bn) & Volume (Units) Analysis By End-User Industry, 2020-2024
    • Current and Future Market Size Value (USD Bn) & Volume (Units) Analysis and Forecast By End-User Industry, 2025-2035
      • Construction
      • Entertainment
      • Commercial Uses
      • Manufacturing
      • Others (Public Administration, Mining, Agriculture, etc.)
    • Y-o-Y Growth Trend Analysis By End-User Industry, 2020-2024
    • Absolute $ Opportunity Analysis By End-User Industry, 2025-2035
  8. Global Market Analysis 2020-2024 and Forecast 2025-2035, By Propulsion Type
    • Introduction / Key Findings
    • Historical Market Size Value (USD Bn) & Volume (Units) Analysis By Propulsion Type, 2020-2024
    • Current and Future Market Size Value (USD Bn) & Volume (Units) Analysis and Forecast By Propulsion Type, 2025-2035
      • Electric
      • Engine
    • Y-o-Y Growth Trend Analysis By Propulsion Type, 2020-2024
    • Absolute $ Opportunity Analysis By Propulsion Type, 2025-2035
  9. Global Market Analysis 2020-2024 and Forecast 2025-2035, By Region
    • Introduction
    • Historical Market Size Value (USD Bn) & Volume (Units) Analysis By Region, 2020-2024
    • Current Market Size Value (USD Bn) & Volume (Units) Analysis and Forecast By Region, 2025-2035
      • North America
      • Latin America
      • Western Europe
      • East Asia
      • South Asia Pacific
      • Eastern Europe
      • Middle East & Africa
    • Market Attractiveness Analysis By Region
  10. North America Market Analysis 2020-2024 and Forecast 2025-2035, By Country
    • Historical Market Size Value (USD Bn) & Volume (Units) Trend Analysis By Market Taxonomy, 2020-2024
    • Market Size Value (USD Bn) & Volume (Units) Forecast By Market Taxonomy, 2025-2035
      • By Country
        • U.S.
        • Canada
        • Mexico
      • By Product Type
      • By End-User Industry
      • By Propulsion Type
    • Market Attractiveness Analysis
      • By Country
      • By Product Type
      • By End-User Industry
      • By Propulsion Type
    • Key Takeaways
  11. Latin America Market Analysis 2020-2024 and Forecast 2025-2035, By Country
    • Historical Market Size Value (USD Bn) & Volume (Units) Trend Analysis By Market Taxonomy, 2020-2024
    • Market Size Value (USD Bn) & Volume (Units) Forecast By Market Taxonomy, 2025-2035
      • By Country
        • Brazil
        • Chile
        • Rest of Latin America
      • By Product Type
      • By End-User Industry
      • By Propulsion Type
    • Market Attractiveness Analysis
      • By Country
      • By Product Type
      • By End-User Industry
      • By Propulsion Type
    • Key Takeaways
  12. Western Europe Market Analysis 2020-2024 and Forecast 2025-2035, By Country
    • Historical Market Size Value (USD Bn) & Volume (Units) Trend Analysis By Market Taxonomy, 2020-2024
    • Market Size Value (USD Bn) & Volume (Units) Forecast By Market Taxonomy, 2025-2035
      • By Country
        • Germany
        • Italy
        • France
        • U.K.
        • Spain
        • Russia
        • BENELUX
        • Rest of Europe
      • By Product Type
      • By End-User Industry
      • By Propulsion Type
    • Market Attractiveness Analysis
      • By Country
      • By Product Type
      • By End-User Industry
      • By Propulsion Type
    • Key Takeaways
  13. East Asia Market Analysis 2020-2024 and Forecast 2025-2035, By Country
    • Historical Market Size Value (USD Bn) & Volume (Units) Trend Analysis By Market Taxonomy, 2020-2024
    • Market Size Value (USD Bn) & Volume (Units) Forecast By Market Taxonomy, 2025-2035
      • By Country
        • China
        • Japan
        • South Korea
      • By Product Type
      • By End-User Industry
      • By Propulsion Type
    • Market Attractiveness Analysis
      • By Country
      • By Product Type
      • By End-User Industry
      • By Propulsion Type
    • Key Takeaways
  14. South Asia Pacific Market Analysis 2020-2024 and Forecast 2025-2035, By Country
    • Historical Market Size Value (USD Bn) & Volume (Units) Trend Analysis By Market Taxonomy, 2020-2024
    • Market Size Value (USD Bn) & Volume (Units) Forecast By Market Taxonomy, 2025-2035
      • By Country
        • India
        • ASEAN Countries
        • Australia & New Zealand
        • Rest of South Asia Pacific
      • By Product Type
      • By End-User Industry
      • By Propulsion Type
    • Market Attractiveness Analysis
      • By Country
      • By Product Type
      • By End-User Industry
      • By Propulsion Type
    • Key Takeaways
  15. Eastern Europe Market Analysis 2020-2024 and Forecast 2025-2035, By Country
    • Historical Market Size Value (USD Bn) & Volume (Units) Trend Analysis By Market Taxonomy, 2020-2024
    • Market Size Value (USD Bn) & Volume (Units) Forecast By Market Taxonomy, 2025-2035
      • By Country
        • Russia
        • Poland
        • Hungary
        • Balkan & Baltics
        • Rest of Eastern Europe
      • By Product Type
      • By End-User Industry
      • By Propulsion Type
    • Market Attractiveness Analysis
      • By Country
      • By Product Type
      • By End-User Industry
      • By Propulsion Type
    • Key Takeaways
  16. Middle East & Africa Market Analysis 2020-2024 and Forecast 2025-2035, By Country
    • Historical Market Size Value (USD Bn) & Volume (Units) Trend Analysis By Market Taxonomy, 2020-2024
    • Market Size Value (USD Bn) & Volume (Units) Forecast By Market Taxonomy, 2025-2035
      • By Country
        • KSA
        • Other GCC Countries
        • Turkiye
        • South Africa
        • Rest of MEA
      • By Product Type
      • By End-User Industry
      • By Propulsion Type
    • Market Attractiveness Analysis
      • By Country
      • By Product Type
      • By End-User Industry
      • By Propulsion Type
    • Key Takeaways
  17. Key Countries Market Analysis
    • USA
      • Pricing Analysis
      • Market Share Analysis, 2024
        • By Product Type
        • By End-User Industry
        • By Propulsion Type
    • China
      • Pricing Analysis
      • Market Share Analysis, 2024
        • By Product Type
        • By End-User Industry
        • By Propulsion Type
    • Germany
      • Pricing Analysis
      • Market Share Analysis, 2024
        • By Product Type
        • By End-User Industry
        • By Propulsion Type
    • Japan
      • Pricing Analysis
      • Market Share Analysis, 2024
        • By Product Type
        • By End-User Industry
        • By Propulsion Type
    • UK
      • Pricing Analysis
      • Market Share Analysis, 2024
        • By Product Type
        • By End-User Industry
        • By Propulsion Type
  18. Market Structure Analysis
    • Competition Dashboard
    • Competition Benchmarking
    • Market Share Analysis of Top Players
      • By Regional
      • By Product Type
      • By End-User Industry
      • By Propulsion Type
  19. Competition Analysis
    • Competition Deep Dive
      • Haulotte Group
        • Overview
        • Product Portfolio
        • Profitability by Market Segments (Product/Age /Sales Channel/Region)
        • Sales Footprint
        • Strategy Overview
          • Marketing Strategy
          • Product Strategy
          • Channel Strategy
      • Terex Corporation
        • Overview
        • Product Portfolio
        • Profitability by Market Segments (Product/Age /Sales Channel/Region)
        • Sales Footprint
        • Strategy Overview
          • Marketing Strategy
          • Product Strategy
          • Channel Strategy
      • Oshkosh Corporation
        • Overview
        • Product Portfolio
        • Profitability by Market Segments (Product/Age /Sales Channel/Region)
        • Sales Footprint
        • Strategy Overview
          • Marketing Strategy
          • Product Strategy
          • Channel Strategy
      • Snorkel Lifts
        • Overview
        • Product Portfolio
        • Profitability by Market Segments (Product/Age /Sales Channel/Region)
        • Sales Footprint
        • Strategy Overview
          • Marketing Strategy
          • Product Strategy
          • Channel Strategy
      • Palfinger AG
        • Overview
        • Product Portfolio
        • Profitability by Market Segments (Product/Age /Sales Channel/Region)
        • Sales Footprint
        • Strategy Overview
          • Marketing Strategy
          • Product Strategy
          • Channel Strategy
      • IMER Group
        • Overview
        • Product Portfolio
        • Profitability by Market Segments (Product/Age /Sales Channel/Region)
        • Sales Footprint
        • Strategy Overview
          • Marketing Strategy
          • Product Strategy
          • Channel Strategy
      • Aichi Corporation
        • Overview
        • Product Portfolio
        • Profitability by Market Segments (Product/Age /Sales Channel/Region)
        • Sales Footprint
        • Strategy Overview
          • Marketing Strategy
          • Product Strategy
          • Channel Strategy
      • MEC Aeriel Works Platform
        • Overview
        • Product Portfolio
        • Profitability by Market Segments (Product/Age /Sales Channel/Region)
        • Sales Footprint
        • Strategy Overview
          • Marketing Strategy
          • Product Strategy
          • Channel Strategy
      • Manlift
        • Overview
        • Product Portfolio
        • Profitability by Market Segments (Product/Age /Sales Channel/Region)
        • Sales Footprint
        • Strategy Overview
          • Marketing Strategy
          • Product Strategy
          • Channel Strategy
      • Tadano Limited
        • Overview
        • Product Portfolio
        • Profitability by Market Segments (Product/Age /Sales Channel/Region)
        • Sales Footprint
        • Strategy Overview
          • Marketing Strategy
          • Product Strategy
          • Channel Strategy
      • Manitou Group
        • Overview
        • Product Portfolio
        • Profitability by Market Segments (Product/Age /Sales Channel/Region)
        • Sales Footprint
        • Strategy Overview
          • Marketing Strategy
          • Product Strategy
          • Channel Strategy
      • J C Bamford Excavators Limited
        • Overview
        • Product Portfolio
        • Profitability by Market Segments (Product/Age /Sales Channel/Region)
        • Sales Footprint
        • Strategy Overview
          • Marketing Strategy
          • Product Strategy
          • Channel Strategy
      • Mantall Heavy Industry Co.
        • Overview
        • Product Portfolio
        • Profitability by Market Segments (Product/Age /Sales Channel/Region)
        • Sales Footprint
        • Strategy Overview
          • Marketing Strategy
          • Product Strategy
          • Channel Strategy
      • JLG Industries
        • Overview
        • Product Portfolio
        • Profitability by Market Segments (Product/Age /Sales Channel/Region)
        • Sales Footprint
        • Strategy Overview
          • Marketing Strategy
          • Product Strategy
          • Channel Strategy
  20. Assumptions & Acronyms Used
  21. Research Methodology

List Of Table

  • Table 1: Global Market Value (USD Bn) Forecast by Region, 2020 to 2035
  • Table 2: Global Market Volume (Units) Forecast by Region, 2020 to 2035
  • Table 3: Global Market Value (USD Bn) Forecast by Product Type, 2020 to 2035
  • Table 4: Global Market Volume (Units) Forecast by Product Type, 2020 to 2035
  • Table 5: Global Market Value (USD Bn) Forecast by End-User Industry, 2020 to 2035
  • Table 6: Global Market Volume (Units) Forecast by End-User Industry, 2020 to 2035
  • Table 7: Global Market Value (USD Bn) Forecast by Propulsion Type, 2020 to 2035
  • Table 8: Global Market Volume (Units) Forecast by Propulsion Type, 2020 to 2035
  • Table 9: North America Market Value (USD Bn) Forecast by Country, 2020 to 2035
  • Table 10: North America Market Volume (Units) Forecast by Country, 2020 to 2035
  • Table 11: North America Market Value (USD Bn) Forecast by Product Type, 2020 to 2035
  • Table 12: North America Market Volume (Units) Forecast by Product Type, 2020 to 2035
  • Table 13: North America Market Value (USD Bn) Forecast by End-User Industry, 2020 to 2035
  • Table 14: North America Market Volume (Units) Forecast by End-User Industry, 2020 to 2035
  • Table 15: North America Market Value (USD Bn) Forecast by Propulsion Type, 2020 to 2035
  • Table 16: North America Market Volume (Units) Forecast by Propulsion Type, 2020 to 2035
  • Table 17: Latin America Market Value (USD Bn) Forecast by Country, 2020 to 2035
  • Table 18: Latin America Market Volume (Units) Forecast by Country, 2020 to 2035
  • Table 19: Latin America Market Value (USD Bn) Forecast by Product Type, 2020 to 2035
  • Table 20: Latin America Market Volume (Units) Forecast by Product Type, 2020 to 2035
  • Table 21: Latin America Market Value (USD Bn) Forecast by End-User Industry, 2020 to 2035
  • Table 22: Latin America Market Volume (Units) Forecast by End-User Industry, 2020 to 2035
  • Table 23: Latin America Market Value (USD Bn) Forecast by Propulsion Type, 2020 to 2035
  • Table 24: Latin America Market Volume (Units) Forecast by Propulsion Type, 2020 to 2035
  • Table 25: Western Europe Market Value (USD Bn) Forecast by Country, 2020 to 2035
  • Table 26: Western Europe Market Volume (Units) Forecast by Country, 2020 to 2035
  • Table 27: Western Europe Market Value (USD Bn) Forecast by Product Type, 2020 to 2035
  • Table 28: Western Europe Market Volume (Units) Forecast by Product Type, 2020 to 2035
  • Table 29: Western Europe Market Value (USD Bn) Forecast by End-User Industry, 2020 to 2035
  • Table 30: Western Europe Market Volume (Units) Forecast by End-User Industry, 2020 to 2035
  • Table 31: Western Europe Market Value (USD Bn) Forecast by Propulsion Type, 2020 to 2035
  • Table 32: Western Europe Market Volume (Units) Forecast by Propulsion Type, 2020 to 2035
  • Table 33: East Asia Market Value (USD Bn) Forecast by Country, 2020 to 2035
  • Table 34: East Asia Market Volume (Units) Forecast by Country, 2020 to 2035
  • Table 35: East Asia Market Value (USD Bn) Forecast by Product Type, 2020 to 2035
  • Table 36: East Asia Market Volume (Units) Forecast by Product Type, 2020 to 2035
  • Table 37: East Asia Market Value (USD Bn) Forecast by End-User Industry, 2020 to 2035
  • Table 38: East Asia Market Volume (Units) Forecast by End-User Industry, 2020 to 2035
  • Table 39: East Asia Market Value (USD Bn) Forecast by Propulsion Type, 2020 to 2035
  • Table 40: East Asia Market Volume (Units) Forecast by Propulsion Type, 2020 to 2035
  • Table 41: South Asia Pacific Market Value (USD Bn) Forecast by Country, 2020 to 2035
  • Table 42: South Asia Pacific Market Volume (Units) Forecast by Country, 2020 to 2035
  • Table 43: South Asia Pacific Market Value (USD Bn) Forecast by Product Type, 2020 to 2035
  • Table 44: South Asia Pacific Market Volume (Units) Forecast by Product Type, 2020 to 2035
  • Table 45: South Asia Pacific Market Value (USD Bn) Forecast by End-User Industry, 2020 to 2035
  • Table 46: South Asia Pacific Market Volume (Units) Forecast by End-User Industry, 2020 to 2035
  • Table 47: South Asia Pacific Market Value (USD Bn) Forecast by Propulsion Type, 2020 to 2035
  • Table 48: South Asia Pacific Market Volume (Units) Forecast by Propulsion Type, 2020 to 2035
  • Table 49: Eastern Europe Market Value (USD Bn) Forecast by Country, 2020 to 2035
  • Table 50: Eastern Europe Market Volume (Units) Forecast by Country, 2020 to 2035
  • Table 51: Eastern Europe Market Value (USD Bn) Forecast by Product Type, 2020 to 2035
  • Table 52: Eastern Europe Market Volume (Units) Forecast by Product Type, 2020 to 2035
  • Table 53: Eastern Europe Market Value (USD Bn) Forecast by End-User Industry, 2020 to 2035
  • Table 54: Eastern Europe Market Volume (Units) Forecast by End-User Industry, 2020 to 2035
  • Table 55: Eastern Europe Market Value (USD Bn) Forecast by Propulsion Type, 2020 to 2035
  • Table 56: Eastern Europe Market Volume (Units) Forecast by Propulsion Type, 2020 to 2035
  • Table 57: Middle East & Africa Market Value (USD Bn) Forecast by Country, 2020 to 2035
  • Table 58: Middle East & Africa Market Volume (Units) Forecast by Country, 2020 to 2035
  • Table 59: Middle East & Africa Market Value (USD Bn) Forecast by Product Type, 2020 to 2035
  • Table 60: Middle East & Africa Market Volume (Units) Forecast by Product Type, 2020 to 2035
  • Table 61: Middle East & Africa Market Value (USD Bn) Forecast by End-User Industry, 2020 to 2035
  • Table 62: Middle East & Africa Market Volume (Units) Forecast by End-User Industry, 2020 to 2035
  • Table 63: Middle East & Africa Market Value (USD Bn) Forecast by Propulsion Type, 2020 to 2035
  • Table 64: Middle East & Africa Market Volume (Units) Forecast by Propulsion Type, 2020 to 2035

List Of Figures

  • Figure 1: Global Market Volume (Units) Forecast 2020 to 2035
  • Figure 2: Global Market Pricing Analysis
  • Figure 3: Global Market Value (USD Bn) Forecast 2020 to 2035
  • Figure 4: Global Market Value Share and BPS Analysis by Product Type, 2025 and 2035
  • Figure 5: Global Market Y-o-Y Growth Comparison by Product Type, 2025 to 2035
  • Figure 6: Global Market Attractiveness Analysis by Product Type
  • Figure 7: Global Market Value Share and BPS Analysis by End-User Industry, 2025 and 2035
  • Figure 8: Global Market Y-o-Y Growth Comparison by End-User Industry, 2025 to 2035
  • Figure 9: Global Market Attractiveness Analysis by End-User Industry
  • Figure 10: Global Market Value Share and BPS Analysis by Propulsion Type, 2025 and 2035
  • Figure 11: Global Market Y-o-Y Growth Comparison by Propulsion Type, 2025 to 2035
  • Figure 12: Global Market Attractiveness Analysis by Propulsion Type
  • Figure 13: Global Market Value (USD Bn) Share and BPS Analysis by Region, 2025 and 2035
  • Figure 14: Global Market Y-o-Y Growth Comparison by Region, 2025 to 2035
  • Figure 15: Global Market Attractiveness Analysis by Region
  • Figure 16: North America Market Incremental $ Opportunity, 2025 to 2035
  • Figure 17: Latin America Market Incremental $ Opportunity, 2025 to 2035
  • Figure 18: Western Europe Market Incremental $ Opportunity, 2025 to 2035
  • Figure 19: East Asia Market Incremental $ Opportunity, 2025 to 2035
  • Figure 20: South Asia Pacific Market Incremental $ Opportunity, 2025 to 2035
  • Figure 21: Eastern Europe Market Incremental $ Opportunity, 2025 to 2035
  • Figure 22: Middle East & Africa Market Incremental $ Opportunity, 2025 to 2035
  • Figure 23: North America Market Value Share and BPS Analysis by Country, 2025 and 2035
  • Figure 24: North America Market Value Share and BPS Analysis by Product Type, 2025 and 2035
  • Figure 25: North America Market Y-o-Y Growth Comparison by Product Type, 2025 to 2035
  • Figure 26: North America Market Attractiveness Analysis by Product Type
  • Figure 27: North America Market Value Share and BPS Analysis by End-User Industry, 2025 and 2035
  • Figure 28: North America Market Y-o-Y Growth Comparison by End-User Industry, 2025 to 2035
  • Figure 29: North America Market Attractiveness Analysis by End-User Industry
  • Figure 30: North America Market Value Share and BPS Analysis by Propulsion Type, 2025 and 2035
  • Figure 31: North America Market Y-o-Y Growth Comparison by Propulsion Type, 2025 to 2035
  • Figure 32: North America Market Attractiveness Analysis by Propulsion Type
  • Figure 33: Latin America Market Value Share and BPS Analysis by Country, 2025 and 2035
  • Figure 34: Latin America Market Value Share and BPS Analysis by Product Type, 2025 and 2035
  • Figure 35: Latin America Market Y-o-Y Growth Comparison by Product Type, 2025 to 2035
  • Figure 36: Latin America Market Attractiveness Analysis by Product Type
  • Figure 37: Latin America Market Value Share and BPS Analysis by End-User Industry, 2025 and 2035
  • Figure 38: Latin America Market Y-o-Y Growth Comparison by End-User Industry, 2025 to 2035
  • Figure 39: Latin America Market Attractiveness Analysis by End-User Industry
  • Figure 40: Latin America Market Value Share and BPS Analysis by Propulsion Type, 2025 and 2035
  • Figure 41: Latin America Market Y-o-Y Growth Comparison by Propulsion Type, 2025 to 2035
  • Figure 42: Latin America Market Attractiveness Analysis by Propulsion Type
  • Figure 43: Western Europe Market Value Share and BPS Analysis by Country, 2025 and 2035
  • Figure 44: Western Europe Market Value Share and BPS Analysis by Product Type, 2025 and 2035
  • Figure 45: Western Europe Market Y-o-Y Growth Comparison by Product Type, 2025 to 2035
  • Figure 46: Western Europe Market Attractiveness Analysis by Product Type
  • Figure 47: Western Europe Market Value Share and BPS Analysis by End-User Industry, 2025 and 2035
  • Figure 48: Western Europe Market Y-o-Y Growth Comparison by End-User Industry, 2025 to 2035
  • Figure 49: Western Europe Market Attractiveness Analysis by End-User Industry
  • Figure 50: Western Europe Market Value Share and BPS Analysis by Propulsion Type, 2025 and 2035
  • Figure 51: Western Europe Market Y-o-Y Growth Comparison by Propulsion Type, 2025 to 2035
  • Figure 52: Western Europe Market Attractiveness Analysis by Propulsion Type
  • Figure 53: East Asia Market Value Share and BPS Analysis by Country, 2025 and 2035
  • Figure 54: East Asia Market Value Share and BPS Analysis by Product Type, 2025 and 2035
  • Figure 55: East Asia Market Y-o-Y Growth Comparison by Product Type, 2025 to 2035
  • Figure 56: East Asia Market Attractiveness Analysis by Product Type
  • Figure 57: East Asia Market Value Share and BPS Analysis by End-User Industry, 2025 and 2035
  • Figure 58: East Asia Market Y-o-Y Growth Comparison by End-User Industry, 2025 to 2035
  • Figure 59: East Asia Market Attractiveness Analysis by End-User Industry
  • Figure 60: East Asia Market Value Share and BPS Analysis by Propulsion Type, 2025 and 2035
  • Figure 61: East Asia Market Y-o-Y Growth Comparison by Propulsion Type, 2025 to 2035
  • Figure 62: East Asia Market Attractiveness Analysis by Propulsion Type
  • Figure 63: South Asia Pacific Market Value Share and BPS Analysis by Country, 2025 and 2035
  • Figure 64: South Asia Pacific Market Value Share and BPS Analysis by Product Type, 2025 and 2035
  • Figure 65: South Asia Pacific Market Y-o-Y Growth Comparison by Product Type, 2025 to 2035
  • Figure 66: South Asia Pacific Market Attractiveness Analysis by Product Type
  • Figure 67: South Asia Pacific Market Value Share and BPS Analysis by End-User Industry, 2025 and 2035
  • Figure 68: South Asia Pacific Market Y-o-Y Growth Comparison by End-User Industry, 2025 to 2035
  • Figure 69: South Asia Pacific Market Attractiveness Analysis by End-User Industry
  • Figure 70: South Asia Pacific Market Value Share and BPS Analysis by Propulsion Type, 2025 and 2035
  • Figure 71: South Asia Pacific Market Y-o-Y Growth Comparison by Propulsion Type, 2025 to 2035
  • Figure 72: South Asia Pacific Market Attractiveness Analysis by Propulsion Type
  • Figure 73: Eastern Europe Market Value Share and BPS Analysis by Country, 2025 and 2035
  • Figure 74: Eastern Europe Market Value Share and BPS Analysis by Product Type, 2025 and 2035
  • Figure 75: Eastern Europe Market Y-o-Y Growth Comparison by Product Type, 2025 to 2035
  • Figure 76: Eastern Europe Market Attractiveness Analysis by Product Type
  • Figure 77: Eastern Europe Market Value Share and BPS Analysis by End-User Industry, 2025 and 2035
  • Figure 78: Eastern Europe Market Y-o-Y Growth Comparison by End-User Industry, 2025 to 2035
  • Figure 79: Eastern Europe Market Attractiveness Analysis by End-User Industry
  • Figure 80: Eastern Europe Market Value Share and BPS Analysis by Propulsion Type, 2025 and 2035
  • Figure 81: Eastern Europe Market Y-o-Y Growth Comparison by Propulsion Type, 2025 to 2035
  • Figure 82: Eastern Europe Market Attractiveness Analysis by Propulsion Type
  • Figure 83: Middle East & Africa Market Value Share and BPS Analysis by Country, 2025 and 2035
  • Figure 84: Middle East & Africa Market Value Share and BPS Analysis by Product Type, 2025 and 2035
  • Figure 85: Middle East & Africa Market Y-o-Y Growth Comparison by Product Type, 2025 to 2035
  • Figure 86: Middle East & Africa Market Attractiveness Analysis by Product Type
  • Figure 87: Middle East & Africa Market Value Share and BPS Analysis by End-User Industry, 2025 and 2035
  • Figure 88: Middle East & Africa Market Y-o-Y Growth Comparison by End-User Industry, 2025 to 2035
  • Figure 89: Middle East & Africa Market Attractiveness Analysis by End-User Industry
  • Figure 90: Middle East & Africa Market Value Share and BPS Analysis by Propulsion Type, 2025 and 2035
  • Figure 91: Middle East & Africa Market Y-o-Y Growth Comparison by Propulsion Type, 2025 to 2035
  • Figure 92: Middle East & Africa Market Attractiveness Analysis by Propulsion Type
  • Figure 93: Global Market - Tier Structure Analysis
  • Figure 94: Global Market - Company Share Analysis

- FAQs -

What was the global aerial works platform market size reported by Fact.MR for 2025?

The global aerial works platform market was valued at USD 11.1 billion in 2025.

Who are the major players operating in the aerial works platform market?

Prominent players in the market are Terex Corporation, Oshkosh Corporation, Palfinger AG, IMER Group, Snorkel Lifts, and others.

What is the estimated valuation of the aerial works platform market in 2035?

The market is expected to reach a valuation of USD 20.3 billion in 2035.

What value CAGR did the aerial works platform market exhibit over the last five years?

The historic growth rate of the aerial works platform market was 5.8% from 2020-2024.

Aerial Work Platforms Market

Schedule a Call