Nafion Market

Nafion Market Analysis, By Form, By Application, and Region - Market Insights 2025 to 2035

Analysis Of Nafion Market Covering 30+ Countries Including Analysis Of US, Canada, UK, Germany, France, Nordics, GCC Countries, Japan, Korea And Many More

Nafion Market Outlook (2025 to 2035)

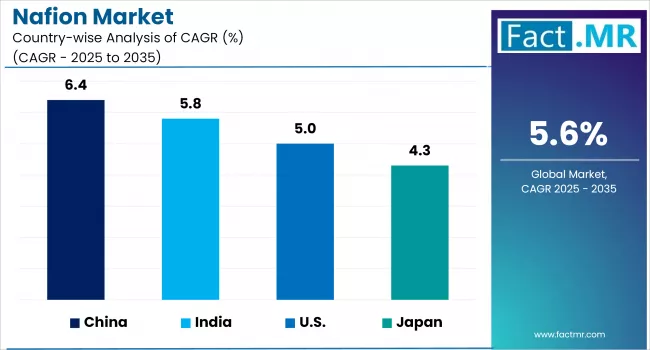
The global Nafion Market is projected to increase from USD 891.4 million in 2025 to USD 1,537.1 million by 2035, with a CAGR of 5.6%, driven by rising demand for proton exchange membranes in fuel cells, hydrogen electrolyzers, and redox flow batteries. Their use makes them ideal for applications requiring high ionic conductivity, chemical stability, and durability in fuel cells, hydrogen electrolyzers, and redox flow batteries.

Nafion Market Value (USD Million) 2025 To 2035

What are the Drivers of the Nafion Market?

The Nafion market is being driven by the growing adoption of clean energy, advancements in industrial technologies, and supportive regulatory frameworks aimed at decarbonization. A primary growth driver is the increasing global emphasis on hydrogen-based energy systems.

Nafion, renowned for its superior proton conductivity and chemical stability, is a crucial component in proton exchange membrane (PEM) fuel cells and water electrolysis technologies, which are central to the hydrogen economy.

As nations roll out hydrogen roadmaps to meet climate targets, demand for PEM electrolyzers has surged in Europe, Japan, and South Korea. For instance, the European Union’s Green Deal and Hydrogen Strategy aim to install at least 40 GW of renewable hydrogen electrolyzers by 2030, boosting Nafion consumption.

In addition to clean energy, the material’s application in the chlor-alkali industry, where it enables safer, mercury-free electrolysis, remains a solid contributor to the product demand. The ongoing transition to sustainable chemical manufacturing processes further supports this trend.

Moreover, Nafion’s role in redox flow batteries and advanced sensors is gaining traction amid growing interest in grid-scale energy storage and precision industrial monitoring. Alongside rising R&D investments and supply chain expansions by major players such as Chemours and Solvay, these factors continue to strengthen the Nafion market’s growth momentum.

What are the Regional Trends of the Nafion Market?

The Nafion market exhibits distinct regional dynamics, shaped by the pace of clean energy adoption, industrial infrastructure, and public investment in hydrogen and electrochemical technologies.

North America, the U.S., continues to be a significant market, driven by rising investments in hydrogen fuel cells and PEM electrolyze installations. The U.S. Department of Energy’s Hydrogen Program and the Inflation Reduction Act (IRA) have catalyzed interest in hydrogen production and storage technologies, where Nafion membranes play a crucial role.

Moreover, demand for sustainable chemical processing and the replacement of asbestos-based diaphragms in chlor-alkali plants further contribute to regional growth.

Europe remains at the forefront of the Nafion market due to ambitious decarbonization targets and strong policy support for green hydrogen. The EU’s Hydrogen Strategy and “Fit for 55” initiative have accelerated the rollout of electrolysis projects across Germany, France, and the Netherlands.

As a result, demand for high-performance ion-exchange membranes used in PEM electrolyzers and fuel cells is surging. Europe is also a hub for advanced battery research, which supports Nafion's use in redox flow batteries and energy storage systems.

Asia-Pacific, led by Japan, China, and South Korea, is witnessing rapid growth. Japan’s Strategic Roadmap for Hydrogen and Fuel Cells and South Korea’s Hydrogen Economy Roadmap are boosting the deployment of fuel cell electric vehicles (FCEVs) and hydrogen refueling stations. In China, the industrial-scale production of green hydrogen, backed by large state-owned enterprises, is driving up demand for high-performance membranes in electrochemical applications.

Additionally, the region’s robust electronics and semiconductor manufacturing base supports the use of Nafion in sensors and specialty coatings.

The rest of the World, including the Middle East and Latin America, is gradually emerging, with early-stage hydrogen infrastructure projects and rising interest in sustainable industrial technologies. Pilot initiatives in countries like Saudi Arabia (e.g., NEOM's green hydrogen plant) suggest potential long-term demand for Nafion membranes as the global hydrogen economy matures.

What are the Challenges and Restraining Factors of the Nafion Market?

Although demand for Nafion is rising in hydrogen technologies and electrochemical applications, several challenges still hinder the market from reaching its full potential.

One of the significant limitations is the high production cost of Nafion membranes. The complex fluoropolymer structure and energy-intensive manufacturing process make it substantially expensive than alternative ion-exchange materials. This cost barrier limits its scalability, particularly for emerging markets or cost-sensitive applications, such as large-scale hydrogen electrolysis, where economic feasibility is crucial.

Another constraint is the limited availability of raw materials used in the production of fluoropolymers. Nafion relies on perfluorinated compounds, which are subject to tight environmental and regulatory scrutiny due to their persistence and potential health risks. Increasing regulatory pressure in regions such as the European Union, which is considering broader restrictions on PFAS (per- and polyfluoroalkyl substances), could affect production capabilities and supply chains.

The market also faces performance trade-offs in high-temperature or long-cycle operations. Although Nafion provides excellent chemical resistance and ionic conductivity, its performance may deteriorate with extended exposure to high temperatures or dry conditions, key factors in high-efficiency fuel cell and electrolyzer operations. This has driven research into alternative or modified membranes that may compete with Nafion in certain use cases.

Furthermore, competition from emerging technologies poses a long-term challenge. Companies and research institutions are investing in next-generation membranes, such as those based on hydrocarbon or composite materials, that offer comparable performance at lower costs and with reduced environmental impact. These alternatives are gaining traction in pilot projects and could potentially displace Nafion in specific applications if scalability and durability improve.

The lack of standardized global hydrogen infrastructure also acts as a bottleneck. Nafion’s demand is closely linked to the pace of fuel cell adoption and electrolyzer deployment. In regions where hydrogen development remains fragmented or delayed due to policy uncertainty or inadequate investment, Nafion market growth may slow.

Country-Wise Outlook

U.S. Nafion Market Sees Growth Driven by Clean Energy and Industrial Applications

Nafion Market By Country

The U.S. is witnessing a steady increase in Nafion demand, largely driven by national efforts to accelerate the adoption of clean energy and modernize industrial infrastructure. With strong federal support through initiatives like the Inflation Reduction Act and the Department of Energy’s Hydrogen Program, investment in hydrogen production technologies, such as proton exchange membrane (PEM) electrolysis, is growing rapidly. Nafion, a critical component in these systems, is benefiting directly from this momentum.

Beyond hydrogen, the U.S. also relies on Nafion in established sectors such as chlor-alkali production, where it plays a key role in enabling safer, mercury-free electrolysis. Additionally, its application in advanced energy storage, particularly in redox flow batteries, is gaining traction due to the increasing need for grid-scale solutions that support the integration of renewable energy sources.

US Nafion Market Value (USD Million) 2025 To 2035

Several domestic research institutions and technology companies are also investing in R&D to improve membrane durability and performance, further reinforcing demand. The combination of robust policy backing, a mature chemical processing sector, and emerging clean tech infrastructure positions the U.S. as a significant contributor to growth within the global Nafion market.

China Strengthens Nafion Demand Through Hydrogen and Industrial Growth

China is rapidly emerging as a key growth driver in the global Nafion market, supported by its aggressive push toward hydrogen energy and industrial modernization. As a part of its national decarbonization strategy, China has launched several large-scale projects aimed at expanding hydrogen production capacity through proton exchange membrane (PEM) electrolyzers, where Nafion membranes are a core component.

State-owned energy giants and regional governments are investing heavily in green hydrogen infrastructure, particularly in provinces such as Inner Mongolia, Hebei, and Gansu. These developments are directly increasing the demand for advanced ion-exchange membranes with high chemical resistance and conductivity features that make Nafion a preferred choice.

Beyond energy, China’s massive chlor-alkali industry, which is transitioning from mercury-based to membrane-based technologies, further contributes to the consumption of Nafion. The country also maintains a strong electronics manufacturing base, where Nafion finds use in sensors, fuel cells, and other electrochemical components.

Additionally, Chinese companies are actively investing in domestic research and development (R&D) to reduce their reliance on imports and develop localized alternatives or complementary technologies. These initiatives, paired with supportive government policies and infrastructure investment, position China as a critical player in shaping the future trajectory of Nafion applications across clean energy and industrial sectors.

Japan Expands Nafion Applications Amid Hydrogen Push and Industrial Demand

Japan continues to advance its role in the Nafion market, propelled by the country's strong commitment to hydrogen energy and clean technology.

Under its Strategic Roadmap for Hydrogen and Fuel Cells, Japan is aggressively scaling up the deployment of PEM fuel cells, hydrogen refueling stations, and green hydrogen production facilities, all of which heavily rely on Nafion membranes for their high ion conductivity and chemical durability.

In addition to clean energy, Japan's well-established chemical and electronics industries contribute to consistent demand for Nafion in electrochemical applications such as chlor-alkali processing, specialty sensors, and battery separators. The material’s stability in harsh chemical environments makes it valuable across a range of industrial processes.

Leading Japanese firms are also investing in R&D for advanced membrane technologies, aiming to enhance efficiency and reduce costs in fuel cell systems and electrolyzers.

Furthermore, collaboration between Japanese corporations and international membrane suppliers is facilitating local integration of Nafion-based technologies into automotive and power generation systems.

Category-wise Analysis

Membrane to Exhibit Leading by Form

Nafion Market By Form

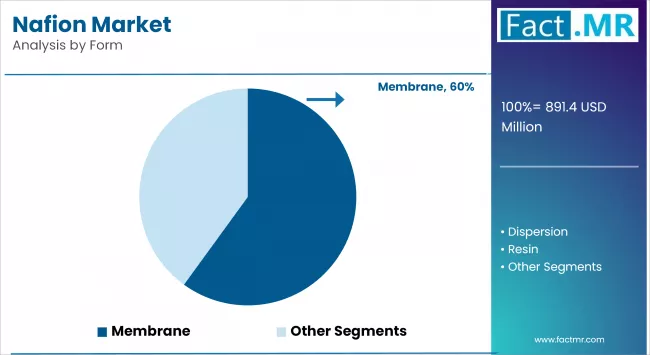
Nafion membranes hold the largest share in the market, primarily due to their vital role in high-efficiency electrochemical systems. These membranes are preferred for their exceptional proton conductivity, chemical stability, and mechanical strength —key characteristics required in demanding applications such as proton exchange membrane (PEM) fuel cells and water electrolysis. Their performance in hydrogen production and utilization systems has made them the industry standard for clean energy projects.

With the global rise in green hydrogen initiatives and decarbonization strategies, governments and corporations are increasingly deploying PEM-based technologies, which heavily rely on Nafion membranes.

In comparison to other forms, such as resins or dispersions, membranes offer the precision and structure required for consistent electrochemical performance in energy systems. Their role is also expanding into redox flow batteries and semiconductor manufacturing, reinforcing their dominance across sectors.

Energy to Exhibit Leading by Application

Nafion Market By Application

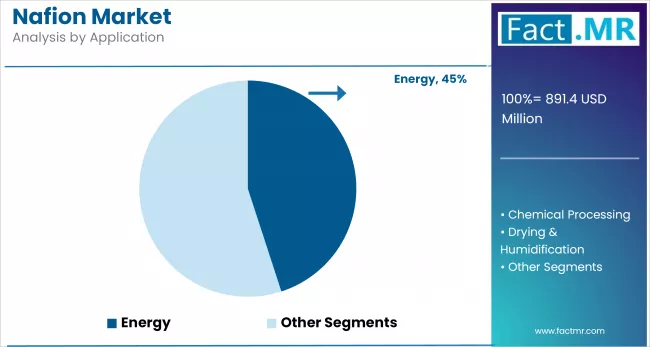
The energy sector is expected to continue dominating the Nafion demand due to its widespread use in fuel cells, electrolyzers, and stationary energy storage systems. Nafion’s function in enabling efficient hydrogen fuel cells used in fuel cell electric vehicles (FCEVs) and backup power systems is critical as countries commit to net-zero goals. In electrolyzers, Nafion membranes facilitate the separation of hydrogen and oxygen, playing a pivotal role in green hydrogen generation.

Public and private investments in the hydrogen economy bolster this demand. For instance, the U.S. Hydrogen Energy Earthshot, the EU Green Deal, and Japan’s Hydrogen Strategy all emphasize the deployment of PEM electrolyzers, where Nafion is a preferred membrane material.

Competitive Analysis

The Nafion market is becoming increasingly competitive, with a mix of global chemical giants and emerging regional players competing on the basis of product performance, innovation, and application-specific advancements. Leading companies such as The Chemours Company, Solvay SA, AGC Inc., and Dongyue Group Ltd. dominate the global supply of Nafion and related ion-exchange membranes.

These players have established strong manufacturing infrastructure, extensive R&D capabilities, and deep-rooted customer relationships across energy, electronics, and industrial chemical sectors. Their global reach and technical expertise continue to provide a competitive edge, especially in high-growth areas such as fuel cells and hydrogen technologies.

Strategic expansions, partnerships, and product diversification also play a critical role in shaping the Nafion market. Companies like AGC Inc. are broadening their fluoropolymer offerings to serve hydrogen infrastructure and industrial electrolysis applications. Meanwhile, Dongyue Group Ltd. is expanding production to meet the growing demand for PEM systems in China and abroad. These moves enable companies to penetrate new verticals and expand their presence in the fast-growing Asia-Pacific markets, where cost efficiency and local supply are key competitive factors.

Key players in the Nafion industry include The Chemours Company, Solvay SA, AGC Inc., Dongyue Group Ltd., and other regional and emerging manufacturers.

Recent Development

  • In May 2025, Chemours partnered with Navin Fluorine (India) to begin manufacturing Opteon two-phase immersion cooling fluid critical for high-powered AI/data-center cooling. This strategic collaboration addresses the growing demand for high-performance, sustainable, and cost-effective cooling solutions for data centers and AI hardware.
  • In June 2023, Solvay completed a 20% capacity expansion of its ACORGA® solvent extraction product line at its Mount Pleasant, Tennessee, facility. This expansion enhances Solvay's position in the mining industry, specifically in the production of reagents for copper solvent extraction (SX-EW) processes.

Segmentation of the Nafion Market

  • By Form :

    • Membrane
    • Resin
    • Dispersion
  • By Application :

    • Energy
      • Fuel Cells
      • Hydrogen Production
      • Energy Storage
    • Chemical Processing
      • Chlor Alkali
      • Catalysts
      • Ion Exchange
      • Semiconductors
      • Waste Recovery
      • Others
    • Drying & Humidification
      • Single Tubing Systems
      • Multi Tubing Systems
    • Others
  • By Region :

    • North America
    • Latin America
    • Western Europe
    • Eastern Europe
    • East Asia
    • South Asia & Pacific
    • Middle East & Africa

Table of Content

  1. Executive Summary
    • Global Market Outlook
    • Demand-side Trends
    • Supply-side Trends
    • Technology Roadmap Analysis
    • Analysis and Recommendations
  2. Market Overview
    • Market Coverage / Taxonomy
    • Market Definition / Scope / Limitations
  3. Market Background
    • Market Dynamics
      • Drivers
      • Restraints
      • Opportunity
      • Trends
    • Scenario Forecast
      • Demand in Optimistic Scenario
      • Demand in Likely Scenario
      • Demand in Conservative Scenario
    • Opportunity Map Analysis
    • Product Life Cycle Analysis
    • Supply Chain Analysis
      • Supply Side Participants and their Roles
        • Producers
        • Mid-Level Participants (Traders/ Agents/ Brokers)
        • Wholesalers and Distributors
      • Value Added and Value Created at Node in the Supply Chain
      • List of Raw Material Suppliers
      • List of Existing and Potential Buyers
    • Investment Feasibility Matrix
    • Value Chain Analysis
      • Profit Margin Analysis
      • Wholesalers and Distributors
      • Retailers
    • PESTLE and Porter’s Analysis
    • Regulatory Landscape
      • By Key Regions
      • By Key Countries
    • Production and Consumption Statistics
    • Import and Export Statistics
  4. Global Market Analysis 2020-2024 and Forecast, 2025-2035
    • Historical Market Size Value (USD Mn) & Volume (Tons) Analysis, 2020-2024
    • Current and Future Market Size Value (USD Mn) & Volume (Tons) Projections, 2025-2035
      • Y-o-Y Growth Trend Analysis
      • Absolute $ Opportunity Analysis
  5. Global Market Pricing Analysis 2020-2024 and Forecast 2025-2035
  6. Global Market Analysis 2020-2024 and Forecast 2025-2035, By Form
    • Introduction / Key Findings
    • Historical Market Size Value (USD Mn) & Volume (Tons) Analysis By Form, 2020-2024
    • Current and Future Market Size Value (USD Mn) & Volume (Tons) Analysis and Forecast By Form, 2025-2035
      • Membrane
      • Resin
      • Dispersion
    • Y-o-Y Growth Trend Analysis By Form, 2020-2024
    • Absolute $ Opportunity Analysis By Form, 2025-2035
  7. Global Market Analysis 2020-2024 and Forecast 2025-2035, By Application
    • Introduction / Key Findings
    • Historical Market Size Value (USD Mn) & Volume (Tons) Analysis By Application, 2020-2024
    • Current and Future Market Size Value (USD Mn) & Volume (Tons) Analysis and Forecast By Application, 2025-2035
      • Energy
        • Fuel Cells
        • Hydrogen Production
        • Energy Storage
      • Chemical Processing
        • Chlor Alkali
        • Catalysts
        • Ion Exchange
        • Semiconductors
        • Waste Recovery
        • Others
      • Drying & Humidification
        • Single
        • Multi
      • Others
    • Y-o-Y Growth Trend Analysis By Application, 2020-2024
    • Absolute $ Opportunity Analysis By Application, 2025-2035
  8. Global Market Analysis 2020-2024 and Forecast 2025-2035, By Region
    • Introduction
    • Historical Market Size Value (USD Mn) & Volume (Tons) Analysis By Region, 2020-2024
    • Current Market Size Value (USD Mn) & Volume (Tons) Analysis and Forecast By Region, 2025-2035
      • North America
      • Latin America
      • Western Europe
      • East Asia
      • South Asia Pacific
      • Eastern Europe
      • Middle East & Africa
    • Market Attractiveness Analysis By Region
  9. North America Market Analysis 2020-2024 and Forecast 2025-2035, By Country
    • Historical Market Size Value (USD Mn) & Volume (Tons) Trend Analysis By Market Taxonomy, 2020-2024
    • Market Size Value (USD Mn) & Volume (Tons) Forecast By Market Taxonomy, 2025-2035
      • By Country
        • U.S.
        • Canada
        • Mexico
      • By Form
      • By Application
    • Market Attractiveness Analysis
      • By Country
      • By Form
      • By Application
    • Key Takeaways
  10. Latin America Market Analysis 2020-2024 and Forecast 2025-2035, By Country
    • Historical Market Size Value (USD Mn) & Volume (Tons) Trend Analysis By Market Taxonomy, 2020-2024
    • Market Size Value (USD Mn) & Volume (Tons) Forecast By Market Taxonomy, 2025-2035
      • By Country
        • Brazil
        • Chile
        • Rest of Latin America
      • By Form
      • By Application
    • Market Attractiveness Analysis
      • By Country
      • By Form
      • By Application
    • Key Takeaways
  11. Western Europe Market Analysis 2020-2024 and Forecast 2025-2035, By Country
    • Historical Market Size Value (USD Mn) & Volume (Tons) Trend Analysis By Market Taxonomy, 2020-2024
    • Market Size Value (USD Mn) & Volume (Tons) Forecast By Market Taxonomy, 2025-2035
      • By Country
        • Germany
        • Italy
        • France
        • U.K.
        • Spain
        • Russia
        • BENELUX
        • Rest of Europe
      • By Form
      • By Application
    • Market Attractiveness Analysis
      • By Country
      • By Form
      • By Application
    • Key Takeaways
  12. East Asia Market Analysis 2020-2024 and Forecast 2025-2035, By Country
    • Historical Market Size Value (USD Mn) & Volume (Tons) Trend Analysis By Market Taxonomy, 2020-2024
    • Market Size Value (USD Mn) & Volume (Tons) Forecast By Market Taxonomy, 2025-2035
      • By Country
        • China
        • Japan
        • South Korea
      • By Form
      • By Application
    • Market Attractiveness Analysis
      • By Country
      • By Form
      • By Application
    • Key Takeaways
  13. South Asia Pacific Market Analysis 2020-2024 and Forecast 2025-2035, By Country
    • Historical Market Size Value (USD Mn) & Volume (Tons) Trend Analysis By Market Taxonomy, 2020-2024
    • Market Size Value (USD Mn) & Volume (Tons) Forecast By Market Taxonomy, 2025-2035
      • By Country
        • India
        • ASEAN Countries
        • Australia & New Zealand
        • Rest of South Asia Pacific
      • By Form
      • By Application
    • Market Attractiveness Analysis
      • By Country
      • By Form
      • By Application
    • Key Takeaways
  14. Eastern Europe Market Analysis 2020-2024 and Forecast 2025-2035, By Country
    • Historical Market Size Value (USD Mn) & Volume (Tons) Trend Analysis By Market Taxonomy, 2020-2024
    • Market Size Value (USD Mn) & Volume (Tons) Forecast By Market Taxonomy, 2025-2035
      • By Country
        • Russia
        • Poland
        • Hungary
        • Balkan & Baltics
        • Rest of Eastern Europe
      • By Form
      • By Application
    • Market Attractiveness Analysis
      • By Country
      • By Form
      • By Application
    • Key Takeaways
  15. Middle East & Africa Market Analysis 2020-2024 and Forecast 2025-2035, By Country
    • Historical Market Size Value (USD Mn) & Volume (Tons) Trend Analysis By Market Taxonomy, 2020-2024
    • Market Size Value (USD Mn) & Volume (Tons) Forecast By Market Taxonomy, 2025-2035
      • By Country
        • KSA
        • Other GCC Countries
        • Turkiye
        • South Africa
        • Rest of MEA
      • By Form
      • By Application
    • Market Attractiveness Analysis
      • By Country
      • By Form
      • By Application
    • Key Takeaways
  16. Key Countries Market Analysis
    • U.S.
      • Pricing Analysis
      • Market Share Analysis, 2024
        • By Form
        • By Application
    • Germany
      • Pricing Analysis
      • Market Share Analysis, 2024
        • By Form
        • By Application
    • Japan
      • Pricing Analysis
      • Market Share Analysis, 2024
        • By Form
        • By Application
    • South Korea
      • Pricing Analysis
      • Market Share Analysis, 2024
        • By Form
        • By Application
    • China
      • Pricing Analysis
      • Market Share Analysis, 2024
        • By Form
        • By Application
  17. Market Structure Analysis
    • Competition Dashboard
    • Competition Benchmarking
    • Market Share Analysis of Top Players
      • By Regional
      • By Form
      • By Application
  18. Competition Analysis
    • Competition Deep Dive
      • The Chemours Company
        • Overview
        • Product Portfolio
        • Profitability by Market Segments (Product/Age /Sales Channel/Region)
        • Sales Footprint
        • Strategy Overview
          • Marketing Strategy
          • Product Strategy
          • Channel Strategy
      • Solvay SA
        • Overview
        • Product Portfolio
        • Profitability by Market Segments (Product/Age /Sales Channel/Region)
        • Sales Footprint
        • Strategy Overview
          • Marketing Strategy
          • Product Strategy
          • Channel Strategy
      • AGC Inc.
        • Overview
        • Product Portfolio
        • Profitability by Market Segments (Product/Age /Sales Channel/Region)
        • Sales Footprint
        • Strategy Overview
          • Marketing Strategy
          • Product Strategy
          • Channel Strategy
      • Dongyue Group Ltd.
        • Overview
        • Product Portfolio
        • Profitability by Market Segments (Product/Age /Sales Channel/Region)
        • Sales Footprint
        • Strategy Overview
          • Marketing Strategy
          • Product Strategy
          • Channel Strategy
  19. Assumptions & Acronyms Used
  20. Research Methodology

List Of Table

  • Table 1: Global Market Value (USD Mn) Forecast by Region, 2020 to 2035
  • Table 2: Global Market Volume (Tons) Forecast by Region, 2020 to 2035
  • Table 3: Global Market Value (USD Mn) Forecast by Form, 2020 to 2035
  • Table 4: Global Market Volume (Tons) Forecast by Form, 2020 to 2035
  • Table 5: Global Market Value (USD Mn) Forecast by Application, 2020 to 2035
  • Table 6: Global Market Volume (Tons) Forecast by Application, 2020 to 2035
  • Table 7: North America Market Value (USD Mn) Forecast by Country, 2020 to 2035
  • Table 8: North America Market Volume (Tons) Forecast by Country, 2020 to 2035
  • Table 9: North America Market Value (USD Mn) Forecast by Form, 2020 to 2035
  • Table 10: North America Market Volume (Tons) Forecast by Form, 2020 to 2035
  • Table 11: North America Market Value (USD Mn) Forecast by Application, 2020 to 2035
  • Table 12: North America Market Volume (Tons) Forecast by Application, 2020 to 2035
  • Table 13: Latin America Market Value (USD Mn) Forecast by Country, 2020 to 2035
  • Table 14: Latin America Market Volume (Tons) Forecast by Country, 2020 to 2035
  • Table 15: Latin America Market Value (USD Mn) Forecast by Form, 2020 to 2035
  • Table 16: Latin America Market Volume (Tons) Forecast by Form, 2020 to 2035
  • Table 17: Latin America Market Value (USD Mn) Forecast by Application, 2020 to 2035
  • Table 18: Latin America Market Volume (Tons) Forecast by Application, 2020 to 2035
  • Table 19: Western Europe Market Value (USD Mn) Forecast by Country, 2020 to 2035
  • Table 20: Western Europe Market Volume (Tons) Forecast by Country, 2020 to 2035
  • Table 21: Western Europe Market Value (USD Mn) Forecast by Form, 2020 to 2035
  • Table 22: Western Europe Market Volume (Tons) Forecast by Form, 2020 to 2035
  • Table 23: Western Europe Market Value (USD Mn) Forecast by Application, 2020 to 2035
  • Table 24: Western Europe Market Volume (Tons) Forecast by Application, 2020 to 2035
  • Table 25: East Asia Market Value (USD Mn) Forecast by Country, 2020 to 2035
  • Table 26: East Asia Market Volume (Tons) Forecast by Country, 2020 to 2035
  • Table 27: East Asia Market Value (USD Mn) Forecast by Form, 2020 to 2035
  • Table 28: East Asia Market Volume (Tons) Forecast by Form, 2020 to 2035
  • Table 29: East Asia Market Value (USD Mn) Forecast by Application, 2020 to 2035
  • Table 30: East Asia Market Volume (Tons) Forecast by Application, 2020 to 2035
  • Table 31: South Asia Pacific Market Value (USD Mn) Forecast by Country, 2020 to 2035
  • Table 32: South Asia Pacific Market Volume (Tons) Forecast by Country, 2020 to 2035
  • Table 33: South Asia Pacific Market Value (USD Mn) Forecast by Form, 2020 to 2035
  • Table 34: South Asia Pacific Market Volume (Tons) Forecast by Form, 2020 to 2035
  • Table 35: South Asia Pacific Market Value (USD Mn) Forecast by Application, 2020 to 2035
  • Table 36: South Asia Pacific Market Volume (Tons) Forecast by Application, 2020 to 2035
  • Table 37: Eastern Europe Market Value (USD Mn) Forecast by Country, 2020 to 2035
  • Table 38: Eastern Europe Market Volume (Tons) Forecast by Country, 2020 to 2035
  • Table 39: Eastern Europe Market Value (USD Mn) Forecast by Form, 2020 to 2035
  • Table 40: Eastern Europe Market Volume (Tons) Forecast by Form, 2020 to 2035
  • Table 41: Eastern Europe Market Value (USD Mn) Forecast by Application, 2020 to 2035
  • Table 42: Eastern Europe Market Volume (Tons) Forecast by Application, 2020 to 2035
  • Table 43: Middle East & Africa Market Value (USD Mn) Forecast by Country, 2020 to 2035
  • Table 44: Middle East & Africa Market Volume (Tons) Forecast by Country, 2020 to 2035
  • Table 45: Middle East & Africa Market Value (USD Mn) Forecast by Form, 2020 to 2035
  • Table 46: Middle East & Africa Market Volume (Tons) Forecast by Form, 2020 to 2035
  • Table 47: Middle East & Africa Market Value (USD Mn) Forecast by Application, 2020 to 2035
  • Table 48: Middle East & Africa Market Volume (Tons) Forecast by Application, 2020 to 2035

List Of Figures

  • Figure 1: Global Market Volume (Tons) Forecast 2020 to 2035
  • Figure 2: Global Market Pricing Analysis
  • Figure 3: Global Market Value (USD Mn) Forecast 2020 to 2035
  • Figure 4: Global Market Value Share and BPS Analysis by Form, 2025 and 2035
  • Figure 5: Global Market Y-o-Y Growth Comparison by Form, 2025 to 2035
  • Figure 6: Global Market Attractiveness Analysis by Form
  • Figure 7: Global Market Value Share and BPS Analysis by Application, 2025 and 2035
  • Figure 8: Global Market Y-o-Y Growth Comparison by Application, 2025 to 2035
  • Figure 9: Global Market Attractiveness Analysis by Application
  • Figure 10: Global Market Value (USD Mn) Share and BPS Analysis by Region, 2025 and 2035
  • Figure 11: Global Market Y-o-Y Growth Comparison by Region, 2025 to 2035
  • Figure 12: Global Market Attractiveness Analysis by Region
  • Figure 13: North America Market Incremental $ Opportunity, 2025 to 2035
  • Figure 14: Latin America Market Incremental $ Opportunity, 2025 to 2035
  • Figure 15: Western Europe Market Incremental $ Opportunity, 2025 to 2035
  • Figure 16: East Asia Market Incremental $ Opportunity, 2025 to 2035
  • Figure 17: South Asia Pacific Market Incremental $ Opportunity, 2025 to 2035
  • Figure 18: Eastern Europe Market Incremental $ Opportunity, 2025 to 2035
  • Figure 19: Middle East & Africa Market Incremental $ Opportunity, 2025 to 2035
  • Figure 20: North America Market Value Share and BPS Analysis by Country, 2025 and 2035
  • Figure 21: North America Market Value Share and BPS Analysis by Form, 2025 and 2035
  • Figure 22: North America Market Y-o-Y Growth Comparison by Form, 2025 to 2035
  • Figure 23: North America Market Attractiveness Analysis by Form
  • Figure 24: North America Market Value Share and BPS Analysis by Application, 2025 and 2035
  • Figure 25: North America Market Y-o-Y Growth Comparison by Application, 2025 to 2035
  • Figure 26: North America Market Attractiveness Analysis by Application
  • Figure 27: Latin America Market Value Share and BPS Analysis by Country, 2025 and 2035
  • Figure 28: Latin America Market Value Share and BPS Analysis by Form, 2025 and 2035
  • Figure 29: Latin America Market Y-o-Y Growth Comparison by Form, 2025 to 2035
  • Figure 30: Latin America Market Attractiveness Analysis by Form
  • Figure 31: Latin America Market Value Share and BPS Analysis by Application, 2025 and 2035
  • Figure 32: Latin America Market Y-o-Y Growth Comparison by Application, 2025 to 2035
  • Figure 33: Latin America Market Attractiveness Analysis by Application
  • Figure 34: Western Europe Market Value Share and BPS Analysis by Country, 2025 and 2035
  • Figure 35: Western Europe Market Value Share and BPS Analysis by Form, 2025 and 2035
  • Figure 36: Western Europe Market Y-o-Y Growth Comparison by Form, 2025 to 2035
  • Figure 37: Western Europe Market Attractiveness Analysis by Form
  • Figure 38: Western Europe Market Value Share and BPS Analysis by Application, 2025 and 2035
  • Figure 39: Western Europe Market Y-o-Y Growth Comparison by Application, 2025 to 2035
  • Figure 40: Western Europe Market Attractiveness Analysis by Application
  • Figure 41: East Asia Market Value Share and BPS Analysis by Country, 2025 and 2035
  • Figure 42: East Asia Market Value Share and BPS Analysis by Form, 2025 and 2035
  • Figure 43: East Asia Market Y-o-Y Growth Comparison by Form, 2025 to 2035
  • Figure 44: East Asia Market Attractiveness Analysis by Form
  • Figure 45: East Asia Market Value Share and BPS Analysis by Application, 2025 and 2035
  • Figure 46: East Asia Market Y-o-Y Growth Comparison by Application, 2025 to 2035
  • Figure 47: East Asia Market Attractiveness Analysis by Application
  • Figure 48: South Asia Pacific Market Value Share and BPS Analysis by Country, 2025 and 2035
  • Figure 49: South Asia Pacific Market Value Share and BPS Analysis by Form, 2025 and 2035
  • Figure 50: South Asia Pacific Market Y-o-Y Growth Comparison by Form, 2025 to 2035
  • Figure 51: South Asia Pacific Market Attractiveness Analysis by Form
  • Figure 52: South Asia Pacific Market Value Share and BPS Analysis by Application, 2025 and 2035
  • Figure 53: South Asia Pacific Market Y-o-Y Growth Comparison by Application, 2025 to 2035
  • Figure 54: South Asia Pacific Market Attractiveness Analysis by Application
  • Figure 55: Eastern Europe Market Value Share and BPS Analysis by Country, 2025 and 2035
  • Figure 56: Eastern Europe Market Value Share and BPS Analysis by Form, 2025 and 2035
  • Figure 57: Eastern Europe Market Y-o-Y Growth Comparison by Form, 2025 to 2035
  • Figure 58: Eastern Europe Market Attractiveness Analysis by Form
  • Figure 59: Eastern Europe Market Value Share and BPS Analysis by Application, 2025 and 2035
  • Figure 60: Eastern Europe Market Y-o-Y Growth Comparison by Application, 2025 to 2035
  • Figure 61: Eastern Europe Market Attractiveness Analysis by Application
  • Figure 62: Middle East & Africa Market Value Share and BPS Analysis by Country, 2025 and 2035
  • Figure 63: Middle East & Africa Market Value Share and BPS Analysis by Form, 2025 and 2035
  • Figure 64: Middle East & Africa Market Y-o-Y Growth Comparison by Form, 2025 to 2035
  • Figure 65: Middle East & Africa Market Attractiveness Analysis by Form
  • Figure 66: Middle East & Africa Market Value Share and BPS Analysis by Application, 2025 and 2035
  • Figure 67: Middle East & Africa Market Y-o-Y Growth Comparison by Application, 2025 to 2035
  • Figure 68: Middle East & Africa Market Attractiveness Analysis by Application
  • Figure 69: Global Market -Tier Structure Analysis
  • Figure 70: Global Market - Company Share Analysis

- FAQs -

What is the Global Nafion Market Size in 2025?

The nafion market is valued at USD 891.4 million in 2025.

Who are the Major Players Operating in the Nafion Market?

Prominent players in the nafion market include The Chemours Company, Solvay SA, AGC Inc., Dongyue Group Ltd., and others.

What is the Estimated Valuation of the Nafion Market by 2035?

The nafion market is expected to reach a valuation of USD 1,537.1 million by 2035.

What Value CAGR Did the Nafion Market Exhibit over the Last Five Years?

The historic growth rate of the nafion market was 5.1% from 2020-2024.

Nafion Market

Schedule a Call