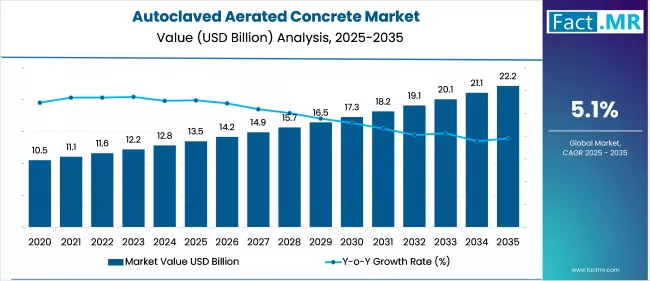
Autoclaved Aerated Concrete Market

Autoclaved Aerated Concrete Market Analysis, By Product Type, By Application, and Region - Market Insights 2025 to 2035

Analysis of Autoclaved Aerated Concrete Market Covering 30+ Countries Including Analysis of US, Canada, UK, Germany, France, Nordics, GCC countries, Japan, Korea and many more.

Autoclaved Aerated Concrete Market Outlook (2025 to 2035)

The global autoclaved aerated concrete market is projected to increase from USD 13.5 billion in 2025 to USD 22.2 billion by 2035, with a CAGR of 5.1%, driven by rising demand for sustainable construction solutions and the surge in global building and infrastructure projects. Their use makes them ideal for energy-efficient, lightweight, and fire-resistant structures in both residential and commercial construction.

Autoclaved Aerated Concrete Market

What are the drivers of Autoclaved Aerated Concrete Market?

The global transition to sustainable construction practices is a primary growth factor driving the autoclaved aerated concrete market growth. The industry is prioritizing the reduction of carbon footprints and enhancing energy efficiency as environmental concerns become increasingly important.

These green construction initiatives are perfectly aligned with AAC, which is renowned for its superior thermal insulation and reduced energy consumption during production. Moreover, the market is being further stimulated by the implementation of stringent regulations and the provision of incentives for the use of environmentally favorable materials by governments worldwide.

Another significant factor driving market growth is the increasing pace of urbanization, particularly in emerging economies. Efficient, cost-effective, and durable construction materials are crucial in the context of rapid urban development.

Autoclaved aerated concrete is well-suited for high-demand urban construction projects due to its lightweight nature, rapid installation process, and ease of handling. The demand for products in a variety of applications, including residential, commercial, and infrastructure projects, is being further fueled by the construction growth in countries such as China, India, and Brazil.

The market's expansion is also significantly influenced by technological advancements and innovations in manufacturing processes. The quality and efficiency of AAC manufacturing are improved by the development of advanced production techniques and apparatus, thereby making it more accessible and affordable.

Furthermore, the objective of ongoing research and development is to enhance the material properties of AAC, including the reduction of production costs and the enhancement of its strength. These advancements guarantee that AAC continues to compete with conventional building materials while providing superior advantages.

What are the regional trends of Autoclaved Aerated Concrete Market?

The regional trends in the autoclaved aerated concrete (AAC) market reveal distinct growth patterns across key global regions. Asia-Pacific stands out as the largest and most dynamic market, driven by rapid urbanization, infrastructure development, and a strong push for sustainable construction.

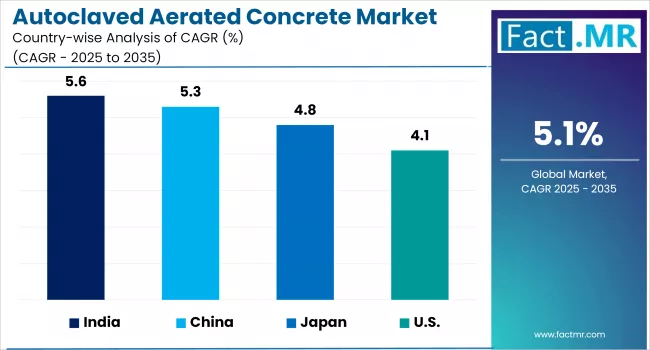
China dominates this region, holding a significant share due to its massive construction sector and government policies supporting green building materials. India is the fastest-growing market in the Asia-Pacific region, driven by government initiatives such as the Housing for All and Smart Cities Mission, as well as increasing urban demand for energy-efficient materials.

Europe is another major market, characterized by the mature adoption of AAC, especially in countries such as Germany, the U.K., Poland, and Russia. The region benefits from strict building codes that emphasize energy efficiency and sustainability, which support steady growth and widespread use in both commercial and residential construction.

North America exhibits steady market expansion, with the U.S. leading the way due to its resilient construction sector, increasing investments in infrastructure, and a growing emphasis on sustainable building practices. Technological advancements and stricter building regulations are further driving the adoption of AAC in the region.

In South America, Brazil is both the largest and fastest-growing market, driven by government-backed construction investments and a rising focus on affordable, sustainable housing. The region as a whole is experiencing increased adoption of AAC due to its energy efficiency and cost-saving benefits.

The Middle East & Africa region demonstrates strong growth potential, with Saudi Arabia leading in market size and Egypt in growth. Extensive construction activities, infrastructure development, and a growing focus on sustainable building practices are propelling AAC demand in this region.

What are the challenges and restraining factors of Autoclaved Aerated Concrete Market?

One of the primary challenges is the high initial investment required for setting up manufacturing facilities, which can be a significant barrier for new entrants, particularly in emerging regions. Additionally, there is limited awareness and resistance to change among builders, contractors, and consumers, especially in developing markets, which hinders the adoption of AAC products.

Logistical issues also pose a challenge, as the lightweight nature of AAC makes transportation over long distances less cost-effective. The cost of raw materials and the overall production cost of AAC blocks, which are higher compared to conventional cement or clay blocks, further restrain market growth.

Technical challenges such as water retention in autoclaved aerated concrete blocks leading to cracks and the material's brittle and porous nature can affect product reputation and limit its use in certain applications.

The lack of skilled labor and technical expertise in AAC construction, as well as competition from traditional building materials, are additional factors that restrain the market's expansion. Overall, the AAC market's growth is restrained by high capital requirements, limited market awareness, logistical and technical challenges, and competition from established construction materials.

Country-Wise Outlook

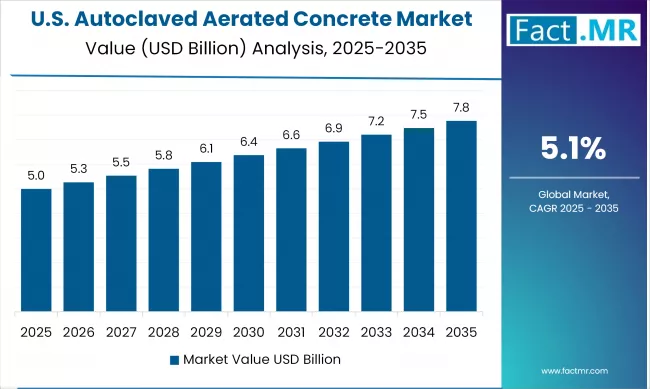
U.S. autoclaved aerated concrete market sees growth driven by energy efficiency and cost savings

Autoclaved Aerated Concrete Market Cagr Analysis By Country

The U.S. autoclaved aerated concrete (AAC) market is seeing significant growth, with a notable increase in demand for AAC panels. This trend is primarily driven by the panels’ excellent thermal insulation properties, which help reduce heat transfer through walls and maintain stable indoor temperatures.

Such energy efficiency is particularly attractive in regions with extreme climates, as it can lead to lower heating and cooling costs for buildings. As energy efficiency becomes a top priority for building owners and developers, AAC panels are increasingly favored as a sustainable building material.

United States Autoclaved Aerated Concrete Market Value Analysis 2025-2035

Their use aligns with broader market trends toward green construction, supported by government initiatives and green building councils that promote environmentally friendly materials.

Key players in the AAC market are engaging in collaborations to leverage manufacturing capabilities and regional expertise. For example, companies like Aercon AAC in the U.S. focus on meeting stringent building codes and sustainability guidelines through partnerships that provide technical assistance and engineering support to architects and contractors.

Globally, firms such as Xella Group are investing in automated technology and circular economy strategies, often collaborating with local manufacturers to expand their footprint and innovate product lines.

China witnesses rapid market growth backed by residential and infrastructure expansion

China is witnessing rapid growth in the autoclaved aerated concrete (AAC) market, primarily driven by the surge in demand for sustainable construction materials, accelerated urbanization, and a strong focus on energy efficiency. This expansion is fueled by government incentives, stricter building codes, and major investments in infrastructure projects, such as those in Shandong and Zhejiang provinces.

The Chinese government’s push for green, low-carbon buildings, highlighted by the National Development and Reform Commission’s 2024 goal to boost energy efficiency and reduce carbon emissions in construction by 2027, has further increased domestic demand for AAC blocks and panels.

Technological advancements in AAC manufacturing have enhanced product quality, durability, and fire resistance, making AAC an increasingly attractive choice for both residential and commercial construction. The market's growth is also supported by the need for affordable, lightweight, and energy-efficient materials to accommodate China’s rapidly urbanizing population and expanding real estate sector.

Japan witnesses rapid market growth due to a preference for lightweight, energy-efficient, and sustainable materials

Japan is witnessing rapid market growth, largely driven by rising demand for sustainable and energy-efficient construction materials. The Japan Housing Finance Agency (JHF) has also introduced Green Renovation Loans and participates in the green bond market to offer preferential financing for energy-saving housing projects.

These comprehensive measures are creating a robust ecosystem for sustainable construction, fostering innovation, and increasing demand for advanced materials such as AAC. The government has also issued climate transition bonds, known as "green govies," to finance green initiatives, including decarbonizing the building sector and promoting energy efficiency in housing and construction.

The Comprehensive Assessment System for Built Environment Efficiency (CASBEE) is a nationally recognized certification program that evaluates buildings based on environmental performance, use of eco-friendly materials, and integration with local communities. Achieving higher CASBEE ratings can unlock incentives such as grants and regulatory benefits for developers.

These initiatives, along with Japan’s active participation in international sustainability forums and conferences, are creating a supportive ecosystem for green innovation in construction, further driving demand for advanced materials like AAC.

Category-wise Analysis

Commercial construction to exhibit leading by application

Autoclaved Aerated Concrete Market Analysis By Application

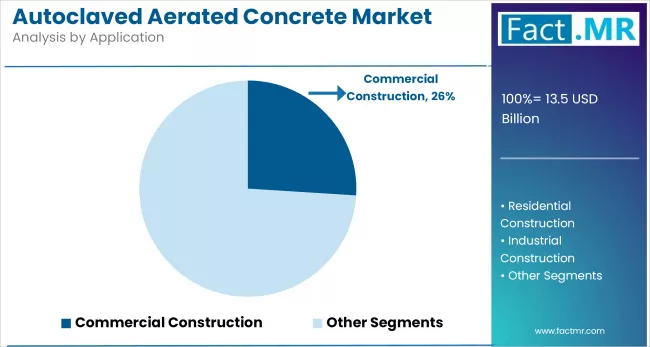
Residential construction is the dominant segment in the autoclaved aerated concrete market, owing to the material’s excellent thermal insulation, lightweight properties, and ease of installation. The increasing demand for energy-efficient and affordable housing, particularly in developing countries, has driven the widespread adoption of autoclaved aerated concrete blocks and panels.

Government initiatives promoting sustainable and green building materials further support the segment’s growth, as autoclaved aerated concrete offers a cost-effective solution for constructing durable, eco-friendly homes with reduced construction time and labor requirements.

Infrastructure construction is the fastest-growing segment in the autoclaved aerated concrete market, fueled by a surge in public infrastructure development projects across emerging economies. The use of autoclaved aerated concrete in bridges, roads, flyovers, and civic buildings is gaining traction due to its fire resistance, load-bearing capacity, and seismic resilience. As governments invest in smart cities and modernize infrastructure to meet environmental standards, AAC is increasingly preferred for its sustainability and long-term performance benefits, propelling rapid growth in this application area.

Blocks to exhibit leading by product type

Autoclaved Aerated Concrete Market Analysis By Product Type

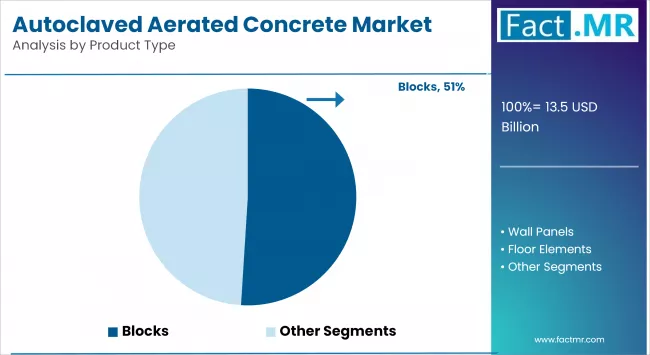
Blocks are the dominant product type in the autoclaved aerated concrete (AAC) market, widely used in residential, commercial, and industrial construction. Their lightweight nature, thermal insulation, and ease of handling make them ideal for non-load and load-bearing walls. AAC blocks significantly reduce construction time and costs while enhancing building energy efficiency. Their popularity is further driven by government incentives for green construction and increasing awareness around sustainable building practices, particularly in Asia-Pacific and Europe.

Wall panels are the fastest-growing segment due to rising demand for modular and prefabricated construction. AAC wall panels offer quick installation, structural strength, and excellent sound and fire insulation, making them suitable for high-rise buildings and large commercial structures. The shift toward faster project completion and reduced labor dependency is accelerating the adoption of wall panels. Additionally, their uniform quality and dimensional accuracy appeal to developers aiming for higher construction efficiency and sustainability in both urban and suburban projects.

Competitive Analysis

The global autoclaved aerated concrete market is becoming increasingly competitive, with a mix of established building material manufacturers, regional construction material suppliers, and emerging green technology players serving diverse construction sectors, including residential, commercial, and infrastructure.

This competitive environment is largely driven by innovation in lightweight materials, thermal and acoustic performance, faster installation methods, and sustainability-focused solutions. Companies offering enhanced product lines, such as prefabricated panels, energy-efficient blocks, and modular construction components, are gaining a distinct competitive advantage through strategic partnerships, mergers, and targeted product development.

To meet the growing demand for products, these organizations are focusing on expanding their production capacities, improving product quality, and developing advanced manufacturing processes. The market competition is also influenced by the increasing emphasis on energy efficiency and sustainability, which has prompted companies to develop and provide environmentally friendly solutions.

The expansion of production facilities is one of the primary strategies that manufacturers have implemented to meet the increasing demand. By investing in new facilities and upgrading existing ones, companies can increase their production capacities and guarantee a consistent supply of products to the market.

Key players in the autoclaved aerated concrete industry include Xella Group, H+H International, SOLBET, ACICO, Isoltech srl, Broco, Cematix, and other notable companies.

Recent Development

  • In July 2025, Star Cement Limited, a leader in the cement industry, launched its new product lines, Star AAC Blocks and Star Block Jointing Mortar. This move marks a significant advancement in the company’s commitment to innovative and sustainable construction materials.
  • In May 2025, BirlaNu Limited, a leading player in the building materials sector, commenced commercial production of Autoclaved Aerated Concrete (AAC) blocks at its Chennai facility. This expansion involved the commissioning of a second production line (Line 2) at the plant, effectively doubling the facility's manufacturing capabilities for AAC blocks.

Segmentation of Autoclaved Aerated Concrete Market

  • By Product Type :

    • Blocks
    • Wall Panels
    • Floor Elements
    • Cladding Panels
    • Lintels
    • Others
      • Beams & Lintels
      • Roof Panels
  • By Application :

    • Residential Construction
    • Industrial Construction
    • Commercial Construction
    • Infrastructure Construction
    • Others (Roof Insulation)
  • By Region :

    • North America
    • Latin America
    • Western Europe
    • Eastern Europe
    • East Asia
    • South Asia & Pacific
    • Middle East & Africa

Table of Content

  1. Executive Summary
    • Global Market Outlook
    • Demand-side Trends
    • Supply-side Trends
    • Technology Roadmap Analysis
    • Analysis and Recommendations
  2. Market Overview
    • Market Coverage / Taxonomy
    • Market Definition / Scope / Limitations
  3. Market Background
    • Market Dynamics
      • Drivers
      • Restraints
      • Opportunity
      • Trends
    • Scenario Forecast
      • Demand in Optimistic Scenario
      • Demand in Likely Scenario
      • Demand in Conservative Scenario
    • Opportunity Map Analysis
    • Product Life Cycle Analysis
    • Supply Chain Analysis
      • Supply Side Participants and their Roles
        • Producers
        • Mid-Level Participants (Traders/ Agents/ Brokers)
        • Wholesalers and Distributors
      • Value Added and Value Created at Node in the Supply Chain
      • List of Component Suppliers
      • List of Existing and Potential Buyers
    • Investment Feasibility Matrix
    • Value Chain Analysis
      • Profit Margin Analysis
      • Wholesalers and Distributors
      • Retailers
    • PESTLE and Porter’s Analysis
    • Regulatory Landscape
      • By Key Regions
      • By Key Countries
    • Production and Consumption Statistics
    • Import and Export Statistics
  4. Global Market Analysis 2020 to 2024 and Forecast, 2025 to 2035
    • Historical Market Size Value (USD Bn) & Volume (Cubic Meter) Analysis, 2020 to 2024
    • Current and Future Market Size Value (USD Bn) & Volume (Cubic Meter) Projections, 2025 to 2035
      • Y-o-Y Growth Trend Analysis
      • Absolute $ Opportunity Analysis
  5. Global Market Pricing Analysis 2020 to 2024 and Forecast 2025 to 2035
  6. Global Market Analysis 2020 to 2024 and Forecast 2025 to 2035, By Product Type
    • Introduction / Key Findings
    • Historical Market Size Value (USD Bn) & Volume (Cubic Meter) Analysis By Product Type, 2020 to 2024
    • Current and Future Market Size Value (USD Bn) & Volume (Cubic Meter) Analysis and Forecast By Product Type, 2025 to 2035
      • Blocks
      • Wall Panels
      • Floor Elements
      • Cladding Panels
      • Lintels
      • Others
        • Beams & Lintels
        • Roof Panels
    • Y-o-Y Growth Trend Analysis By Product Type, 2020 to 2024
    • Absolute $ Opportunity Analysis By Product Type, 2025 to 2035
  7. Global Market Analysis 2020 to 2024 and Forecast 2025 to 2035, By Application
    • Introduction / Key Findings
    • Historical Market Size Value (USD Bn) & Volume (Cubic Meter) Analysis By Application, 2020 to 2024
    • Current and Future Market Size Value (USD Bn) & Volume (Cubic Meter) Analysis and Forecast By Application, 2025 to 2035
      • Residential Construction
      • Industrial Construction
      • Commercial Construction
      • Infrastructure Construction
      • Others
    • Y-o-Y Growth Trend Analysis By Application, 2020 to 2024
    • Absolute $ Opportunity Analysis By Application, 2025 to 2035
  8. Global Market Analysis 2020 to 2024 and Forecast 2025 to 2035, By Region
    • Introduction
    • Historical Market Size Value (USD Bn) & Volume (Cubic Meter) Analysis By Region, 2020 to 2024
    • Current Market Size Value (USD Bn) & Volume (Cubic Meter) Analysis and Forecast By Region, 2025 to 2035
      • North America
      • Latin America
      • Western Europe
      • East Asia
      • South Asia Pacific
      • Eastern Europe
      • Middle East & Africa
    • Market Attractiveness Analysis By Region
  9. North America Market Analysis 2020 to 2024 and Forecast 2025 to 2035, By Country
    • Historical Market Size Value (USD Bn) & Volume (Cubic Meter) Trend Analysis By Market Taxonomy, 2020 to 2024
    • Market Size Value (USD Bn) & Volume (Cubic Meter) Forecast By Market Taxonomy, 2025 to 2035
      • By Country
        • U.S.
        • Canada
        • Mexico
      • By Product Type
      • By Application
    • Market Attractiveness Analysis
      • By Country
      • By Product Type
      • By Application
    • Key Takeaways
  10. Latin America Market Analysis 2020 to 2024 and Forecast 2025 to 2035, By Country
    • Historical Market Size Value (USD Bn) & Volume (Cubic Meter) Trend Analysis By Market Taxonomy, 2020 to 2024
    • Market Size Value (USD Bn) & Volume (Cubic Meter) Forecast By Market Taxonomy, 2025 to 2035
      • By Country
        • Brazil
        • Chile
        • Rest of Latin America
      • By Product Type
      • By Application
    • Market Attractiveness Analysis
      • By Country
      • By Product Type
      • By Application
    • Key Takeaways
  11. Western Europe Market Analysis 2020 to 2024 and Forecast 2025 to 2035, By Country
    • Historical Market Size Value (USD Bn) & Volume (Cubic Meter) Trend Analysis By Market Taxonomy, 2020 to 2024
    • Market Size Value (USD Bn) & Volume (Cubic Meter) Forecast By Market Taxonomy, 2025 to 2035
      • By Country
        • Germany
        • Italy
        • France
        • U.K.
        • Spain
        • Russia
        • BENELUX
        • Rest of Europe
      • By Product Type
      • By Application
    • Market Attractiveness Analysis
      • By Country
      • By Product Type
      • By Application
    • Key Takeaways
  12. East Asia Market Analysis 2020 to 2024 and Forecast 2025 to 2035, By Country
    • Historical Market Size Value (USD Bn) & Volume (Cubic Meter) Trend Analysis By Market Taxonomy, 2020 to 2024
    • Market Size Value (USD Bn) & Volume (Cubic Meter) Forecast By Market Taxonomy, 2025 to 2035
      • By Country
        • China
        • Japan
        • South Korea
      • By Product Type
      • By Application
    • Market Attractiveness Analysis
      • By Country
      • By Product Type
      • By Application
    • Key Takeaways
  13. South Asia Pacific Market Analysis 2020 to 2024 and Forecast 2025 to 2035, By Country
    • Historical Market Size Value (USD Bn) & Volume (Cubic Meter) Trend Analysis By Market Taxonomy, 2020 to 2024
    • Market Size Value (USD Bn) & Volume (Cubic Meter) Forecast By Market Taxonomy, 2025 to 2035
      • By Country
        • India
        • ASEAN Countries
        • Australia & New Zealand
        • Rest of South Asia Pacific
      • By Product Type
      • By Application
    • Market Attractiveness Analysis
      • By Country
      • By Product Type
      • By Application
    • Key Takeaways
  14. Eastern Europe Market Analysis 2020 to 2024 and Forecast 2025 to 2035, By Country
    • Historical Market Size Value (USD Bn) & Volume (Cubic Meter) Trend Analysis By Market Taxonomy, 2020 to 2024
    • Market Size Value (USD Bn) & Volume (Cubic Meter) Forecast By Market Taxonomy, 2025 to 2035
      • By Country
        • Russia
        • Poland
        • Hungary
        • Balkan & Baltics
        • Rest of Eastern Europe
      • By Product Type
      • By Application
    • Market Attractiveness Analysis
      • By Country
      • By Product Type
      • By Application
    • Key Takeaways
  15. Middle East & Africa Market Analysis 2020 to 2024 and Forecast 2025 to 2035, By Country
    • Historical Market Size Value (USD Bn) & Volume (Cubic Meter) Trend Analysis By Market Taxonomy, 2020 to 2024
    • Market Size Value (USD Bn) & Volume (Cubic Meter) Forecast By Market Taxonomy, 2025 to 2035
      • By Country
        • KSA
        • Other GCC Countries
        • Turkiye
        • South Africa
        • Rest of MEA
      • By Product Type
      • By Application
    • Market Attractiveness Analysis
      • By Country
      • By Product Type
      • By Application
    • Key Takeaways
  16. Key Countries Market Analysis
    • China
      • Pricing Analysis
      • Market Share Analysis, 2024
        • By Product Type
        • By Application
    • Germany
      • Pricing Analysis
      • Market Share Analysis, 2024
        • By Product Type
        • By Application
    • India
      • Pricing Analysis
      • Market Share Analysis, 2024
        • By Product Type
        • By Application
    • Value (USD Bn) & Volume (Cubic Meter)ed States
      • Pricing Analysis
      • Market Share Analysis, 2024
        • By Product Type
        • By Application
    • Poland
      • Pricing Analysis
      • Market Share Analysis, 2024
        • By Product Type
        • By Application
  17. Market Structure Analysis
    • Competition Dashboard
    • Competition Benchmarking
    • Market Share Analysis of Top Players
      • By Regional
      • By Product Type
      • By Application
  18. Competition Analysis
    • Competition Deep Dive
      • Xella Group
        • Overview
        • Product Portfolio
        • Profitability by Market Segments (Product/Age /Sales Channel/Region)
        • Sales Footprint
        • Strategy Overview
          • Marketing Strategy
          • Product Strategy
          • Channel Strategy
      • H+H International
        • Overview
        • Product Portfolio
        • Profitability by Market Segments (Product/Age /Sales Channel/Region)
        • Sales Footprint
        • Strategy Overview
          • Marketing Strategy
          • Product Strategy
          • Channel Strategy
      • SOLBET
        • Overview
        • Product Portfolio
        • Profitability by Market Segments (Product/Age /Sales Channel/Region)
        • Sales Footprint
        • Strategy Overview
          • Marketing Strategy
          • Product Strategy
          • Channel Strategy
      • ACICO
        • Overview
        • Product Portfolio
        • Profitability by Market Segments (Product/Age /Sales Channel/Region)
        • Sales Footprint
        • Strategy Overview
          • Marketing Strategy
          • Product Strategy
          • Channel Strategy
      • Isoltech srl
        • Overview
        • Product Portfolio
        • Profitability by Market Segments (Product/Age /Sales Channel/Region)
        • Sales Footprint
        • Strategy Overview
          • Marketing Strategy
          • Product Strategy
          • Channel Strategy
      • Broco
        • Overview
        • Product Portfolio
        • Profitability by Market Segments (Product/Age /Sales Channel/Region)
        • Sales Footprint
        • Strategy Overview
          • Marketing Strategy
          • Product Strategy
          • Channel Strategy
      • Cematix
        • Overview
        • Product Portfolio
        • Profitability by Market Segments (Product/Age /Sales Channel/Region)
        • Sales Footprint
        • Strategy Overview
          • Marketing Strategy
          • Product Strategy
          • Channel Strategy
  19. Assumptions & Acronyms Used
  20. Research Methodology

List Of Table

  • Table 1: Global Market Value (USD Bn) Forecast by Region, 2020 to 2035
  • Table 2: Global Market Volume (Cubic Meters) Forecast by Region, 2020 to 2035
  • Table 3: Global Market Value (USD Bn) Forecast by Product Type, 2020 to 2035
  • Table 4: Global Market Volume (Cubic Meters) Forecast by Product Type, 2020 to 2035
  • Table 5: Global Market Value (USD Bn) Forecast by Application, 2020 to 2035
  • Table 6: Global Market Volume (Cubic Meters) Forecast by Application, 2020 to 2035
  • Table 7: North America Market Value (USD Bn) Forecast by Country, 2020 to 2035
  • Table 8: North America Market Volume (Cubic Meters) Forecast by Country, 2020 to 2035
  • Table 9: North America Market Value (USD Bn) Forecast by Product Type, 2020 to 2035
  • Table 10: North America Market Volume (Cubic Meters) Forecast by Product Type, 2020 to 2035
  • Table 11: North America Market Value (USD Bn) Forecast by Application, 2020 to 2035
  • Table 12: North America Market Volume (Cubic Meters) Forecast by Application, 2020 to 2035
  • Table 13: Latin America Market Value (USD Bn) Forecast by Country, 2020 to 2035
  • Table 14: Latin America Market Volume (Cubic Meters) Forecast by Country, 2020 to 2035
  • Table 15: Latin America Market Value (USD Bn) Forecast by Product Type, 2020 to 2035
  • Table 16: Latin America Market Volume (Cubic Meters) Forecast by Product Type, 2020 to 2035
  • Table 17: Latin America Market Value (USD Bn) Forecast by Application, 2020 to 2035
  • Table 18: Latin America Market Volume (Cubic Meters) Forecast by Application, 2020 to 2035
  • Table 19: Western Europe Market Value (USD Bn) Forecast by Country, 2020 to 2035
  • Table 20: Western Europe Market Volume (Cubic Meters) Forecast by Country, 2020 to 2035
  • Table 21: Western Europe Market Value (USD Bn) Forecast by Product Type, 2020 to 2035
  • Table 22: Western Europe Market Volume (Cubic Meters) Forecast by Product Type, 2020 to 2035
  • Table 23: Western Europe Market Value (USD Bn) Forecast by Application, 2020 to 2035
  • Table 24: Western Europe Market Volume (Cubic Meters) Forecast by Application, 2020 to 2035
  • Table 25: East Asia Market Value (USD Bn) Forecast by Country, 2020 to 2035
  • Table 26: East Asia Market Volume (Cubic Meters) Forecast by Country, 2020 to 2035
  • Table 27: East Asia Market Value (USD Bn) Forecast by Product Type, 2020 to 2035
  • Table 28: East Asia Market Volume (Cubic Meters) Forecast by Product Type, 2020 to 2035
  • Table 29: East Asia Market Value (USD Bn) Forecast by Application, 2020 to 2035
  • Table 30: East Asia Market Volume (Cubic Meters) Forecast by Application, 2020 to 2035
  • Table 31: South Asia Pacific Market Value (USD Bn) Forecast by Country, 2020 to 2035
  • Table 32: South Asia Pacific Market Volume (Cubic Meters) Forecast by Country, 2020 to 2035
  • Table 33: South Asia Pacific Market Value (USD Bn) Forecast by Product Type, 2020 to 2035
  • Table 34: South Asia Pacific Market Volume (Cubic Meters) Forecast by Product Type, 2020 to 2035
  • Table 35: South Asia Pacific Market Value (USD Bn) Forecast by Application, 2020 to 2035
  • Table 36: South Asia Pacific Market Volume (Cubic Meters) Forecast by Application, 2020 to 2035
  • Table 37: Eastern Europe Market Value (USD Bn) Forecast by Country, 2020 to 2035
  • Table 38: Eastern Europe Market Volume (Cubic Meters) Forecast by Country, 2020 to 2035
  • Table 39: Eastern Europe Market Value (USD Bn) Forecast by Product Type, 2020 to 2035
  • Table 40: Eastern Europe Market Volume (Cubic Meters) Forecast by Product Type, 2020 to 2035
  • Table 41: Eastern Europe Market Value (USD Bn) Forecast by Application, 2020 to 2035
  • Table 42: Eastern Europe Market Volume (Cubic Meters) Forecast by Application, 2020 to 2035
  • Table 43: Middle East & Africa Market Value (USD Bn) Forecast by Country, 2020 to 2035
  • Table 44: Middle East & Africa Market Volume (Cubic Meters) Forecast by Country, 2020 to 2035
  • Table 45: Middle East & Africa Market Value (USD Bn) Forecast by Product Type, 2020 to 2035
  • Table 46: Middle East & Africa Market Volume (Cubic Meters) Forecast by Product Type, 2020 to 2035
  • Table 47: Middle East & Africa Market Value (USD Bn) Forecast by Application, 2020 to 2035
  • Table 48: Middle East & Africa Market Volume (Cubic Meters) Forecast by Application, 2020 to 2035

List Of Figures

  • Figure 1: Global Market Volume (Cubic Meter) Forecast 2020 to 2035
  • Figure 2: Global Market Pricing Analysis
  • Figure 3: Global Market Value (USD Bn) Forecast 2020 to 2035
  • Figure 4: Global Market Value Share and BPS Analysis by Product Type, 2025 and 2035
  • Figure 5: Global Market Y-o-Y Growth Comparison by Product Type, 2025 to 2035
  • Figure 6: Global Market Attractiveness Analysis by Product Type
  • Figure 7: Global Market Value Share and BPS Analysis by Application, 2025 and 2035
  • Figure 8: Global Market Y-o-Y Growth Comparison by Application, 2025 to 2035
  • Figure 9: Global Market Attractiveness Analysis by Application
  • Figure 10: Global Market Value (USD Bn) Share and BPS Analysis by Region, 2025 and 2035
  • Figure 11: Global Market Y-o-Y Growth Comparison by Region, 2025 to 2035
  • Figure 12: Global Market Attractiveness Analysis by Region
  • Figure 13: North America Market Incremental $ Opportunity, 2025 to 2035
  • Figure 14: Latin America Market Incremental $ Opportunity, 2025 to 2035
  • Figure 15: Western Europe Market Incremental $ Opportunity, 2025 to 2035
  • Figure 16: East Asia Market Incremental $ Opportunity, 2025 to 2035
  • Figure 17: South Asia Pacific Market Incremental $ Opportunity, 2025 to 2035
  • Figure 18: Eastern Europe Market Incremental $ Opportunity, 2025 to 2035
  • Figure 19: Middle East & Africa Market Incremental $ Opportunity, 2025 to 2035
  • Figure 20: North America Market Value Share and BPS Analysis by Country, 2025 and 2035
  • Figure 21: North America Market Value Share and BPS Analysis by Product Type, 2025 and 2035
  • Figure 22: North America Market Y-o-Y Growth Comparison by Product Type, 2025 to 2035
  • Figure 23: North America Market Attractiveness Analysis by Product Type
  • Figure 24: North America Market Value Share and BPS Analysis by Application, 2025 and 2035
  • Figure 25: North America Market Y-o-Y Growth Comparison by Application, 2025 to 2035
  • Figure 26: North America Market Attractiveness Analysis by Application
  • Figure 27: Latin America Market Value Share and BPS Analysis by Country, 2025 and 2035
  • Figure 28: Latin America Market Value Share and BPS Analysis by Product Type, 2025 and 2035
  • Figure 29: Latin America Market Y-o-Y Growth Comparison by Product Type, 2025 to 2035
  • Figure 30: Latin America Market Attractiveness Analysis by Product Type
  • Figure 31: Latin America Market Value Share and BPS Analysis by Application, 2025 and 2035
  • Figure 32: Latin America Market Y-o-Y Growth Comparison by Application, 2025 to 2035
  • Figure 33: Latin America Market Attractiveness Analysis by Application
  • Figure 34: Western Europe Market Value Share and BPS Analysis by Country, 2025 and 2035
  • Figure 35: Western Europe Market Value Share and BPS Analysis by Product Type, 2025 and 2035
  • Figure 36: Western Europe Market Y-o-Y Growth Comparison by Product Type, 2025 to 2035
  • Figure 37: Western Europe Market Attractiveness Analysis by Product Type
  • Figure 38: Western Europe Market Value Share and BPS Analysis by Application, 2025 and 2035
  • Figure 39: Western Europe Market Y-o-Y Growth Comparison by Application, 2025 to 2035
  • Figure 40: Western Europe Market Attractiveness Analysis by Application
  • Figure 41: East Asia Market Value Share and BPS Analysis by Country, 2025 and 2035
  • Figure 42: East Asia Market Value Share and BPS Analysis by Product Type, 2025 and 2035
  • Figure 43: East Asia Market Y-o-Y Growth Comparison by Product Type, 2025 to 2035
  • Figure 44: East Asia Market Attractiveness Analysis by Product Type
  • Figure 45: East Asia Market Value Share and BPS Analysis by Application, 2025 and 2035
  • Figure 46: East Asia Market Y-o-Y Growth Comparison by Application, 2025 to 2035
  • Figure 47: East Asia Market Attractiveness Analysis by Application
  • Figure 48: South Asia Pacific Market Value Share and BPS Analysis by Country, 2025 and 2035
  • Figure 49: South Asia Pacific Market Value Share and BPS Analysis by Product Type, 2025 and 2035
  • Figure 50: South Asia Pacific Market Y-o-Y Growth Comparison by Product Type, 2025 to 2035
  • Figure 51: South Asia Pacific Market Attractiveness Analysis by Product Type
  • Figure 52: South Asia Pacific Market Value Share and BPS Analysis by Application, 2025 and 2035
  • Figure 53: South Asia Pacific Market Y-o-Y Growth Comparison by Application, 2025 to 2035
  • Figure 54: South Asia Pacific Market Attractiveness Analysis by Application
  • Figure 55: Eastern Europe Market Value Share and BPS Analysis by Country, 2025 and 2035
  • Figure 56: Eastern Europe Market Value Share and BPS Analysis by Product Type, 2025 and 2035
  • Figure 57: Eastern Europe Market Y-o-Y Growth Comparison by Product Type, 2025 to 2035
  • Figure 58: Eastern Europe Market Attractiveness Analysis by Product Type
  • Figure 59: Eastern Europe Market Value Share and BPS Analysis by Application, 2025 and 2035
  • Figure 60: Eastern Europe Market Y-o-Y Growth Comparison by Application, 2025 to 2035
  • Figure 61: Eastern Europe Market Attractiveness Analysis by Application
  • Figure 62: Middle East & Africa Market Value Share and BPS Analysis by Country, 2025 and 2035
  • Figure 63: Middle East & Africa Market Value Share and BPS Analysis by Product Type, 2025 and 2035
  • Figure 64: Middle East & Africa Market Y-o-Y Growth Comparison by Product Type, 2025 to 2035
  • Figure 65: Middle East & Africa Market Attractiveness Analysis by Product Type
  • Figure 66: Middle East & Africa Market Value Share and BPS Analysis by Application, 2025 and 2035
  • Figure 67: Middle East & Africa Market Y-o-Y Growth Comparison by Application, 2025 to 2035
  • Figure 68: Middle East & Africa Market Attractiveness Analysis by Application
  • Figure 69: Global Market - Tier Structure Analysis
  • Figure 70: Global Market - Company Share Analysis

- FAQs -

What is the global autoclaved aerated concrete market size in 2025?

The autoclaved aerated concrete market is valued at USD 13.5 billion in 2025.

Who are the major players operating in the autoclaved aerated concrete market?

Prominent players in the market include Xella Group, H+H International, SOLBET, ACICO, Isoltech srl, Broco, and Cematix.

What is the estimated valuation of the autoclaved aerated concrete market by 2035?

The market is expected to reach a valuation of USD 22.2 billion by 2035.

What value CAGR is the autoclaved aerated concrete market exhibit over the last five years?

The growth rate of the autoclaved aerated concrete market is 4.3% from 2020 to 2024.

Autoclaved Aerated Concrete Market

Schedule a Call