Isopropyl Acetate Market
Isopropyl Acetate Market Analysis, By Grade, By Function, By Application, By End-User, and Region - Market Insights 2025 to 2035
Analysis Of Isopropyl Acetate Market Covering 30+ Countries Including Analysis Of US, Canada, UK, Germany, France, Nordics, GCC Countries, Japan, Korea And Many More
Isopropyl Acetate Market Outlook (2025 to 2035)
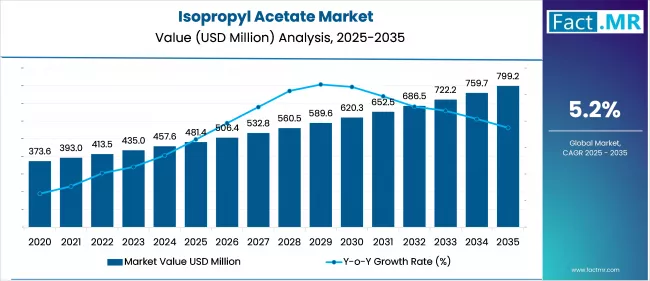
The global isopropyl acetate market is projected to increase from USD 481.4 million in 2025 to USD 799.2 million by 2035, with a CAGR of 5.2%, driven by growing demand from end-user industries, including automotive, pharmaceuticals, and personal care. Their use makes them ideal for applications requiring fast-evaporating, low-toxicity solvents and efficient intermediates in coatings, pharmaceuticals, and personal care formulations.
What are the Drivers of the Isopropyl Acetate Market?
The rising demand from the automotive industry is a primary driver of market growth. Automotive compounds and adhesives, which are essential for vehicle manufacturing and maintenance, are extensively used with isopropyl acetate.
The market for isopropyl acetate is expected to grow as the automotive industry continues to expand globally, driven by rising consumer demand and advancements in automotive technologies. This will result in a greater demand for high-quality coatings and adhesives.
Moreover, the shift toward electric vehicles (EVs) and the growing need for specialized adhesives and coatings are accelerating market growth. Additionally, the rapid expansion of the pharmaceutical industry serves as another key growth driver. It is an essential component of drug manufacturing because it is employed as a solvent in the synthesis of a variety of pharmaceutical compounds.
The demand for isopropyl acetate is expected to increase in proportion to the global pharmaceutical industry's significant development, which is attributed to the increasing prevalence of chronic diseases, increased healthcare spending, and advancements in medical research.
The demand for this solvent will be further strengthened by the ongoing research and development activities aimed at discovering new pharmaceuticals and formulations. The personal care industry also plays a significant role in shaping the market, as this compound is widely used in the formulation of cosmetics, fragrances, and personal care products due to its excellent solvent properties.
Manufacturers are increasingly incorporating isopropyl acetate into their formulations as consumer preferences transition toward high-quality, effective personal care products. The demand for isopropyl acetate is being fueled by the growth of the personal care products sector, driven by rising disposable incomes and increasing awareness of personal hygiene and sanitation.
What are the Regional Trends of Isopropyl Acetate Market?
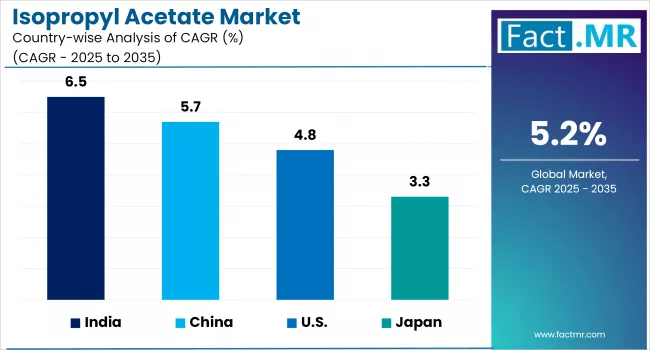
The regional trends of the market show that Asia Pacific dominates both consumption and production, driven by rapid industrialization and the expansion of end-user industries such as automotive, pharmaceuticals, and personal care, particularly in China and India.
This region is expected to register the highest growth rate due to favorable government policies, infrastructure development, and increasing demand in these sectors.
North America is a key market, supported by advanced pharmaceutical and personal care industries, as well as stringent regulatory standards that require high-quality solvents. The region's focus on innovation and the growth of the automotive sector, including electric vehicles, further boost demand for product.
Europe also holds a significant share, primarily due to its strong automotive and pharmaceutical sectors. The region's commitment to sustainability and environmental standards encourages the use of eco-friendly solvents like isopropyl acetate. Leading manufacturers and high consumer demand for quality personal care products further drive growth in Europe.
Latin America presents growth opportunities, particularly in Brazil and Mexico, where the expansion of automotive, construction, and packaging industries, combined with local manufacturing and raw material availability, fosters market development.
The Middle East & Africa region is expected to experience moderate growth, driven by increasing demand from the automotive, construction, and packaging industries, particularly in countries such as South Africa and Saudi Arabia, where industrial activities and vehicle ownership are on the rise.
What are the Challenges and Restraining Factors of the Isopropyl Acetate Market?
The market faces several key challenges and restraining factors. One of the primary issues is the volatility in raw material prices, particularly for isopropanol and acetic acid, both of which are influenced by fluctuations in crude oil prices, supply-demand dynamics, and geopolitical factors.
These price swings can significantly impact production costs and profit margins, creating uncertainty for manufacturers and complicating strategic planning. Another major restraint is the stringent environmental and safety regulations governing the production and use of isopropyl acetate.
Compliance with these regulations often requires investment in greener production methods and additional safety measures, which can increase operational costs and complexity for manufacturers.
The energy-intensive nature of the production process poses another challenge. The esterification reaction used to create isopropyl acetate consumes significant energy, and the process can lead to equipment corrosion and increased maintenance costs, further raising production expenses.
Additionally, the market faces competition from alternative solvents, as ongoing advancements in solvent technologies have led to the development of substitutes that may offer similar or better performance with fewer environmental concerns. This trend threatens the demand for isopropyl acetate in various applications.
Other restraining factors include health and safety concerns due to the flammable and potentially hazardous nature of isopropyl acetate, which can lead to stricter regulations and limit its use in certain industries. Additionally, supply chain disruptions can arise from global events or logistical issues, affecting the availability and cost of key raw materials.
The intense competition among established market players and high barriers to new entrants, due to regulatory and investment requirements, also pose significant challenges.
Country-Wise Outlook
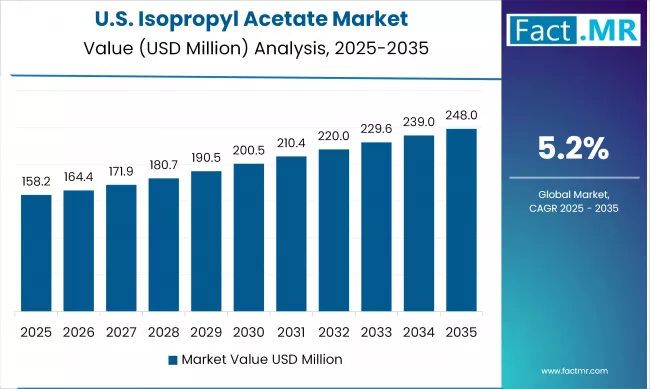
U.S. Market Sees Growth Driven by Growth in the Pharmaceutical Sector
The market is witnessing notable growth, primarily fueled by the robust automotive sector, expanding pharmaceutical and personal care applications, and a shift toward eco-friendly solvents. The presence of leading automotive manufacturers like GM, Tesla, and Ford drives demand for isopropyl acetate, especially in coatings used for OEM, refinishing, and coil applications.
Additionally, the compound’s use as a solvent in pharmaceuticals and its role in cosmetics and personal care products further boost market expansion. Regulatory emphasis on reducing volatile organic compound (VOC) emissions is prompting industries to adopt greener alternatives such as isopropyl acetate, supporting its rising adoption.
The market is seeing continued activity and expansion, particularly in the high purity segment, which is in demand for pharmaceutical and electronics applications. Major U.S. based manufacturers such as Monument Chemical and global suppliers like Dow and Honeywell continue to offer high-purity isopropyl acetate, supporting growth across automotive, pharmaceutical, paints and coatings, and personal care industries.
China Witnesses Rapid Market Growth Backed by Robust Manufacturing, Expanding End-User Industries, and Rising Domestic Demand
Isopropyl acetate is widely used in automotive coatings and adhesives, which are essential for both vehicle manufacturing and maintenance. The ongoing expansion of the automotive sector in China, including the shift towards electric vehicles and the need for specialized coatings, is a significant growth driver.
The chemical's versatility as a solvent extends to personal care products, paints, coatings, adhesives, and cleaning agents. China's fast-growing consumer markets and industrial base further support demand. The market is supported by the trend toward eco-friendly, low-VOC solvents, aligning with stricter environmental regulations and sustainability goals.
Rapid industrialization and favorable government policies in China are also contributing to the market's expansion, positioning the Asia Pacific region, with China at the forefront, to exhibit the highest compound annual growth rate in the coming years.
Multiple certified manufacturers, including Shandong Longze Chemical Co., Ltd. and Yujiang Chemical (Shandong) Co., Ltd., are actively promoting new batches and competitive pricing for 2025, with prices ranging from approximately USD 800 to USD 1100 per ton for bulk orders. These launches are targeted at industrial and pharmaceutical applications, underscoring the importance of quality and certification (ISO 9001, ISO 14001, etc.).
In addition, new supply from major producers like Hubei Seven Eight Nine Chemical and JIANYE offers isopropyl acetate with purities of up to 99.5% at competitive rates. This reflects a dynamic market with frequent new product availability and a focus on meeting both domestic and export demand.
Japan is Experiencing Notable Growth, Primarily Driven by the Increasing Demand From Key End-User
The integration of automation technologies and artificial intelligence in manufacturing processes is fueling market expansion. These advancements are improving production efficiency and product quality, which supports increased demand and market size growth in Japan.
The market is seeing robust growth due to increased demand from industries such as coatings and paints, pharmaceuticals, automotive, and personal care. Isopropyl acetate is widely used as a solvent in these sectors, particularly in coatings and adhesives for automotive manufacturing and in pharmaceutical synthesis.
The Asia-Pacific region, including Japan, is expected to experience the highest growth rates due to rapid industrialization, particularly in the construction and automotive sectors, as well as the presence of large manufacturing facilities.
Japanese manufacturers, such as SANKYO CHEMICAL CO., LTD., are active in this space, and suppliers like TCI Chemicals offer isopropyl acetate with purities above 99% for specialized uses. These advancements cater to the increasing regulatory and quality requirements in Japan’s major industries, ensuring that newly available isopropyl acetate products meet the evolving needs of the isopropyl acetate market.
Category-wise Analysis
>98% to Exhibit Leading by Grade
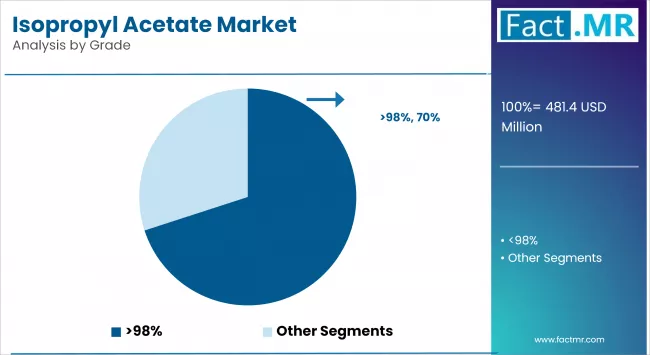
The >98% grade segment dominates the market in terms of revenue share, as it is preferred for high-performance applications where superior purity is crucial. Industries such as semiconductors, pharmaceuticals, and electronics rely heavily on this grade due to its consistent performance and minimal impurity levels.
The <98% grade segment is projected to grow at the fastest rate, driven by increasing adoption in cost-sensitive applications like personal care, packaging inks, and general coatings. While slightly lower in purity, it meets the functional requirements of several industries at a lower production cost, making it attractive for emerging markets.
Additive to Exhibit Leading by Function
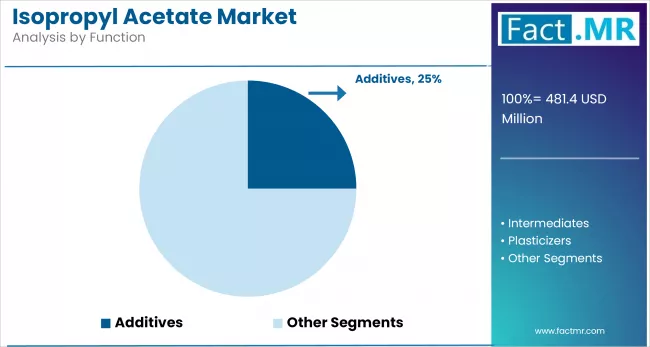
The additive segment holds the largest revenue share, as high-purity materials are widely used to enhance the performance of products in applications like coatings, plastics, and pharmaceuticals. Their ability to improve durability, stability, and functional properties makes them indispensable in many formulations.
Plasticizers are the fastest-growing segment, fueled by rising demand in flexible packaging, automotive interiors, and personal care products. These compounds offer improved elasticity and softness, making them essential in modern polymer-based products.
Automotive Industry to Exhibit Leading by Application
The automotive segment, particularly OEM coatings and plastics, leads in revenue share due to the increasing use of high-purity materials in vehicle parts, paints, and coatings. The increasing emphasis on durability, lightweight design, and emissions reduction continues to propel this demand.
The pharmaceutical segment is expected to witness the fastest growth, supported by stringent purity requirements and expanding global healthcare needs. High-purity compounds play a vital role in drug formulation, excipients, and coating applications, sustaining steady demand across the pharmaceutical industry.
Semiconductor & Electronics To Exhibit Leading by End-User
Semiconductors and electronics dominate the end-user segment due to the critical role of high-purity materials in chip fabrication, thin films, and electronic components. With continued miniaturization and innovation in devices, this segment remains a major revenue contributor.
Biotechnology is projected to grow at the fastest pace, driven by advances in genetic engineering, diagnostics, and biopharmaceutical production. The demand for contamination-free, high-purity inputs in bioprocessing is accelerating, particularly in emerging healthcare markets.
Competitive Analysis
The isopropyl acetate market is moderately competitive, featuring a mix of global chemical giants and regional players competing on the basis of product purity, sustainability, and application-specific performance. Companies such as Seqens SPS, Dow, Eastman Chemical Company, INEOS, Monument Chemical, Pidilite Industries Ltd., and Sankyo Chemical Co., Ltd. have established robust distribution networks, particularly across North America, Europe, and the Asia-Pacific region.
These players are recognized for providing a wide range of high-purity isopropyl acetate solutions specifically designed for use in the pharmaceutical, personal care, automotive, and coatings industries.
Market competitors are increasingly prioritizing sustainability and eco-friendly solutions. The global shift toward greener practices is encouraging companies to explore and produce environmentally friendly variants of isopropyl acetate that comply with stringent regulatory standards while enhancing product appeal. Collaborations with end-user industries to develop customized, application-specific solutions further strengthen the market position of leading firms by aligning with evolving customer and environmental expectations.
Key players in the isopropyl acetate industry include SEQENS SPS, DOW, Eastman Chemical Company, INEOS, Monument Chemical, Pidilite Industries Ltd., Sankyo Chemical Co., Ltd., and other notable companies.
Recent Development
- In March 2024, Japan's KH Neochem expanded its cleanroom solvent production line to cater to the increasing demand from domestic semiconductor and pharmaceutical companies. This expansion is a direct response to the growing need for specialty solvents in these industries, driven in part by local sourcing initiatives in East Asia.
(Source: https://datavagyanik.com/reports/isopropyl-acetate-market)
- In January 2024, Eastman Chemical announced plans to upgrade its purification units in Tennessee to manufacture ultra-high-purity isopropyl acetate, specifically targeting semiconductor manufacturers. This strategic initiative is designed to tap into the lucrative electronics sector, where the demand for exceptionally pure solvents is critical.
(Source: https://www.spglobal.com/commodity-insights/en/news-research/latest-news/chemicals/072624-eastmans-kingsport-tennessee- recycling-facility-operating-at-around-70-rates-ceo)
Segmentation of Isopropyl Acetate Market
-
By Grade :
- >98%
- <98%
-
By Function :
- Additive
- Intermediate
- Plasticizers
- Stabilizers
- Others
-
By Application :
- Printing Inks
- Automotive
- OEM Coatings
- Refinishes
- Plastics
- Architectural Coatings
- Wood Coatings
- Printing Inks
- Packaging Components & Inks
- Personal care ingredients
- Pharmaceuticals
- Cleaning Fluids
- Perfumes & Fragrances
- Others
-
By End-User :
- Semiconductor & Electronics
- Pharmaceuticals
- Biotechnology
- Food & Beverage Processing
- Chemical Processing
- Water Purification Systems
- Cosmetics Manufacturing
-
By Region :
- North America
- Latin America
- Western Europe
- Eastern Europe
- East Asia
- South Asia & Pacific
- Middle East & Africa
Table of Content
- Executive Summary
- Global Market Outlook
- Demand-side Trends
- Supply-side Trends
- Technology Roadmap Analysis
- Analysis and Recommendations
- Market Overview
- Market Coverage / Taxonomy
- Market Definition / Scope / Limitations
- Market Background
- Market Dynamics
- Drivers
- Restraints
- Opportunity
- Trends
- Scenario Forecast
- Demand in Optimistic Scenario
- Demand in Likely Scenario
- Demand in Conservative Scenario
- Opportunity Map Analysis
- Product Life Cycle Analysis
- Supply Chain Analysis
- Supply Side Participants and their Roles
- Producers
- Mid-Level Participants (Traders/ Agents/ Brokers)
- Wholesalers and Distributors
- Value Added and Value Created at Node in the Supply Chain
- List of Component Suppliers
- List of Existing and Potential Buyers
- Supply Side Participants and their Roles
- Investment Feasibility Matrix
- Value Chain Analysis
- Profit Margin Analysis
- Wholesalers and Distributors
- Retailers
- PESTLE and Porter’s Analysis
- Regulatory Landscape
- By Key Regions
- By Key Countries
- Production and Consumption Statistics
- Import and Export Statistics
- Market Dynamics
- Global Market Analysis 2020-2024 and Forecast, 2025-2035
- Historical Market Size Value (USD Mn) & Volume (Tons) Analysis, 2020-2024
- Current and Future Market Size Value (USD Mn) & Volume (Tons) Projections, 2025-2035
- Y-o-Y Growth Trend Analysis
- Absolute $ Opportunity Analysis
- Global Market Pricing Analysis 2020-2024 and Forecast 2025-2035
- Global Market Analysis 2020-2024 and Forecast 2025-2035, By Grade
- Introduction / Key Findings
- Historical Market Size Value (USD Mn) & Volume (Tons) Analysis By Grade, 2020-2024
- Current and Future Market Size Value (USD Mn) & Volume (Tons) Analysis and Forecast By Grade, 2025-2035
- >98%
- <98%
- Y-o-Y Growth Trend Analysis By Grade, 2020-2024
- Absolute $ Opportunity Analysis By Grade, 2025-2035
- Global Market Analysis 2020-2024 and Forecast 2025-2035, By Function
- Introduction / Key Findings
- Historical Market Size Value (USD Mn) & Volume (Tons) Analysis By Function, 2020-2024
- Current and Future Market Size Value (USD Mn) & Volume (Tons) Analysis and Forecast By Function, 2025-2035
- Additive
- Intermediate
- Plasticizers
- Stabilizers
- Others
- Y-o-Y Growth Trend Analysis By Function, 2020-2024
- Absolute $ Opportunity Analysis By Function, 2025-2035
- Global Market Analysis 2020-2024 and Forecast 2025-2035, By Application
- Introduction / Key Findings
- Historical Market Size Value (USD Mn) & Volume (Tons) Analysis By Application, 2020-2024
- Current and Future Market Size Value (USD Mn) & Volume (Tons) Analysis and Forecast By Application, 2025-2035
- Printing Inks
- Automotive
- OEM Coatings
- Refinishes
- Plastics
- Architectural Coatings
- Wood Coatings
- Packaging Components & Inks
- Personal Care Ingredients
- Pharmaceuticals
- Cleaning Fluids
- Perfumes & Fragrances
- Others
- Y-o-Y Growth Trend Analysis By Application, 2020-2024
- Absolute $ Opportunity Analysis By Application, 2025-2035
- Global Market Analysis 2020-2024 and Forecast 2025-2035, By End-User
- Introduction / Key Findings
- Historical Market Size Value (USD Mn) & Volume (Tons) Analysis By End-User, 2020-2024
- Current and Future Market Size Value (USD Mn) & Volume (Tons) Analysis and Forecast By End-User, 2025-2035
- Semiconductor & Electronics
- Pharmaceuticals
- Biotechnology
- Food & Beverage Processing
- Chemical Processing
- Water Purification Systems
- Cosmetics Manufacturing
- Y-o-Y Growth Trend Analysis By End-User, 2020-2024
- Absolute $ Opportunity Analysis By End-User, 2025-2035
- Global Market Analysis 2020-2024 and Forecast 2025-2035, By Region
- Introduction
- Historical Market Size Value (USD Mn) & Volume (Tons) Analysis By Region, 2020-2024
- Current Market Size Value (USD Mn) & Volume (Tons) Analysis and Forecast By Region, 2025-2035
- North America
- Latin America
- Western Europe
- East Asia
- South Asia Pacific
- Eastern Europe
- Middle East & Africa
- Market Attractiveness Analysis By Region
- North America Market Analysis 2020-2024 and Forecast 2025-2035, By Country
- Historical Market Size Value (USD Mn) & Volume (Tons) Trend Analysis By Market Taxonomy, 2020-2024
- Market Size Value (USD Mn) & Volume (Tons) Forecast By Market Taxonomy, 2025-2035
- By Country
- U.S.
- Canada
- Mexico
- By Grade
- By Function
- By Application
- By End-User
- By Country
- Market Attractiveness Analysis
- By Country
- By Grade
- By Function
- By Application
- By End-User
- Key Takeaways
- Latin America Market Analysis 2020-2024 and Forecast 2025-2035, By Country
- Historical Market Size Value (USD Mn) & Volume (Tons) Trend Analysis By Market Taxonomy, 2020-2024
- Market Size Value (USD Mn) & Volume (Tons) Forecast By Market Taxonomy, 2025-2035
- By Country
- Brazil
- Chile
- Rest of Latin America
- By Grade
- By Function
- By Application
- By End-User
- By Country
- Market Attractiveness Analysis
- By Country
- By Grade
- By Function
- By Application
- By End-User
- Key Takeaways
- Western Europe Market Analysis 2020-2024 and Forecast 2025-2035, By Country
- Historical Market Size Value (USD Mn) & Volume (Tons) Trend Analysis By Market Taxonomy, 2020-2024
- Market Size Value (USD Mn) & Volume (Tons) Forecast By Market Taxonomy, 2025-2035
- By Country
- Germany
- Italy
- France
- U.K.
- Spain
- Russia
- BENELUX
- Rest of Europe
- By Grade
- By Function
- By Application
- By End-User
- By Country
- Market Attractiveness Analysis
- By Country
- By Grade
- By Function
- By Application
- By End-User
- Key Takeaways
- East Asia Market Analysis 2020-2024 and Forecast 2025-2035, By Country
- Historical Market Size Value (USD Mn) & Volume (Tons) Trend Analysis By Market Taxonomy, 2020-2024
- Market Size Value (USD Mn) & Volume (Tons) Forecast By Market Taxonomy, 2025-2035
- By Country
- China
- Japan
- South Korea
- By Grade
- By Function
- By Application
- By End-User
- By Country
- Market Attractiveness Analysis
- By Country
- By Grade
- By Function
- By Application
- By End-User
- Key Takeaways
- South Asia Pacific Market Analysis 2020-2024 and Forecast 2025-2035, By Country
- Historical Market Size Value (USD Mn) & Volume (Tons) Trend Analysis By Market Taxonomy, 2020-2024
- Market Size Value (USD Mn) & Volume (Tons) Forecast By Market Taxonomy, 2025-2035
- By Country
- India
- ASEAN Countries
- Australia & New Zealand
- Rest of South Asia Pacific
- By Grade
- By Function
- By Application
- By End-User
- By Country
- Market Attractiveness Analysis
- By Country
- By Grade
- By Function
- By Application
- By End-User
- Key Takeaways
- Eastern Europe Market Analysis 2020-2024 and Forecast 2025-2035, By Country
- Historical Market Size Value (USD Mn) & Volume (Tons) Trend Analysis By Market Taxonomy, 2020-2024
- Market Size Value (USD Mn) & Volume (Tons) Forecast By Market Taxonomy, 2025-2035
- By Country
- Russia
- Poland
- Hungary
- Balkan & Baltics
- Rest of Eastern Europe
- By Grade
- By Function
- By Application
- By End-User
- By Country
- Market Attractiveness Analysis
- By Country
- By Grade
- By Function
- By Application
- By End-User
- Key Takeaways
- Middle East & Africa Market Analysis 2020-2024 and Forecast 2025-2035, By Country
- Historical Market Size Value (USD Mn) & Volume (Tons) Trend Analysis By Market Taxonomy, 2020-2024
- Market Size Value (USD Mn) & Volume (Tons) Forecast By Market Taxonomy, 2025-2035
- By Country
- KSA
- Other GCC Countries
- Turkiye
- South Africa
- Rest of MEA
- By Grade
- By Function
- By Application
- By End-User
- By Country
- Market Attractiveness Analysis
- By Country
- By Grade
- By Function
- By Application
- By End-User
- Key Takeaways
- Key Countries Market Analysis
- U.S.
- Pricing Analysis
- Market Share Analysis, 2024
- By Grade
- By Function
- By Application
- By End-User
- Germany
- Pricing Analysis
- Market Share Analysis, 2024
- By Grade
- By Function
- By Application
- By End-User
- Japan
- Pricing Analysis
- Market Share Analysis, 2024
- By Grade
- By Function
- By Application
- By End-User
- China
- Pricing Analysis
- Market Share Analysis, 2024
- By Grade
- By Function
- By Application
- By End-User
- India
- Pricing Analysis
- Market Share Analysis, 2024
- By Grade
- By Function
- By Application
- By End-User
- U.S.
- Market Structure Analysis
- Competition Dashboard
- Competition Benchmarking
- Market Share Analysis of Top Players
- By Regional
- By Grade
- By Function
- By Application
- By End-User
- Competition Analysis
- Competition Deep Dive
- SEQENS SPS
- Overview
- Product Portfolio
- Profitability by Market Segments (Product/Age /Sales Channel/Region)
- Sales Footprint
- Strategy Overview
- Marketing Strategy
- Product Strategy
- Channel Strategy
- DOW
- Overview
- Product Portfolio
- Profitability by Market Segments (Product/Age /Sales Channel/Region)
- Sales Footprint
- Strategy Overview
- Marketing Strategy
- Product Strategy
- Channel Strategy
- EASTMAN Chemical Company
- Overview
- Product Portfolio
- Profitability by Market Segments (Product/Age /Sales Channel/Region)
- Sales Footprint
- Strategy Overview
- Marketing Strategy
- Product Strategy
- Channel Strategy
- INEOS
- Overview
- Product Portfolio
- Profitability by Market Segments (Product/Age /Sales Channel/Region)
- Sales Footprint
- Strategy Overview
- Marketing Strategy
- Product Strategy
- Channel Strategy
- Monument Chemical
- Overview
- Product Portfolio
- Profitability by Market Segments (Product/Age /Sales Channel/Region)
- Sales Footprint
- Strategy Overview
- Marketing Strategy
- Product Strategy
- Channel Strategy
- Pidilite Industries Ltd.
- Overview
- Product Portfolio
- Profitability by Market Segments (Product/Age /Sales Channel/Region)
- Sales Footprint
- Strategy Overview
- Marketing Strategy
- Product Strategy
- Channel Strategy
- Sankyo Chemical Co., LTD.
- Overview
- Product Portfolio
- Profitability by Market Segments (Product/Age /Sales Channel/Region)
- Sales Footprint
- Strategy Overview
- Marketing Strategy
- Product Strategy
- Channel Strategy
- SEQENS SPS
- Competition Deep Dive
- Assumptions & Acronyms Used
- Research Methodology
List Of Table
- Table 1: Global Market Value (USD Mn) Forecast by Region, 2020 to 2035
- Table 2: Global Market Volume (Tons) Forecast by Region, 2020 to 2035
- Table 3: Global Market Value (USD Mn) Forecast by Grade, 2020 to 2035
- Table 4: Global Market Volume (Tons) Forecast by Grade, 2020 to 2035
- Table 5: Global Market Value (USD Mn) Forecast by Function, 2020 to 2035
- Table 6: Global Market Volume (Tons) Forecast by Function, 2020 to 2035
- Table 7: Global Market Value (USD Mn) Forecast by Application, 2020 to 2035
- Table 8: Global Market Volume (Tons) Forecast by Application, 2020 to 2035
- Table 9: Global Market Value (USD Mn) Forecast by End-User, 2020 to 2035
- Table 10: Global Market Volume (Tons) Forecast by End-User, 2020 to 2035
- Table 11: North America Market Value (USD Mn) Forecast by Country, 2020 to 2035
- Table 12: North America Market Volume (Tons) Forecast by Country, 2020 to 2035
- Table 13: North America Market Value (USD Mn) Forecast by Grade, 2020 to 2035
- Table 14: North America Market Volume (Tons) Forecast by Grade, 2020 to 2035
- Table 15: North America Market Value (USD Mn) Forecast by Function, 2020 to 2035
- Table 16: North America Market Volume (Tons) Forecast by Function, 2020 to 2035
- Table 17: North America Market Value (USD Mn) Forecast by Application, 2020 to 2035
- Table 18: North America Market Volume (Tons) Forecast by Application, 2020 to 2035
- Table 19: North America Market Value (USD Mn) Forecast by End-User, 2020 to 2035
- Table 20: North America Market Volume (Tons) Forecast by End-User, 2020 to 2035
- Table 21: Latin America Market Value (USD Mn) Forecast by Country, 2020 to 2035
- Table 22: Latin America Market Volume (Tons) Forecast by Country, 2020 to 2035
- Table 23: Latin America Market Value (USD Mn) Forecast by Grade, 2020 to 2035
- Table 24: Latin America Market Volume (Tons) Forecast by Grade, 2020 to 2035
- Table 25: Latin America Market Value (USD Mn) Forecast by Function, 2020 to 2035
- Table 26: Latin America Market Volume (Tons) Forecast by Function, 2020 to 2035
- Table 27: Latin America Market Value (USD Mn) Forecast by Application, 2020 to 2035
- Table 28: Latin America Market Volume (Tons) Forecast by Application, 2020 to 2035
- Table 29: Latin America Market Value (USD Mn) Forecast by End-User, 2020 to 2035
- Table 30: Latin America Market Volume (Tons) Forecast by End-User, 2020 to 2035
- Table 31: Western Europe Market Value (USD Mn) Forecast by Country, 2020 to 2035
- Table 32: Western Europe Market Volume (Tons) Forecast by Country, 2020 to 2035
- Table 33: Western Europe Market Value (USD Mn) Forecast by Grade, 2020 to 2035
- Table 34: Western Europe Market Volume (Tons) Forecast by Grade, 2020 to 2035
- Table 35: Western Europe Market Value (USD Mn) Forecast by Function, 2020 to 2035
- Table 36: Western Europe Market Volume (Tons) Forecast by Function, 2020 to 2035
- Table 37: Western Europe Market Value (USD Mn) Forecast by Application, 2020 to 2035
- Table 38: Western Europe Market Volume (Tons) Forecast by Application, 2020 to 2035
- Table 39: Western Europe Market Value (USD Mn) Forecast by End-User, 2020 to 2035
- Table 40: Western Europe Market Volume (Tons) Forecast by End-User, 2020 to 2035
- Table 41: East Asia Market Value (USD Mn) Forecast by Country, 2020 to 2035
- Table 42: East Asia Market Volume (Tons) Forecast by Country, 2020 to 2035
- Table 43: East Asia Market Value (USD Mn) Forecast by Grade, 2020 to 2035
- Table 44: East Asia Market Volume (Tons) Forecast by Grade, 2020 to 2035
- Table 45: East Asia Market Value (USD Mn) Forecast by Function, 2020 to 2035
- Table 46: East Asia Market Volume (Tons) Forecast by Function, 2020 to 2035
- Table 47: East Asia Market Value (USD Mn) Forecast by Application, 2020 to 2035
- Table 48: East Asia Market Volume (Tons) Forecast by Application, 2020 to 2035
- Table 49: East Asia Market Value (USD Mn) Forecast by End-User, 2020 to 2035
- Table 50: East Asia Market Volume (Tons) Forecast by End-User, 2020 to 2035
- Table 51: South Asia Pacific Market Value (USD Mn) Forecast by Country, 2020 to 2035
- Table 52: South Asia Pacific Market Volume (Tons) Forecast by Country, 2020 to 2035
- Table 53: South Asia Pacific Market Value (USD Mn) Forecast by Grade, 2020 to 2035
- Table 54: South Asia Pacific Market Volume (Tons) Forecast by Grade, 2020 to 2035
- Table 55: South Asia Pacific Market Value (USD Mn) Forecast by Function, 2020 to 2035
- Table 56: South Asia Pacific Market Volume (Tons) Forecast by Function, 2020 to 2035
- Table 57: South Asia Pacific Market Value (USD Mn) Forecast by Application, 2020 to 2035
- Table 58: South Asia Pacific Market Volume (Tons) Forecast by Application, 2020 to 2035
- Table 59: South Asia Pacific Market Value (USD Mn) Forecast by End-User, 2020 to 2035
- Table 60: South Asia Pacific Market Volume (Tons) Forecast by End-User, 2020 to 2035
- Table 61: Eastern Europe Market Value (USD Mn) Forecast by Country, 2020 to 2035
- Table 62: Eastern Europe Market Volume (Tons) Forecast by Country, 2020 to 2035
- Table 63: Eastern Europe Market Value (USD Mn) Forecast by Grade, 2020 to 2035
- Table 64: Eastern Europe Market Volume (Tons) Forecast by Grade, 2020 to 2035
- Table 65: Eastern Europe Market Value (USD Mn) Forecast by Function, 2020 to 2035
- Table 66: Eastern Europe Market Volume (Tons) Forecast by Function, 2020 to 2035
- Table 67: Eastern Europe Market Value (USD Mn) Forecast by Application, 2020 to 2035
- Table 68: Eastern Europe Market Volume (Tons) Forecast by Application, 2020 to 2035
- Table 69: Eastern Europe Market Value (USD Mn) Forecast by End-User, 2020 to 2035
- Table 70: Eastern Europe Market Volume (Tons) Forecast by End-User, 2020 to 2035
- Table 71: Middle East & Africa Market Value (USD Mn) Forecast by Country, 2020 to 2035
- Table 72: Middle East & Africa Market Volume (Tons) Forecast by Country, 2020 to 2035
- Table 73: Middle East & Africa Market Value (USD Mn) Forecast by Grade, 2020 to 2035
- Table 74: Middle East & Africa Market Volume (Tons) Forecast by Grade, 2020 to 2035
- Table 75: Middle East & Africa Market Value (USD Mn) Forecast by Function, 2020 to 2035
- Table 76: Middle East & Africa Market Volume (Tons) Forecast by Function, 2020 to 2035
- Table 77: Middle East & Africa Market Value (USD Mn) Forecast by Application, 2020 to 2035
- Table 78: Middle East & Africa Market Volume (Tons) Forecast by Application, 2020 to 2035
- Table 79: Middle East & Africa Market Value (USD Mn) Forecast by End-User, 2020 to 2035
- Table 80: Middle East & Africa Market Volume (Tons) Forecast by End-User, 2020 to 2035
List Of Figures
- Figure 1: Global Market Volume (Tons) Forecast 2020 to 2035
- Figure 2: Global Market Pricing Analysis
- Figure 3: Global Market Value (USD Mn) Forecast 2020 to 2035
- Figure 4: Global Market Value Share and BPS Analysis by Grade, 2025 to 2035
- Figure 5: Global Market Y-o-Y Growth Comparison by Grade, 2025 to 2035
- Figure 6: Global Market Attractiveness Analysis by Grade
- Figure 7: Global Market Value Share and BPS Analysis by Function, 2025 to 2035
- Figure 8: Global Market Y-o-Y Growth Comparison by Function, 2025 to 2035
- Figure 9: Global Market Attractiveness Analysis by Function
- Figure 10: Global Market Value Share and BPS Analysis by Application, 2025 to 2035
- Figure 11: Global Market Y-o-Y Growth Comparison by Application, 2025 to 2035
- Figure 12: Global Market Attractiveness Analysis by Application
- Figure 13: Global Market Value Share and BPS Analysis by End-User, 2025 to 2035
- Figure 14: Global Market Y-o-Y Growth Comparison by End-User, 2025 to 2035
- Figure 15: Global Market Attractiveness Analysis by End-User
- Figure 16: Global Market Value (USD Mn) Share and BPS Analysis by Region, 2025 to 2035
- Figure 17: Global Market Y-o-Y Growth Comparison by Region, 2025 to 2035
- Figure 18: Global Market Attractiveness Analysis by Region
- Figure 19: North America Market Incremental $ Opportunity, 2025 to 2035
- Figure 20: Latin America Market Incremental $ Opportunity, 2025 to 2035
- Figure 21: Western Europe Market Incremental $ Opportunity, 2025 to 2035
- Figure 22: East Asia Market Incremental $ Opportunity, 2025 to 2035
- Figure 23: South Asia Pacific Market Incremental $ Opportunity, 2025 to 2035
- Figure 24: Eastern Europe Market Incremental $ Opportunity, 2025 to 2035
- Figure 25: Middle East & Africa Market Incremental $ Opportunity, 2025 to 2035
- Figure 26: North America Market Value Share and BPS Analysis by Country, 2025 to 2035
- Figure 27: North America Market Value Share and BPS Analysis by Grade, 2025 to 2035
- Figure 28: North America Market Y-o-Y Growth Comparison by Grade, 2025 to 2035
- Figure 29: North America Market Attractiveness Analysis by Grade
- Figure 30: North America Market Value Share and BPS Analysis by Function, 2025 to 2035
- Figure 31: North America Market Y-o-Y Growth Comparison by Function, 2025 to 2035
- Figure 32: North America Market Attractiveness Analysis by Function
- Figure 33: North America Market Value Share and BPS Analysis by Application, 2025 to 2035
- Figure 34: North America Market Y-o-Y Growth Comparison by Application, 2025 to 2035
- Figure 35: North America Market Attractiveness Analysis by Application
- Figure 36: North America Market Value Share and BPS Analysis by End-User, 2025 to 2035
- Figure 37: North America Market Y-o-Y Growth Comparison by End-User, 2025 to 2035
- Figure 38: North America Market Attractiveness Analysis by End-User
- Figure 39: Latin America Market Value Share and BPS Analysis by Country, 2025 to 2035
- Figure 40: Latin America Market Value Share and BPS Analysis by Grade, 2025 to 2035
- Figure 41: Latin America Market Y-o-Y Growth Comparison by Grade, 2025 to 2035
- Figure 42: Latin America Market Attractiveness Analysis by Grade
- Figure 43: Latin America Market Value Share and BPS Analysis by Function, 2025 to 2035
- Figure 44: Latin America Market Y-o-Y Growth Comparison by Function, 2025 to 2035
- Figure 45: Latin America Market Attractiveness Analysis by Function
- Figure 46: Latin America Market Value Share and BPS Analysis by Application, 2025 to 2035
- Figure 47: Latin America Market Y-o-Y Growth Comparison by Application, 2025 to 2035
- Figure 48: Latin America Market Attractiveness Analysis by Application
- Figure 49: Latin America Market Value Share and BPS Analysis by End-User, 2025 to 2035
- Figure 50: Latin America Market Y-o-Y Growth Comparison by End-User, 2025 to 2035
- Figure 51: Latin America Market Attractiveness Analysis by End-User
- Figure 52: Western Europe Market Value Share and BPS Analysis by Country, 2025 to 2035
- Figure 53: Western Europe Market Value Share and BPS Analysis by Grade, 2025 to 2035
- Figure 54: Western Europe Market Y-o-Y Growth Comparison by Grade, 2025 to 2035
- Figure 55: Western Europe Market Attractiveness Analysis by Grade
- Figure 56: Western Europe Market Value Share and BPS Analysis by Function, 2025 to 2035
- Figure 57: Western Europe Market Y-o-Y Growth Comparison by Function, 2025 to 2035
- Figure 58: Western Europe Market Attractiveness Analysis by Function
- Figure 59: Western Europe Market Value Share and BPS Analysis by Application, 2025 to 2035
- Figure 60: Western Europe Market Y-o-Y Growth Comparison by Application, 2025 to 2035
- Figure 61: Western Europe Market Attractiveness Analysis by Application
- Figure 62: Western Europe Market Value Share and BPS Analysis by End-User, 2025 to 2035
- Figure 63: Western Europe Market Y-o-Y Growth Comparison by End-User, 2025 to 2035
- Figure 64: Western Europe Market Attractiveness Analysis by End-User
- Figure 65: East Asia Market Value Share and BPS Analysis by Country, 2025 to 2035
- Figure 66: East Asia Market Value Share and BPS Analysis by Grade, 2025 to 2035
- Figure 67: East Asia Market Y-o-Y Growth Comparison by Grade, 2025 to 2035
- Figure 68: East Asia Market Attractiveness Analysis by Grade
- Figure 69: East Asia Market Value Share and BPS Analysis by Function, 2025 to 2035
- Figure 70: East Asia Market Y-o-Y Growth Comparison by Function, 2025 to 2035
- Figure 71: East Asia Market Attractiveness Analysis by Function
- Figure 72: East Asia Market Value Share and BPS Analysis by Application, 2025 to 2035
- Figure 73: East Asia Market Y-o-Y Growth Comparison by Application, 2025 to 2035
- Figure 74: East Asia Market Attractiveness Analysis by Application
- Figure 75: East Asia Market Value Share and BPS Analysis by End-User, 2025 to 2035
- Figure 76: East Asia Market Y-o-Y Growth Comparison by End-User, 2025 to 2035
- Figure 77: East Asia Market Attractiveness Analysis by End-User
- Figure 78: South Asia Pacific Market Value Share and BPS Analysis by Country, 2025 to 2035
- Figure 79: South Asia Pacific Market Value Share and BPS Analysis by Grade, 2025 to 2035
- Figure 80: South Asia Pacific Market Y-o-Y Growth Comparison by Grade, 2025 to 2035
- Figure 81: South Asia Pacific Market Attractiveness Analysis by Grade
- Figure 82: South Asia Pacific Market Value Share and BPS Analysis by Function, 2025 to 2035
- Figure 83: South Asia Pacific Market Y-o-Y Growth Comparison by Function, 2025 to 2035
- Figure 84: South Asia Pacific Market Attractiveness Analysis by Function
- Figure 85: South Asia Pacific Market Value Share and BPS Analysis by Application, 2025 to 2035
- Figure 86: South Asia Pacific Market Y-o-Y Growth Comparison by Application, 2025 to 2035
- Figure 87: South Asia Pacific Market Attractiveness Analysis by Application
- Figure 88: South Asia Pacific Market Value Share and BPS Analysis by End-User, 2025 to 2035
- Figure 89: South Asia Pacific Market Y-o-Y Growth Comparison by End-User, 2025 to 2035
- Figure 90: South Asia Pacific Market Attractiveness Analysis by End-User
- Figure 91: Eastern Europe Market Value Share and BPS Analysis by Country, 2025 to 2035
- Figure 92: Eastern Europe Market Value Share and BPS Analysis by Grade, 2025 to 2035
- Figure 93: Eastern Europe Market Y-o-Y Growth Comparison by Grade, 2025 to 2035
- Figure 94: Eastern Europe Market Attractiveness Analysis by Grade
- Figure 95: Eastern Europe Market Value Share and BPS Analysis by Function, 2025 to 2035
- Figure 96: Eastern Europe Market Y-o-Y Growth Comparison by Function, 2025 to 2035
- Figure 97: Eastern Europe Market Attractiveness Analysis by Function
- Figure 98: Eastern Europe Market Value Share and BPS Analysis by Application, 2025 to 2035
- Figure 99: Eastern Europe Market Y-o-Y Growth Comparison by Application, 2025 to 2035
- Figure 100: Eastern Europe Market Attractiveness Analysis by Application
- Figure 101: Eastern Europe Market Value Share and BPS Analysis by End-User, 2025 to 2035
- Figure 102: Eastern Europe Market Y-o-Y Growth Comparison by End-User, 2025 to 2035
- Figure 103: Eastern Europe Market Attractiveness Analysis by End-User
- Figure 104: Middle East & Africa Market Value Share and BPS Analysis by Country, 2025 to 2035
- Figure 105: Middle East & Africa Market Value Share and BPS Analysis by Grade, 2025 to 2035
- Figure 106: Middle East & Africa Market Y-o-Y Growth Comparison by Grade, 2025 to 2035
- Figure 107: Middle East & Africa Market Attractiveness Analysis by Grade
- Figure 108: Middle East & Africa Market Value Share and BPS Analysis by Function, 2025 to 2035
- Figure 109: Middle East & Africa Market Y-o-Y Growth Comparison by Function, 2025 to 2035
- Figure 110: Middle East & Africa Market Attractiveness Analysis by Function
- Figure 111: Middle East & Africa Market Value Share and BPS Analysis by Application, 2025 to 2035
- Figure 112: Middle East & Africa Market Y-o-Y Growth Comparison by Application, 2025 to 2035
- Figure 113: Middle East & Africa Market Attractiveness Analysis by Application
- Figure 114: Middle East & Africa Market Value Share and BPS Analysis by End-User, 2025 to 2035
- Figure 115: Middle East & Africa Market Y-o-Y Growth Comparison by End-User, 2025 to 2035
- Figure 116: Middle East & Africa Market Attractiveness Analysis by End-User
- Figure 117: Global Market - Tier Structure Analysis
- Figure 118: Global Market - Company Share Analysis
- FAQs -
What is the Global Isopropyl Acetate Market Size in 2025?
The isopropyl acetate market is valued at USD 481.4 million in 2025.
Who are the Major Players Operating in the Isopropyl Acetate market?
Prominent players in the market include SEQENS SPS, DOW, EASTMAN Chemical Company, INEOS, Monument Chemical, and Pidilite Industries Ltd.
What is the Estimated Valuation of the Isopropyl Acetate Market by 2035?
The market is expected to reach a valuation of USD 799.2 million by 2035.
What Value CAGR Did the isopropyl Acetate Market Exhibit over the Last Five years?
The growth rate of the isopropyl acetate market is 4.5% from 2020-2024.