


- Base Value(2025): 3.6 Bn
- Forecast Value (2035): 4.6 Bn
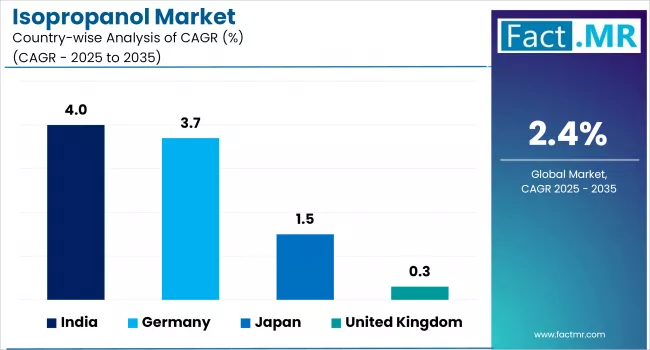
- CAGR (2035): 2.4%
Isopropanol Market Outlook (2025 to 2035)
The global isopropanol market is projected to increase from USD 3.6 billion in 2025 to USD 4.6 billion by 2035, with a CAGR of 2.4%, driven by increasing demand for isopropanol in disinfectants, high-purity solvents for electronics manufacturing, and innovation in bio-based IPA solutions. Their use makes them ideal for applications requiring effective cleaning, sterilization, and precision solvent performance, particularly in healthcare, electronics, and pharmaceutical industries.
-2025-to-2035.webp)
Quick Facts about Isopropanol Market
- Industry Value (2025): USD 3.6 Billion
- Projected Value (2035): USD 4.6 Billion
- Forecast CAGR (2025 to 2035): 2.4%
- Leading Segment (2025): Technical Grade (44% Market Share)
- Country Growth Rate (2025 to 2035): India (4.0% CAGR)
- Top Key Players: Tokuyama Corporation, LG Chem Ltd., Perrigo Company plc, Sasol Limited, and Lyondell Basell Industries N.V.
What are the Drivers of Isopropanol Market?
The growing global emphasis on hygiene and infection prevention in the healthcare, pharmaceutical, and consumer sectors is a major driver of increased demand for isopropyl alcohol (IPA), particularly as a disinfectant and surface cleaner. For instance, in March 2024, INEOS announced an expansion of its isopropyl alcohol production at its Grangemouth site in Scotland to meet rising demand across Europe for hospital-grade disinfectants and pharmaceutical-grade solvents, reflecting increased hygiene standards post-pandemic.
High-purity IPA is essential for cleaning and preparing delicate electronic components such as semiconductors and printed circuit boards. As the electronics industry expands due to increased digitalization and technological innovation, the demand for isopropanol in cleanroom and fabrication processes grows.
Isopropanol is widely used as a solvent in industries including paints & coatings, inks, and adhesives. Its excellent grease-cutting and evaporative properties make it useful in cleaning solutions and surface preparation. Growth in the construction, automotive, and manufacturing sectors directly increases IPA consumption in those industries.
What are the Regional Trends of Isopropanol Market?
In 2025, the U.S. isopropyl market had the highest revenue share in North America, accounting for 80%, due to strong demand in the healthcare, pharmaceutical, and personal care industries.
Consumers and institutions are prioritizing hygiene and sanitization products, particularly in the aftermath of the pandemic, which increases the use of IPA in hand sanitizers and disinfectants. The U.S. market also benefits from technological advancements and stringent regulatory frameworks that ensure high product quality.
The German economy is the world's fifth largest, and the largest in Europe. Germany has the largest pharmaceutical sector in Europe. It holds a significant position in the market due to the active participation of many global pharmaceutical companies.
China has the largest GDP in the Asia-Pacific region. Personal care and cosmetics are among the nation's fastest-growing industries. The Chinese cosmetics and personal care market experienced robust growth in 2019 and 2020, with segments including makeup, skincare, hair care, personal hygiene, fragrances, and other categories.
Brazil's economy has expanded slowly in recent years, particularly in South America. The country has one of South America's most prosperous healthcare markets, as well as one of the world's top five medical tourism destinations. As income levels rise and the nation's middle class expands, people are becoming increasingly interested in health and wellness trends, which is fueling the pharmaceutical industry.
Saudi Arabia has strong government control over all economic activities and an oil-based economy in the Middle East & Africa. The processed food industry is growing rapidly due to rising demand for frozen foods, chilled processed foods and snacks, and chocolate confections.
This opens up a large market for isopropyl alcohol. The National Transformation Program (NTP) and Saudi Arabia's Vision 2030 aim to boost domestic manufacturing through foreign healthcare investments, particularly in the pharmaceutical sector.
What are the Challenges and Restraining Factors of Isopropanol Market?
Health and safety concerns about isopropyl alcohol's (IPA) flammability and toxicity pose significant barriers to its widespread use and handling, particularly in industrial and consumer settings. Improper storage or handling can create fire hazards or exposure risks, necessitating strict adherence to safety regulations and protocols.
For instance, regulatory bodies such as OSHA and the EPA have set stringent guidelines for IPA storage and usage to minimize workplace hazards, which can increase compliance costs for both manufacturers and users.
Compliance with increasingly stringent environmental regulations imposes another constraint. IPA is a volatile organic compound (VOC) with emissions restrictions in major markets. In Europe, VOC limits in cleaning applications and packaging necessitate investments in recovery systems and cleaner production methods, which can cost hundreds of thousands of euros per facility.
Maintaining labor skills is also difficult. High-purity IPA production, particularly for electronics and pharmaceutical industries, necessitates specialized technicians and cleanroom-trained personnel.
Many regions have reported operator shortages, resulting in maintenance delays and service disruptions. In some cases, a single defect during semiconductor cleaning can result in multibillion-dollar batch recalls.
Country-Wise Outlook
U.K. Driving Isopropanol Demand Through Pharmaceutical and Industrial Strength
The U.K. is a mature and well-positioned market for isopropanol (IPA), driven primarily by advanced pharmaceutical, personal care, and industrial manufacturing sectors. IPA is an important raw material in antiseptics, solvents, and cleaning agents, which are in high demand across these industries.
The pharmaceutical and healthcare sectors are major drivers in the UK IPA market, contributing more than 65 billion to the national economy each year. IPA is widely used in this industry for equipment sterilization, surface disinfection, and the production of hand sanitizers.
The personal care and cosmetics industry also benefits from IPA's quick-drying, antimicrobial, and astringent properties. U.K.-based manufacturers continue to develop alcohol-based products such as toners and aftershaves, which drives IPA consumption in the cosmetics industry.
From a regulatory standpoint, the U.K. follows UK REACH, a post-Brexit adaptation of the EU REACH framework. All chemical manufacturers and importers must now comply with this independent system, which includes re-registration and safety evaluations. While this promotes product safety and environmental control, it increases administrative and financial burdens, particularly on small and medium-sized businesses.
Germany Industrial Strength and Regulatory Precision Fueling Isopropanol Market Growth
Germany is a key player in the European isopropanol (IPA) market due to its strong industrial base, advanced chemical manufacturing sector, and strong adherence to environmental regulations. The versatility of IPA as a solvent, disinfectant, and cleaning agent makes it popular in Germany's pharmaceutical, automotive, electronics, and cosmetic industries.
The pharmaceutical and biotechnology sectors, which are among Europe's largest, are major drivers of IPA demand in Germany. According to the German Chemical Industry Association (VCI), Germany accounts for more than 20% of Europe's pharmaceutical output. IPA is essential for sterile manufacturing processes, equipment sanitization, and lab-scale applications. The country's emphasis on innovation and exports ensures consistent domestic use and global distribution of IPA-based pharmaceuticals.
The automotive and electronics industries both contribute significantly to IPA consumption. Due to Germany's leadership in high-precision manufacturing, IPA is required for degreasing, surface preparation, and component cleaning. As automotive companies invest more in EV production, the use of IPA in battery and electronics assembly is expected to increase.
Germany's strict environmental regulations under the European Union's REACH and CLP frameworks affect IPA usage. IPA is classified as a VOC, and its industrial use is governed by the TA Luft (Technical Instructions on Air Quality Control), which restricts emissions. These regulations have prompted industries to adopt cleaner production techniques and VOC recovery systems, resulting in increased costs and innovation opportunities.
Japan High-Tech Industries and Precision Demand Driving Isopropanol Utilization
Japan is a strategic player in the global isopropanol (IPA) market because of its advanced manufacturing sector, cutting-edge electronics industry, and established pharmaceutical base. IPA is widely used in Japan for high-precision cleaning, disinfection, and as a solvent in a variety of industrial and consumer applications.
Another significant consumer is the pharmaceutical and personal care industry. IPA is used to make antiseptics, hand sanitizers, and alcohol-based cleaning products. Japan's aging population and strong focus on healthcare continue to drive demand for sterilization and disinfection products.
On the regulatory front, Japan follows the Chemical Substances Control Law (CSCL) and the Pollutant Release and Transfer Register (PRTR) system, which classify IPA as a Class II organic solvent. This requires manufacturers and users to report usage volumes and emissions, which encourages the use of emissions control systems and efficient usage practices.
In Japan, there is a strong push for high-purity, low-residue IPA, particularly in precision sectors such as optics and photonics. This provides opportunities for local and international suppliers to develop cleaner, more stable IPA grades that meet industry standards.
Category-wise Analysis
Technical to Exhibit Leading by Grade Type
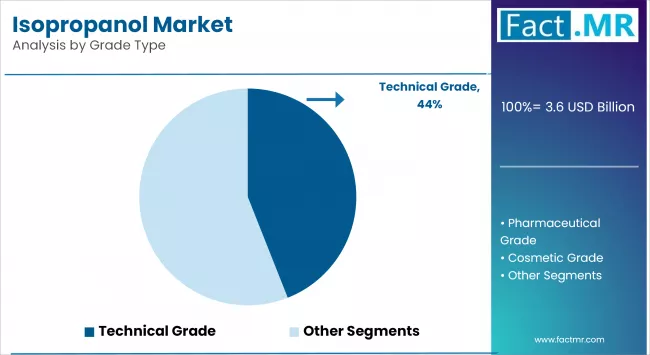
Technical grade IPA dominates the isopropanol market as it is widely used in various industrial processes, including the production of solvents, cleaning agents, and manufacturing operations. Technical grade IPA is highly regarded for its superior grease and contaminant removal efficacy, making it an essential component in many industrial processes.
Pharmaceutical grade is the fastest-growing segment in the isopropanol market, driven by its stringent purity standards essential for drug formulation and healthcare products. Its high level of purity ensures safety and effectiveness, making it suitable for critical pharmaceutical applications.
Pharmaceutical-grade IPA is manufactured to strict purity criteria and is used in the formulation of pharmaceuticals, medications, and healthcare products. Due to its high purity level, this substance is free from impurities, making it suitable for critical pharmaceutical applications.
Indirect Hydration to Exhibit Leading by Manufacturing Process
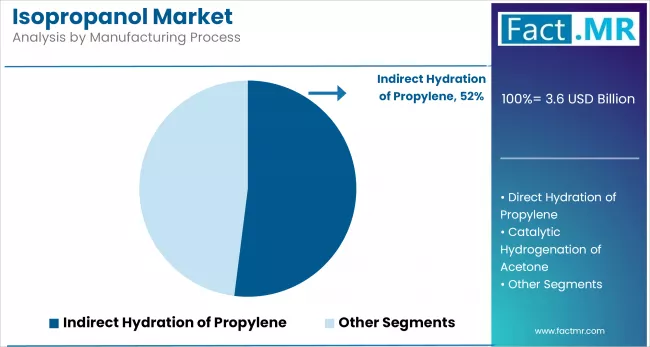
Indirect hydration of propylene dominates the isopropanol market, as this is a traditional and widely used method for producing isopropanol. In this process, propylene reacts with sulfuric acid to produce isopropyl sulfate, which is then hydrolyzed to produce isopropane. This method is preferred when high-purity propylene is readily available and produces high yields. However, it uses corrosive intermediates and necessitates extensive acid recovery systems, making the process more complicated and environmentally challenging. Despite this, it remains important in areas with established infrastructure and long-standing industrial operations.
Catalytic hydrogenation of acetone is the fastest-growing segment in the isopropanol market, as it is an alternative production method in which acetone is converted into isopropanol using hydrogen and a metal catalyst such as palladium or nickel. This process is commonly used in integrated chemical plants where acetone is produced as a byproduct, such as from phenol production.
It is efficient and beneficial for circular economy practices, but it is less commonly used in primary production due to cost and feedstock availability constraints. This method recovers value from acetone waste streams while also promoting chemical manufacturing sustainability.
Antiseptics to Exhibit Leading by Primary Function
The Antiseptics segment dominates the market, owing to its widespread use in medical and personal care applications. Isopropyl alcohol is a key component in hand sanitizers, disinfectants, and wound cleaning solutions. Its ability to kill bacteria and viruses makes it indispensable in healthcare settings.
Additionally, its astringent properties make it useful in skincare and cosmetic products. The high demand in both the medical and consumer markets has fueled the growth and dominance of this segment in the isopropyl alcohol market.
Cleaning and drying agents are the fastest-growing segment in the isopropanol market, as these agents play a crucial role in maintaining hygiene and sanitation. The demand for isopropyl alcohol-based cleaning products is increasing as people become more aware of the importance of cleanliness.
This segment is critical to households, industries, and healthcare settings. As hygiene becomes a top priority globally, the growth of the cleaning agent segment is expected to accelerate, significantly contributing to market expansion.
Pharmaceutical to Exhibit Leading by Application
The pharmaceutical segment currently holds the largest market share, due to its use as a finished product in the pharmaceutical industry. Alcohol wipes and swabs used to clean wounds are made with 70% isopropyl alcohol. Isopropyl alcohol is also found in mouthwashes, ear drops, and hand sanitizers. In the pharmaceutical industry, isopropyl alcohol is commonly used in small, safe amounts to manufacture capsules and tablets. IPA is used as a solvent in the synthesis of pharmaceutical intermediates.
The cosmetics and personal care sectors have a significant impact on the isopropyl market, owing to IPA's indispensable utility in these industries. IPA serves a multifaceted role as a versatile constituent in cosmetics and personal care products, acting as a dependable solvent for fragrances and aiding in the formulation of complex products.
Competitive Analysis
The isopropanol market is becoming increasingly competitive, with global chemical giants and regional producers competing for market share. The competition is primarily driven by price, production capacity, process efficiency, and application specialization. Due to its widespread industrial application, including pharmaceuticals, cosmetics, electronics, and cleaning, manufacturers prioritise scaling capacity and serving diverse sectors.
Process technology is critical to competitiveness. Direct hydration of propylene offers cost savings and a lower environmental impact compared to the older indirect hydration method, which involves handling sulfuric acid and complex recovery systems. The choice of technology influences not only costs but also compliance with stricter environmental regulations.
Product purity differentiation is another important factor. To meet sector-specific standards, producers offer IPA in three grades: technical, pharmaceutical, and electronic. For example, electronics and healthcare applications require ultra-high purity, whereas industrial sectors may accept lower grades. This segmentation enables players to target niche, high-margin markets.
Key players in the isopropanol industry include Dow Chemical Company, Exxon Mobil Corporation, Shell Chemicals, Mitsui Chemicals, Inc, Tokuyama Corporation, LG Chem Ltd., Perrigo Company plc, Sasol Limited, Lyondell Basell Industries N.V.
Recent Development
- In January 2025, the US Department of Commerce announced that it would provide Sumitomo Chemical with USD 52.1 billion for a semiconductor-grade isopropyl alcohol (IPA) plant in Baytown, Texas. The deal, announced under the CHIPS and Science Act, is part of a USD 246 billion investment to strengthen the semiconductor supply chain for chip manufacturing.
- In August 2024, Eastman introduced a new electronic-grade solvent with superior quality. EastaPure's electronic-grade isopropyl alcohol (IPA) provides a dependable and domestically produced solvent to semiconductor manufacturers in the United States.
- In April 2024, Shell PLC reaffirmed its commitment to achieving net-zero emissions by 2050, outlining its Energy Transition Strategy 2024. This plan focuses on reducing carbon intensity, investing in low-carbon solutions, and expanding carbon capture and storage (CCS) technologies.
Segmentation of Isopropanol Market
-
By Grade Type :
- Technical Grade
- Direct Solvent Grade
- Chemical Derivatives Grade
- Pharmaceutical Grade
- Cosmetic Grade
- Electronic Grade
- Technical Grade
-
By Manufacturing Process :
- Indirect Hydration of Propylene
- Direct Hydration of Propylene
- Catalytic Hydrogenation of Acetone
-
By Primary Function :
- Dissolving Agent
- Cleaning & Drying Agent
- Disinfectant
- Anti - freezing Agent
- Synthetic Flavoring Adjuvant
- Antiseptics
- Anti-adhesives
- Others
-
By Application :
- Pharmaceuticals
- Homecare
- Cosmetic & Personal Care
- Chemical Intermediates
- Electronics
- Others
-
By Region :
- North America
- Latin America
- Western Europe
- Eastern Europe
- East Asia
- South Asia & Pacific
- Middle East & Africa
- Frequently Asked Questions -
What is the Global Isopropanol Market size in 2025?
The isopropanol market is valued at USD 3.6 billion in 2025.
Who are the Major Players Operating in the Isopropanol Market?
Prominent players in the market include Tokuyama Corporation, LG Chem Ltd., Perrigo Company plc, Sasol Limited, and Lyondell Basell Industries N.V.
What is the Estimated Valuation of the Isopropanol Market by 2035?
The market is expected to reach a valuation of USD 4.6 billion by 2035.
What Value CAGR Did the Isopropanol Market Exhibit over the Last Five Years?
The growth rate of the isopropanol market is 2.1% from 2020-2024.