- Market Value (2025): USD 70.9 Bn
- Estimated Value (2026): USD 75.2 Bn
- Forecast Value (2036): USD 134.7 Bn
- CAGR (2026-2036): 6.0%
What is the Agricultural Tractors Market forecast to be worth by 2036?
USD 134.7 billion by 2036 CAGR 6.0%.
- The agricultural tractors market reached USD 70.9 billion in 2025.
- Demand is projected to increase from USD 75.2 billion in 2026 to USD 134.7 billion by 2036.CAGR 6.0%
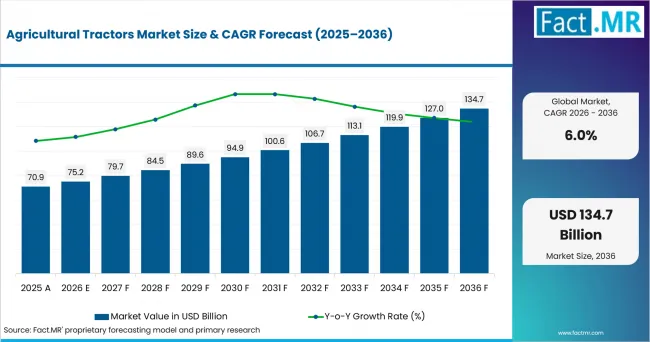
Agricultural Tractors Market Value Analysis | Source: Fact.MR
What are the defining numbers behind Agricultural Tractors Market growth?
An absolute opportunity of USD 59.5 billion is expected between 2026 and 2036.
- Demand Drivers in the Market
- Mechanization reduces the amount of manual labour required for land preparation, planting and other time-sensitive field operations. FAO identifies mechanization as a way to relieve labour shortages while improving the timeliness and productivity of agricultural work. Tractors remain central because one power unit can operate several implements across the crop cycle.
- Farm labour availability is increasing the economic value of machinery in established agricultural markets. USDA research shows that the quantity of labour used in U.S. agriculture has declined substantially over the long term as machinery and technology have substituted for labour. Farms facing higher labour costs or limited operator availability therefore have an incentive to invest in tractors that can cover more hectares per working hour.
- Precision agriculture is changing the tractor from a mechanical power source into a connected field platform. Germany's agriculture ministry notes that GPS steering can optimize tractor travel paths and reduce fuel use, while intelligent machinery increasingly links tractors with implements and farm-management systems. This supports purchases of tractors capable of guidance, telematics and implement control.
- Access to agricultural credit directly affects tractor replacement and fleet expansion because tractors require significant upfront capital. Brazil's Moderfrota programme specifically finances tractors and associated agricultural machinery, while the country's agricultural financing framework continues to allocate investment credit for farm modernization.
- Government programmes are also encouraging equipment investment where productivity and labour availability are policy concerns. The UK's Farming Equipment and Technology Fund supports productivity-related equipment, while Japan is funding the adoption of smart agricultural machinery as its farm workforce declines and ages.
- Key Segments Analyzed
- Utility Tractors account for 36.9% of the Product segment in 2026, supported by their ability to operate several implements across general-purpose farm work.
- 30 To 50 Horsepower holds 32.4% of the Horsepower Range segment in 2026 because the range provides sufficient power for routine cultivation while remaining suitable for farms that do not require high-horsepower equipment.
- Four Wheel Drive accounts for 54.7% of the Drive System segment in 2026, reflecting the need for improved traction during tillage and operation with heavier implements.
- Diesel Powered Tractors represent 71.8% of the Fuel Type segment in 2026 because diesel platforms combine established refuelling infrastructure with sustained power delivery for extended field work.
- Tillage Operations hold 29.6% of the Application segment in 2026, as tractors are routinely used for soil preparation and land conditioning before planting.
- Commercial Farmers account for 38.7% of the End Use segment in 2026, supported by higher annual tractor utilization and the ability to spread equipment cost across larger operating volumes.
- Dealer Network represents 62.5% of the Distribution Channel segment in 2026, reflecting the importance of local servicing, spare parts, financing support and implement matching during tractor purchases.
- Analyst Opinion at Fact.MR
- Shambhu Nath Jha, Principal Consultant at Fact.MR, states, “Agricultural tractor purchasing will increasingly be judged against work completed per hour and total operating cost. Farmers need machines that match field size, implement requirements and available labour. Diesel platforms will continue to serve intensive field work, while guidance systems, connected controls and alternative powertrains will gradually influence replacement decisions across specific applications.”
- Strategic Implications
- Manufacturers should align horsepower and tractor dimensions with actual farm workloads. A versatile tractor that supports commonly used implements can generate higher annual utilization than a machine optimized for a narrow operation.
- Dealer capability remains important because tractor ownership creates continuing requirements for maintenance and spare parts. Manufacturers therefore need service coverage alongside product availability when entering agricultural regions.
- Precision features should be integrated around measurable operating benefits such as reduced overlap and improved implement control. Technology that adds cost without reducing labour or input consumption can face slower adoption.
- Electric and hybrid tractors are more likely to gain initial traction in applications with predictable daily workloads and access to charging. Diesel remains relevant for extended field operations where rapid refuelling and high utilization are required.
How does the Agricultural Tractors Market break down by segment?
The market is segmented by Product, Horsepower Range, Drive System, Fuel Type, Application, End Use and Distribution Channel.
Why do Utility Tractors lead Product?
Utility Tractors are projected to account for a 36.9% share in 2026.
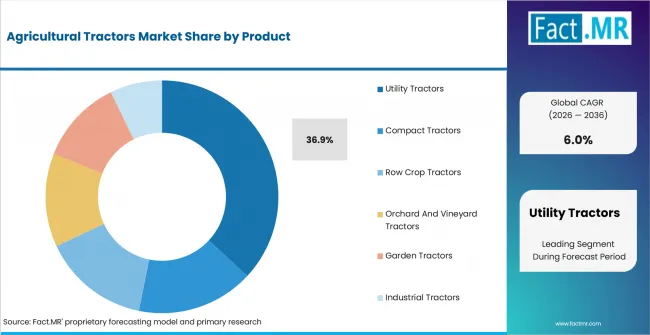
Agricultural Tractors Market Analysis By Product | Source: Fact.MR
Utility tractors lead because they can support several farm activities without requiring a dedicated machine for each operation. Farmers can connect tillage equipment and planting implements while using the same tractor for transport or general material movement.
This flexibility raises annual utilization and improves the economics of ownership. FAO describes sustainable mechanization as covering land preparation, planting and transport across the agricultural value chain, which supports demand for multipurpose power units capable of moving between operations.
Tractor manufacturers are also extending utility platforms with guidance and digital controls. TAFE's current portfolio spans a broad horsepower range, while its recent product development includes hybrid tractors and vision-guidance technology, indicating continued investment in multifunctional tractor platforms.
Why does 30 To 50 Horsepower lead Horsepower Range?
30 To 50 Horsepower is projected to account for a 32.4% share in 2026.
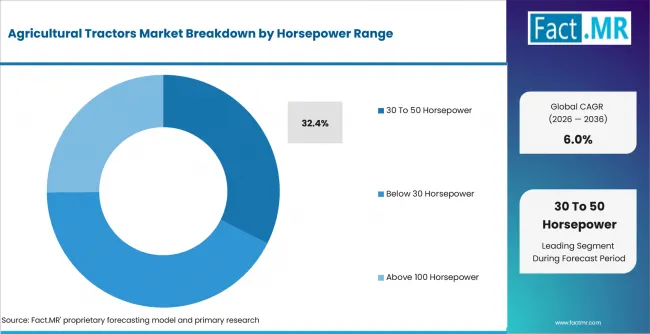
Agricultural Tractors Market Analysis By Horsepower Range | Source: Fact.MR
This range leads because it provides enough power for routine cultivation while controlling purchase cost and fuel consumption. Farmers can use these tractors for soil preparation and transport without moving to heavier equipment designed for more demanding implements.
The segment also fits markets where tractors perform work beyond field cultivation. Kubota notes that tractors in India are frequently used for transportation and carrying goods alongside agricultural operations, reinforcing demand for versatile machines that balance power with operating flexibility.
Why does Four Wheel Drive lead Drive System?
Four Wheel Drive is projected to account for a 54.7% share in 2026.
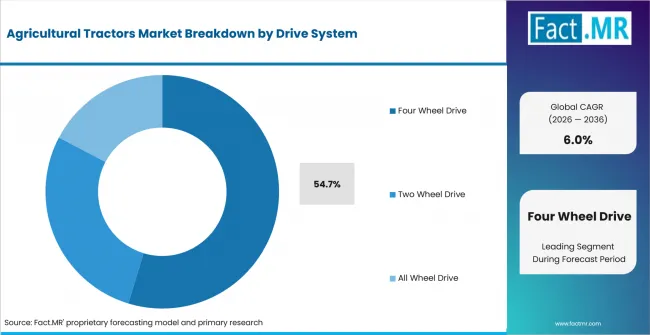
Agricultural Tractors Market Analysis By Drive System | Source: Fact.MR
Four Wheel Drive leads because transmitting power through both axles improves traction when tractors operate on loose soil or uneven ground. Better traction is particularly relevant during tillage, when implements create substantial resistance and wheel slip reduces usable power.
Four Wheel Drive can also improve control when tractors operate with heavier implements or under variable field conditions. Buyers therefore assess the drive configuration against soil type and implement load rather than engine output alone.
Why do Diesel Powered Tractors lead Fuel Type?
Diesel Powered Tractors are projected to account for a 71.8% share in 2026.
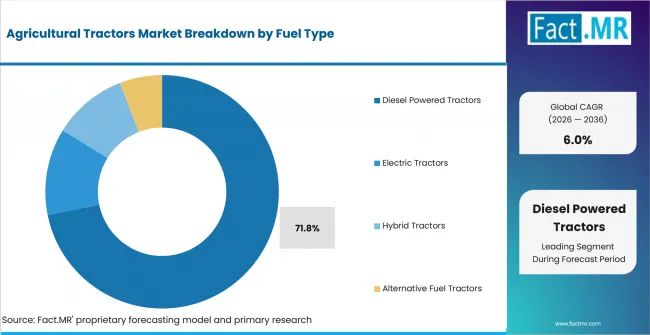
Agricultural Tractors Market Analysis By Fuel Type | Source: Fact.MR
Diesel tractors lead because commercial farm operations often require several hours of continuous work during narrow planting and harvesting windows. Diesel powertrains allow rapid refuelling and are supported by an established equipment-service infrastructure.
The existing installed base also supports replacement demand because farmers can continue using established maintenance practices and fuel storage. Alternative powertrains are developing, with TAFE introducing an electric-hybrid tractor concept and Kubota demonstrating alternative-power agricultural machinery, but adoption will depend on whether charging or fuel infrastructure can support field duty cycles.
Why do Tillage Operations lead Application?
Tillage Operations are projected to account for a 29.6% share in 2026.
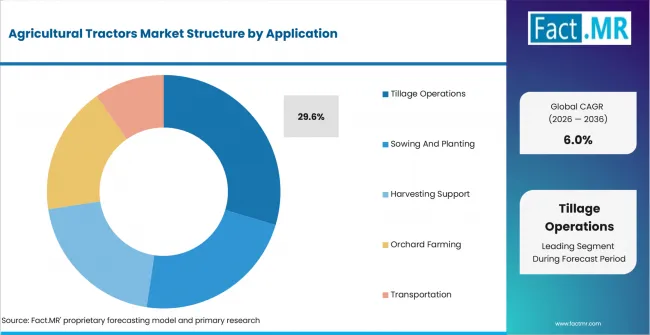
Agricultural Tractors Market Analysis By Application | Source: Fact.MR
Tillage leads because soil preparation is one of the recurring tractor-powered activities completed before planting. Tractors supply the drawbar power required for implements used in breaking and conditioning soil.
Timing matters because land preparation must be completed within the appropriate planting window. FAO identifies mechanization as a means of improving the timeliness of agricultural operations, making tractor availability particularly valuable when several fields must be prepared within a limited period.
Why do Commercial Farmers lead End Use?
Commercial Farmers are projected to account for a 38.7% share in 2026.
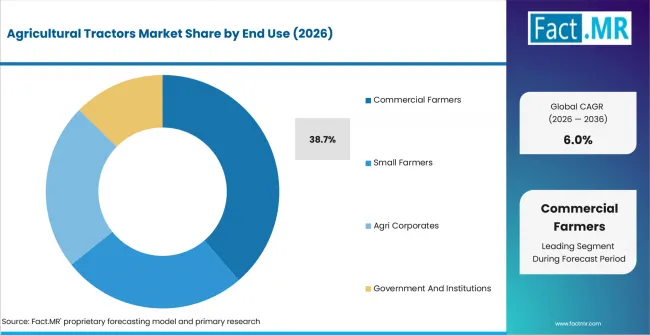
Agricultural Tractors Market Analysis By End Use | Source: Fact.MR
Commercial farmers lead because higher equipment utilization makes tractor ownership easier to justify. A tractor used across more hectares and several operations can spread its purchase and maintenance cost across a larger volume of agricultural output.
Farm scale supports this mechanism. The USDA reported that the average U.S. farm covered 463 acres in the 2022 Census of Agriculture, up 5% from 2017. Larger operating areas increase the value of equipment that can reduce the labour hours required per hectare.
Why does Dealer Network lead Distribution Channel?
Dealer Network is projected to account for a 62.5% share in 2026.
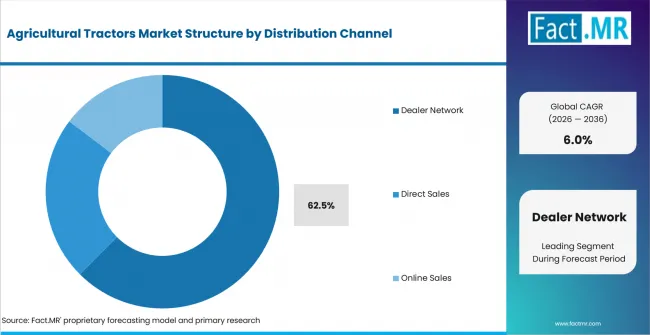
Agricultural Tractors Market Analysis By Distribution Channel | Source: Fact.MR
Dealer networks lead because tractor purchases require more than equipment delivery. Buyers need help selecting horsepower and compatible implements, while financing and maintenance arrangements can influence the final purchase.
After-sales support is particularly important because a breakdown during tillage or planting can interrupt time-sensitive work. Local dealers provide access to technicians and spare parts, which reduces the operational risk associated with tractor ownership.
What is accelerating Agricultural Tractors Market adoption, and what is holding it back?
Drivers Impact Analysis
| Driver | (~) % Impact on CAGR | Geographic Relevance | Impact Timeline |
|---|---|---|---|
| Farm mechanization and labour substitution | +1.6% | Global | Short term (≤ 2 years) |
| Equipment financing and productivity support | +1.4% | USA, Germany and UK | Short term (≤ 2 years) |
| Precision farming and tractor-implement integration | +1.1% | Global | Medium term (2–4 years) |
| Clear horsepower and implement specification | +0.9% | USA, UK and Canada | Medium term (2–4 years) |
| Fuel and operating-efficiency improvements | +0.6% | Global | Long term (≥ 4 years) |
Source: Fact.MR analysis. Updated Aug 13, 2026
Opportunity Impact Analysis
| Opportunity | (~) % Impact on CAGR | Geographic Relevance | Impact Timeline |
|---|---|---|---|
| Electric and hybrid tractor applications | +1.0% | Global | Medium term (2–4 years) |
| Autonomous and guidance-enabled tractors | +0.8% | USA, UK and Germany | Medium term (2–4 years) |
| Dealer and service-network expansion | +0.7% | Global | Long term (≥ 4 years) |
| Digital interoperability and equipment standards | +0.5% | USA, Canada and Singapore | Long term (≥ 4 years) |
Source: Fact.MR analysis. Updated Aug 13, 2026
Restraints Impact Analysis
| Restraint | (~) % Impact on CAGR | Geographic Relevance | Impact Timeline |
|---|---|---|---|
| High equipment cost and financing exposure | -1.1% | Global | Short term (≤ 2 years) |
| Emissions, safety and equipment-compliance requirements | -0.9% | USA, UK and Germany | Short term (≤ 2 years) |
| Substitution by lower-cost used equipment | -0.7% | Import-dependent markets | Medium term (2–4 years) |
| Fuel, component and supply-chain pressure | -0.5% | Global | Long term (≥ 4 years) |
Source: Fact.MR analysis. Updated Aug 13, 2026
Which countries are scaling the Agricultural Tractors Market?
- Germany: Germany has more than 276,000 farms with an average area of around 61 hectares. Its agricultural policy combines investment with innovation, while precision agriculture increasingly uses GPS steering and digitally connected machinery. These conditions support demand for tractors capable of working with advanced implements and farm-management systems.
- Brazil: Tractor demand is supported by agricultural production scale and dedicated machinery-financing programmes. BNDES Moderfrota finances tractors and associated equipment, giving producers a defined credit channel for fleet modernization.
- USA: The average U.S. farm increased to 463 acres in the 2022 Census of Agriculture. Larger operating areas increase the value of machinery that reduces labour requirements and allows field operations to be completed within shorter time windows.
- UK: Government equipment programmes continue to support investment aimed at farm productivity. The Farming Equipment and Technology Fund 2026 included a dedicated productivity theme, creating a route through which farmers can offset part of the cost of qualifying equipment.
- Japan: Japan faces a structural farm-labour constraint. MAFF reported that the number of core agricultural workers fell from 2.4 million in 2000 to about 1.16 million in 2023, with 71% aged 65 or older. This supports demand for tractors and smart machinery that reduce operator workload.
Country CAGR (2026–2036)
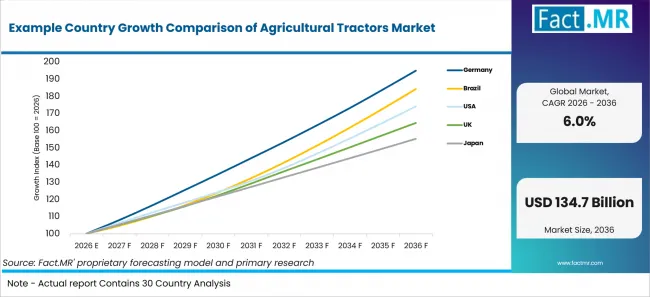
Example Country Growth Comparison Of Agricultural Tractors Market | Source: Fact.MR
| Country | CAGR |
|---|---|
| Germany | 6.9% |
| Brazil | 6.3% |
| USA | 5.7% |
| UK | 5.1% |
| Japan | 4.5% |
Source: Fact.MR analysis. Updated Aug 13, 2026
What is driving Germany’s growth through 2036?
Germany is forecast to expand at a 6.9% CAGR from 2026 to 2036.
Germany's tractor market is increasingly connected with precision agriculture. The federal agriculture ministry notes that intelligent technology is already embedded in agricultural machinery, including GPS guidance that can optimize tractor routes and reduce fuel consumption. Tractor replacement therefore creates an opportunity to add guidance, implement control and data connectivity alongside mechanical capacity.
Germany's CAP Strategic Plan also supports investment, innovation and the sustainable competitiveness of farms. With agricultural structures ranging from specialized operations to family farms, manufacturers require portfolios that cover both general-purpose tractors and equipment configured for more specialized farming systems.
What is driving Brazil’s growth through 2036?
Brazil is forecast to expand at a 6.3% CAGR from 2026 to 2036.
Agricultural financing is a direct mechanism supporting tractor purchases. Moderfrota provides financing for tractors and associated agricultural implements, allowing farmers and cooperatives to spread the capital cost of replacing or expanding equipment fleets.
The 2026/2027 Plano Safra increased the allocation for agricultural investment credit compared with the preceding programme. This supports capital expenditure on machinery where producers can demonstrate gains in efficiency and farm competitiveness.
What is driving USA’s growth through 2036?
The USA is forecast to expand at a 5.7% CAGR from 2026 to 2036.
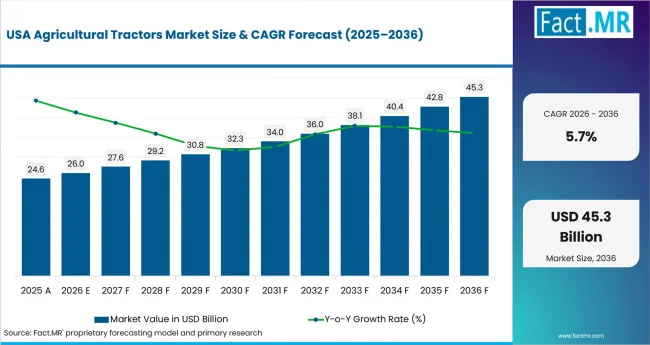
Agricultural Tractors Market Country Value Analysis | Source: Fact.MR
Farm structure supports demand for higher-utilization machinery. The 2022 Census of Agriculture recorded 1.9 million farms and 880 million acres of farmland, while average farm size increased to 463 acres. Covering larger areas increases the value of tractors that can operate wider implements or complete field work more quickly.
Labour economics create a second demand mechanism. USDA research found that agricultural labour quantity declined over the long term as machinery and technology substituted for labour. Tractor purchases therefore remain tied to the ability to maintain farm output with fewer labour hours.
What is driving the UK’s growth through 2036?
The UK is forecast to expand at a 5.1% CAGR from 2026 to 2036.
The UK is encouraging investment in equipment that improves farm productivity. The 2026 Farming Equipment and Technology Fund included a productivity category, while wider government programmes continue to treat automation and equipment investment as part of the response to agricultural labour constraints.
Agricultural labour use continues to decline, increasing the value of equipment that allows a smaller workforce to manage the same farm area. Government analysis identifies machinery and automation as part of the longer-term productivity response.
What is driving Japan’s growth through 2036?
Japan is forecast to expand at a 4.5% CAGR from 2026 to 2036.
Japan's agricultural workforce is shrinking and aging, which makes labour-saving machinery increasingly relevant. MAFF expects further reductions in the core farm workforce and is promoting smart agriculture to maintain food production with fewer operators.
The government is also supporting machinery investment linked to smart agricultural systems. Programmes for 2026 include support for introducing agricultural machinery that enables farms to shift toward higher labour productivity. This creates a direct adoption pathway for guidance-enabled and automated tractor systems.
Who leads the Agricultural Tractors Market?
TAFE is positioned as the primary supplier in the market assessment. Its tractor portfolio covers a wide range of horsepower requirements, allowing it to serve compact and utility applications alongside higher-power field work. TAFE reported approximately 214,951 tractor sales during FY26 and has also introduced hybrid tractor and vision-guidance technologies as part of its product development.
International Tractors Limited competes through Sonalika and related tractor platforms across domestic and export markets. SDF Group participates through several agricultural machinery brands. Its 2025 results identified specialized tractors as an important contributor to its tractor business.
Kubota combines agricultural machinery development with automation and tractor-implement management technologies. Its technical programmes include automated tractors and implement-control systems intended to improve field efficiency.
Competition therefore depends on horsepower coverage and implement compatibility. Dealer reach and service availability affect purchasing decisions because agricultural equipment must remain available during time-sensitive field operations.
Digital capability is becoming another point of differentiation. Guidance systems and automation can reduce operator workload, while hybrid and electric platforms create options for applications where duty cycles support alternative powertrains.
Escorts Limited now operates within Escorts Kubota Limited following Kubota's acquisition of the Indian agricultural machinery business. SDF's current corporate materials also identify Lamborghini Trattori as one of the group's tractor brands, creating a brand-parent relationship within the company names included in the assessment.
Which companies are the key providers?
Key companies include TAFE Motors and Tractors Ltd. (Tractor and Farm Equipment Limited); Lamborghini Trattori (Argo Tractors); Caterpillar Inc.; Zetor Tractors a.s.; Dongfeng Agricultural Machinery; Sonalika International Tractors Ltd.; JCB; Foton Lovol International Heavy Industry Co., Ltd.; Mitsubishi Mahindra Agricultural Machinery Co. Ltd.; Bharat Earth Movers Limited (BEML); Kubota (China) Agricultural Machinery Co. Ltd.; Escorts Limited; International Tractors Limited; and SDF Group (Same Deutz-Fahr).
- TAFE Motors and Tractors Ltd. (Tractor and Farm Equipment Limited)
- Lamborghini Trattori (Argo Tractors)
- Caterpillar Inc.
- Zetor Tractors a.s.
- Dongfeng Agricultural Machinery
- Sonalika International Tractors Ltd.
- JCB
- Foton Lovol International Heavy Industry Co., Ltd.
- Mitsubishi Mahindra Agricultural Machinery Co. Ltd.
- Bharat Earth Movers Limited (BEML)
- Kubota (China) Agricultural Machinery Co. Ltd.
- Escorts Limited
- International Tractors Limited
- SDF Group (Same Deutz-Fahr)
Bibliography
- Food and Agriculture Organization of the United Nations. (2026). Sustainable Agricultural Mechanization. FAO.
- Food and Agriculture Organization of the United Nations. (2026). Agricultural Mechanization. FAO.
- European Commission. (2026). Germany: CAP Strategic Plan. European Commission.
- Federal Ministry of Food and Agriculture, Germany. (2025). Digitalisation in Agriculture. Federal Government of Germany.
- U.S. Department of Agriculture, Economic Research Service. (2025). Quantity of Agricultural Labor Has Declined Over Time as Quality of Farm Labor Has Grown. USDA.
- U.S. Department of Agriculture, Economic Research Service. (2024). 2022 Census of Agriculture: Number of U.S. Farms Falls Below 2 Million. USDA.
- Banco Nacional de Desenvolvimento Econômico e Social. (2026). Moderfrota: Programa de Modernização da Frota de Tratores Agrícolas e Implementos Associados e Colheitadeiras. BNDES.
- Ministry of Agriculture and Livestock, Brazil. (2026). Plano Safra 2026/2027. Government of Brazil.
- Department for Environment, Food & Rural Affairs. (2026). Farming Equipment and Technology Fund 2026. UK Government.
- Department for Environment, Food & Rural Affairs. (2026). Farming Roadmap 2050: Evidence Annex. UK Government.
- Ministry of Agriculture, Forestry and Fisheries, Japan. (2025). Smart Agriculture. Government of Japan.
- Ministry of Agriculture, Forestry and Fisheries, Japan. (2026). Comprehensive Measures for Transition to Smart Technology Systems. Government of Japan.
- Tractors and Farm Equipment Limited. (2026). TAFE FY26 Tractor Sales and Product Development. TAFE.
- Kubota Corporation. (2025). Kubota Technical Report No. 57. Kubota Corporation.
- SDF Group. (2026). 2025 Financial Results. SDF Group.
This Report Answers
- The report examines agricultural tractor demand across Product, Horsepower Range, Drive System, Fuel Type, Application, End Use and Distribution Channel.
- Segment analysis explains the operating factors supporting the principal tractor configurations used across farm applications.
- Country analysis evaluates tractor-market development across Germany, Brazil, the USA, the UK and Japan.
- Competitive analysis examines established tractor manufacturers alongside agricultural machinery groups serving regional and international markets.
- Application analysis considers tillage and planting workflows alongside harvesting support, orchard operations and agricultural transportation.
What does the Agricultural Tractors Market cover?
The Agricultural Tractors Market covers powered tractors used to pull, operate or carry agricultural implements across farming and related operations.
The assessment includes utility and compact tractors alongside row-crop, orchard, garden and industrial configurations within the stated taxonomy. Demand is evaluated by horsepower range, drive system and fuel type, with application coverage tied to tillage and sowing, harvesting support, orchard farming and transportation.
What is included in the scope?
The scope includes tractors purchased by commercial farmers, small farmers and agri corporates, along with institutional buyers identified within the segmentation.
Diesel and alternative-power tractors are included when supplied for agricultural operations within the defined product categories. Four Wheel Drive and other specified drive systems are assessed across the stated horsepower categories.
Dealer sales and direct purchasing are included alongside online sales. Tractor demand is assessed across the listed global regions while retaining the stated country forecasts.
What is excluded from the scope?
The scope excludes standalone agricultural implements when sold without a tractor. Harvesters and other self-propelled agricultural machines that do not fall within the tractor categories are outside the market.
Construction machinery is excluded unless the machine is sold within the specified Industrial Tractors category. Passenger vehicles and road-going commercial vehicles are also outside the scope.
Replacement parts and maintenance services are not sized separately unless their value is incorporated into the sale of a tractor within the defined market.
How Was the Analysis Built?
The analysis draws on more than 120 sources, over 35 company portfolios and more than 20 industry interviews across at least 25 countries.
- Primary Research: Interviews with tractor manufacturers, dealers, farm operators, agricultural cooperatives and equipment specialists examine horsepower selection, implement requirements, replacement cycles and purchasing criteria.
- Desk Research: The review covers agricultural censuses and farm-structure data, mechanization policy, machinery-financing programmes, tractor manufacturer disclosures and smart-agriculture initiatives. Sources used in the analysis are recorded in the bibliography.
- Market Sizing and Forecasting: Estimates combine tractor demand with farm structure and replacement requirements. The model considers horsepower mix, drive configuration and fuel type while assessing agricultural investment conditions and dealer activity.
- Data Validation and Update Cycle: Findings are cross-checked against manufacturer activity and public agricultural data. Updates account for farm-equipment financing, crop conditions, technology adoption and changes in tractor product portfolios.
Segmentation
What is the report's scope and coverage?
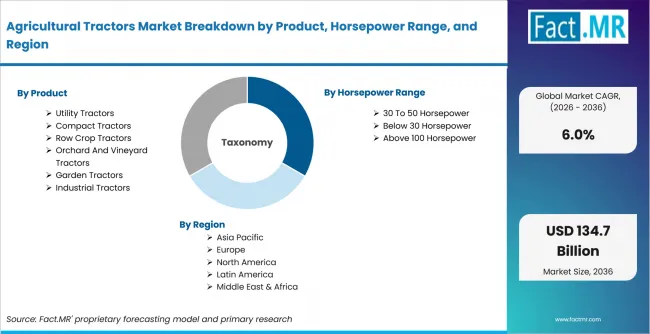
Agricultural Tractors Market Breakdown By Product, Horsepower Range, And Region | Source: Fact.MR
| Attribute | Details |
|---|---|
| Quantitative Units | USD Billion |
| Market Definition | Agricultural tractors sold for farming and related operations within the stated product, horsepower, drive, fuel, application, end-use and distribution segments |
| Segments Covered | Product; Horsepower Range; Drive System; Fuel Type; Application; End Use; Distribution Channel |
| Regions Covered | North America; Latin America; Europe; East Asia; South Asia and Pacific; Middle East and Africa |
| Countries Covered | Germany; Brazil; USA; UK; Japan |
| Key Companies Profiled | TAFE Motors and Tractors Ltd. (Tractor and Farm Equipment Limited); Lamborghini Trattori (Argo Tractors); Caterpillar Inc.; Zetor Tractors a.s.; Dongfeng Agricultural Machinery; and others |
| Forecast Period | 2026 to 2036 |
| Approach | Hybrid top-down and bottom-up approach using tractor demand, fleet replacement, farm structure, horsepower mix, drive systems, fuel mix, dealer sales and agricultural investment trends |
Source: Fact.MR analysis. Updated Aug 13, 2026
How is the market segmented?
-
By Product:
- Utility Tractors
- General Purpose Tractors
- Multi Crop Tractors
- Compact Tractors
- Below 30 Horsepower Models
- Light Duty Farm Tractors
- Row Crop Tractors
- Precision Farming Tractors
- Specialized Row Crop Units
- Orchard And Vineyard Tractors
- Low Profile Tractors
- Specialty Orchard Units
- Garden Tractors
- Residential Farming Units
- Hobby Farming Tractors
- Industrial Tractors
- Construction Compatible Tractors
- High Torque Models
- Utility Tractors
-
By Horsepower Range:
- 30 To 50 Horsepower
- Below 30 Horsepower
- Above 100 Horsepower
-
By Drive System:
- Four Wheel Drive
- Two Wheel Drive
- All Wheel Drive
-
By Fuel Type:
- Diesel Powered Tractors
- Electric Tractors
- Hybrid Tractors
- Alternative Fuel Tractors
-
By Application:
- Tillage Operations
- Soil Preparation
- Land Conditioning
- Sowing And Planting
- Precision Sowing
- Row Planting
- Harvesting Support
- Combine Assistance
- Crop Collection Support
- Orchard Farming
- Vineyard Operations
- Tree Crop Management
- Transportation
- Tillage Operations
-
By End Use:
- Commercial Farmers
- Small Farmers
- Agri Corporates
- Government And Institutions
-
By Distribution Channel
- Dealer Network
- Direct Sales
- Online Sales
-
By Region:
- North America
- Latin America
- Western Europe
- Eastern Europe
- East Asia
- South Asia and Pacific
- Middle East & Africa
Frequently Asked Questions
Which Product leads the market?
Which Horsepower Range leads the market?
Which Drive System leads the market?
Which Fuel Type leads the market?
Which Application leads the market?
Which End Use leads the market?
Which Distribution Channel leads the market?
Which country records a 6.9% CAGR?
What is the primary driver in this market?
What is the main restraint?
Which companies are included in the market assessment?
Who worked on this report


Preview the report firsthand - request a free sample
Free SampleGet the brochure for pricing and purchase details
Download PDF