- Market Value (2025): USD 3.8 Bn
- Estimated Value (2026): USD 4.0 Bn
- Forecast Value (2036): USD 7.9 Bn
- CAGR (2026-2036): 7.0%
What is the Grid Resilience Monitoring Services Market forecast to be worth by 2036?
USD 4.0 billion in 2026 to USD 7.9 billion by 2036 at a 7.0% CAGR.
- As per Fact.MR analysis, the grid resilience monitoring services market reached USD 3.8 billion in 2025.
- Demand is projected to increase from USD 4.0 billion in 2026 to USD 7.9 billion by 2036.
- The market is forecast to record a 7.0% CAGR from 2026 to 2036 as utilities expand asset condition monitoring, event detection and remote service coverage.
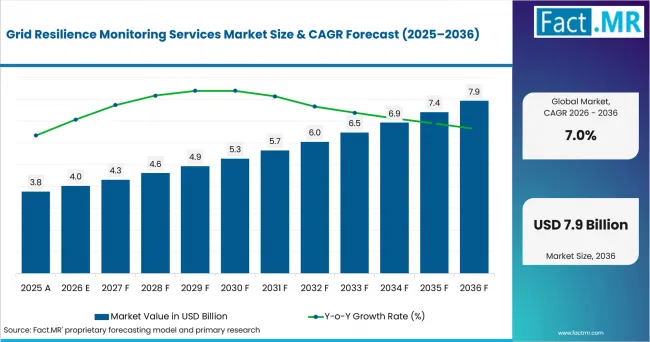
Grid Resilience Monitoring Services Market Value Analysis | Source: Fact.MR
What are the defining numbers behind Grid Resilience Monitoring Services Market growth?
As per Fact.MR analysis, an absolute opportunity of USD 3.9 billion is expected between 2026 and 2036.
- Demand Drivers in the Market
- Power grid operators need early warnings when new connections change power flow. In December 2025, Lawrence Berkeley National Laboratory reported that about 10,300 projects were waiting for U.S. grid connections at the end of 2024 [1].
- Utility teams need clear information about transformer and substation conditions. Early warnings help them find problems and plan repairs before they affect other equipment.
- Distribution grid teams need clear details about the location and size of outages. This helps control centers send field crews to the right place and restore power faster.
- Grid planners need monitoring data to decide which old or heavily used equipment needs work first. This helps them plan repairs, replacements, and service visits.
- Key Segments Analyzed
- By Service: Asset condition monitoring will hold 39.0% share in 2026 because grid firms need live health signals from equipment that otherwise depends on periodic inspection.
- By Grid Asset: Substation monitoring will account for 29.0% share in 2026 as substations bring several high-value grid assets into one grid site.
- By Analytics: Event detection will capture 36.0% share in 2026 since grid teams need unusual conditions recognized quickly and placed in context.
- By Delivery: Managed service will represent 32.0% share in 2026 owing to grid-firm demand for specialist support across daily grid operations.
- Analyst Opinion at Fact.MR
- Shambhu Nath Jha, Principal Consultant at Fact.MR, states, “Grid monitoring now focuses on finding which problem needs attention first instead of collecting more alerts. Utilities are expected to choose services that connect equipment condition, event details, and field response in one system. Providers need reliable sensors, clear data tools, and strong support so operators can trust the information during grid problems.”
- Strategic Implications
- Utilities can focus monitoring on transformers and substations where problems can affect the wider grid. In June 2025, NERC reported that transformer unavailability above 200 kV reached 0.28% in 2024 [2].
- Service companies can connect monitoring data with control centers and maintenance work. This helps teams use warnings to plan inspections or grid changes.
- Grid software can clearly show why an alert needs quick action. Clear information helps operators understand the problem and make faster decisions.
- Field service teams can use remote checks before sending workers to a site. This reduces unnecessary travel while keeping on-site checks when needed.
As per Fact.MR analysis, the UK is forecast to lead at 7.6% CAGR. Japan follows at 7.3%, the USA at 7.0%, Germany at 6.7% and France at 6.4%. Grid investment and asset renewal shape the differences among these markets.
How does the Grid Resilience Monitoring Services Market break down by segment?
As per Fact.MR analysis, Asset condition monitoring leads Service at 39.0%; Event detection leads Analytics at 36.0%.
Which Service segment dominates?
Asset condition monitoring is expected to hold 39.0% share in 2026.
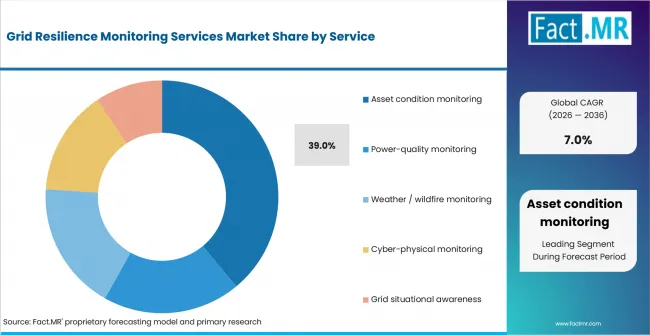
Grid Resilience Monitoring Services Market Analysis By Service | Source: Fact.MR
Asset condition monitoring is expected to lead because it helps utilities find equipment problems before they cause outages. Power-quality monitoring helps find voltage and power issues across the grid. Weather and wildfire monitoring gives control rooms more time to prepare for risks to power lines. Cyber-physical monitoring adds security information to grid alerts.
What leads the Grid Asset segment?
Substation monitoring is projected to account for 29.0% share in 2026.
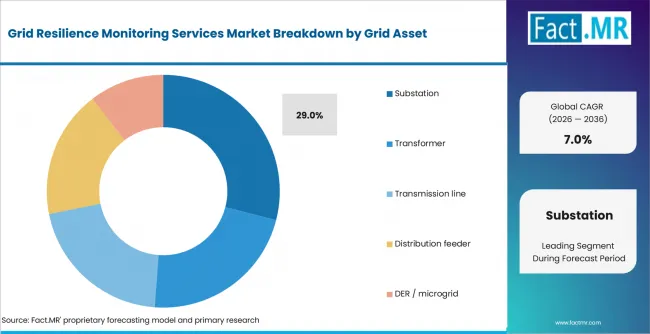
Grid Resilience Monitoring Services Market Analysis By Grid Asset | Source: Fact.MR
Substation monitoring is projected to lead because one site has several types of equipment that can affect a large part of the grid. Transformer monitoring helps engineers check equipment condition before planning maintenance. Transmission-line monitoring helps track line capacity and weather conditions.
How does Analytics shape demand?
Event detection is forecast to capture 36.0% share in 2026.
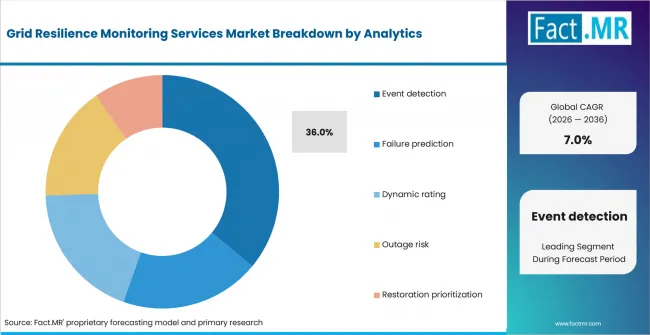
Grid Resilience Monitoring Services Market Analysis By Analytics | Source: Fact.MR
Event detection is anticipated to lead because operators need to find grid problems quickly and understand what is happening. In November 2025, the UK Department for Energy Security and Net Zero reported that the North Hyde substation fire disconnected 71,655 domestic customers in March 2025 [3].
What supports Managed Service within Delivery?
Managed service is forecast to represent 32.0% share in 2026.
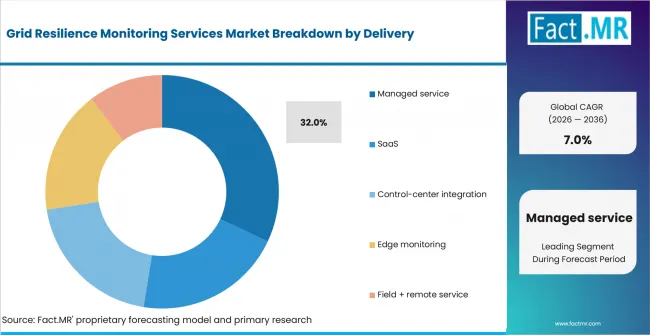
Grid Resilience Monitoring Services Market Analysis By Delivery | Source: Fact.MR
Managed services are forecast to lead because utilities can use expert monitoring and data analysis without handling everything in-house. SaaS gives teams one place to check grid data and alerts. Control-center integration connects these alerts with grid systems.
What is accelerating Grid Resilience Monitoring Services Market adoption, and what is holding it back?
Better equipment monitoring and faster response increase demand, while system costs and poor data quality can slow growth.
Drivers Impact Analysis
| DRIVER | (~) % IMPACT ON CAGR | GEOGRAPHIC RELEVANCE | IMPACT TIMELINE |
|---|---|---|---|
| Ageing grid assets and condition risk | +1.1% | North America, Western Europe | Short term (<= 2 years) |
| Extreme-weather and major-event readiness | +0.9% | North America, Western Europe, East Asia | Short term (<= 2 years) |
| Transmission and distribution investment | +0.8% | Global | Medium term (2-4 years) |
| Need for faster fault detection and restoration | +0.7% | Global | Medium term (2-4 years) |
| DER and bidirectional power-flow visibility | +0.5% | North America, Europe, East Asia | Long term (>= 4 years) |
Opportunity Impact Analysis
| OPPORTUNITY | (~) % IMPACT ON CAGR | GEOGRAPHIC RELEVANCE | IMPACT TIMELINE |
|---|---|---|---|
| Predictive asset-health service contracts | +0.7% | Global | Medium term (2-4 years) |
| Weather and wildfire risk monitoring | +0.6% | USA, Western Europe | Short term (<= 2 years) |
| Grid digital-twin and event correlation | +0.5% | North America, Europe, Japan | Medium term (2-4 years) |
| Managed monitoring for smaller utilities | +0.4% | Global | Long term (>= 4 years) |
Restraints Impact Analysis
| RESTRAINT | (~) % IMPACT ON CAGR | GEOGRAPHIC RELEVANCE | IMPACT TIMELINE |
|---|---|---|---|
| Legacy-system integration complexity | -0.7% | Global | Medium term (2-4 years) |
| Poor or inconsistent asset data | -0.6% | Global | Short term (<= 2 years) |
| Cybersecurity and remote-access limits | -0.5% | North America, Europe, Japan | Medium term (2-4 years) |
| Extended utility approval and validation cycles | -0.4% | Global | Long term (>= 4 years) |
Which countries are scaling the Grid Resilience Monitoring Services Market through 2036?
- The UK is expected to keep a 0.3-point lead over Japan, supported by transmission spending and resilience planning.
- Japan is projected to remain 0.3 points ahead of the USA, reflecting planned reinforcement of links between regions.
- The USA is forecast to stay 0.3 points above Germany, linked to grid pressure across a large and changing power system.
- Germany is forecast to hold a 0.3-point lead over France, supported by network spending and a broad installed grid base.
- France is expected to close the profiled range, shaped by grid renewal and weather adaptation work.
Grid resilience monitoring services market coverage includes North America, Latin America, Western Europe, Eastern Europe, East Asia, South Asia & Pacific, Middle East & Africa. Country growth varies with network age, grid policy and spending cycles.
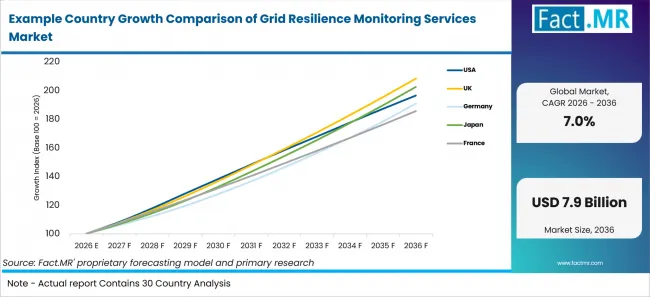
Example Country Growth Comparison Of Grid Resilience Monitoring Services Market | Source: Fact.MR
| Country | CAGR (2026-2036) |
|---|---|
| UK | 7.6% |
| Japan | 7.3% |
| USA | 7.0% |
| Germany | 6.7% |
| France | 6.4% |
What supports UK adoption?
7.6% CAGR, supported by resilience policy and transmission spending.
UK grid companies are increasing network capacity and improving the safety of major substations. On December 4, 2025, Ofgem approved £10.3 billion in initial funding for Britain’s electricity transmission network [4]. Monitoring services can help check equipment and respond to grid problems as this work begins.
How is Japan developing demand?
7.3% CAGR, shaped by network reinforcement and interregional transmission projects.
Japan is improving power lines between regions as grid connections and power flow become more complex. Equipment and line monitoring can help check grid conditions as these upgrades continue.
How is the USA scaling demand?
7.0% CAGR, supported by reliability risk and faster event response.
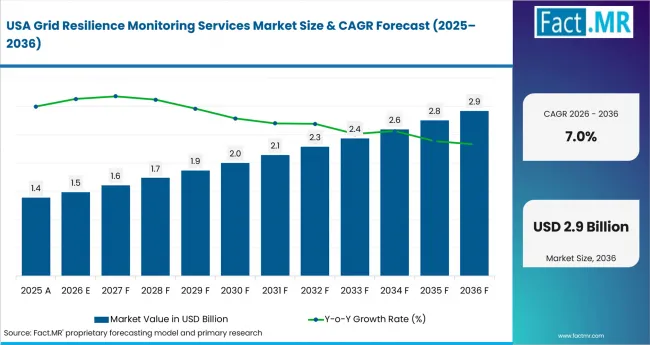
Grid Resilience Monitoring Services Market Country Value Analysis | Source: Fact.MR
U.S. utilities manage a large grid where power use keeps changing, making grid planning more difficult. On July 7, 2025, the U.S. Department of Energy said its modeled scenario could increase blackout frequency by up to 100 times by 2030 [5]. Monitoring services can help operators find grid problems earlier and respond faster.
What supports Germany adoption?
6.7% CAGR, supported by network spending and a large installed grid base.
German grid companies continue to track power cuts while improving grid equipment. On October 9, 2025, Bundesnetzagentur reported that 830 grid operators recorded 164,645 low- and medium-voltage power cuts in 2024 [6]. Grid and equipment monitoring can help find problems and plan maintenance.
How does France perform?
6.4% CAGR, supported by grid renewal and weather adaptation spending.
France is increase their spending on power lines as RTE replaces old equipment and prepares the grid for changing needs. On March 10, 2026, RTE reported EUR 3.346 billion in total investment for 2025 [7]. Equipment and weather monitoring can help plan grid upgrades and check grid conditions.
Who leads the Grid Resilience Monitoring Services Market?
GE Vernova offers GridOS for grid monitoring, data, and control. It helps utilities track grid conditions and respond to problems.
Hitachi Energy and Siemens Energy offer systems for monitoring substations, transformers, power lines, and other grid equipment.
Schneider Electric and ABB offer grid monitoring, software, and automation systems. Danovo Energy Solutions provides equipment monitoring, data analysis, and field support. Companies compete on accurate monitoring, fast problem detection, clear data, and easy connection with existing grid systems.
Which companies are the key providers?
Key companies include GE Vernova; Hitachi Energy; Siemens Energy; Schneider Electric; ABB; and Danovo Energy Solutions.
- GE Vernova
- Hitachi Energy
- Siemens Energy
- Schneider Electric
- ABB
- Danovo Energy Solutions
Bibliography
- [1] Rand, J., Manderlink, N., Zhang, S., Talley, C., Gorman, W., Wiser, R. H., Seel, J., Mulvaney Kemp, J., Jeong, S., & Kahrl, F. (2025, December). Queued Up: 2025 Edition, Characteristics of Power Plants Seeking Transmission Interconnection as of the End of 2024. Lawrence Berkeley National Laboratory.
- [2] North American Electric Reliability Corporation. (2025, June). 2025 State of Reliability: Technical Assessment.
- [3] Department for Energy Security and Net Zero. (2025, November 18). NESO’s North Hyde report: Government response.
- [4] Office of Gas and Electricity Markets. (2025, December 4). Ofgem unlocks £28 billion investment to maintain a safe, secure and resilient energy grid and to upgrade and expand capacity to meet growing demands.
- [5] U.S. Department of Energy. (2025, July 7). Department of Energy releases report on evaluating U.S. grid reliability and security.
- [6] Bundesnetzagentur. (2025, October 9). Electricity supply interruptions in 2024 shorter than in the previous year – Germany’s electricity grid one of the most reliable in a European comparison.
- [7] RTE. (2026, March 10). Résultats annuels 2025 : une activité en croissance pour moderniser le réseau et renforcer la souveraineté énergétique de la France [Annual results 2025: Activity growth to modernize the grid and strengthen France’s energy sovereignty].
- [8] GE Vernova. (2026, February 3). GE Vernova Launches GridOS® for Distribution, the Industry’s First Unified Solution for Grid Orchestration.
This Report Answers
- The report explains how grid resilience monitoring services are sold by service type, grid asset, analytics function and delivery model.
- Segment analysis identifies the leading 2026 subsegment in each dimension and explains the grid need behind its share. It also compares the other choices so the role of each service type is clear.
- Country analysis compares the UK, Japan, USA, Germany and France through grid events, grid spending and asset renewal. Each country view links one official data point with the local need for grid monitoring.
- Competitive analysis reviews GE Vernova, Hitachi Energy, Siemens Energy, Schneider Electric, ABB and Danovo Energy Solutions. The focus stays on grid monitoring, asset data tools, software and service work that fits the defined market.
- Technology analysis assesses asset condition monitoring, event detection, dynamic rating and restoration analytics within the service boundary.
What does the Grid Resilience Monitoring Services Market cover?
The market covers recurring and project-based services that track grid condition and grid risk. It includes asset condition monitoring, power-quality review, event detection, weather or wildfire monitoring, dynamic-rating analytics, outage-risk analysis and restoration prioritization when these functions are delivered as a service.
What is included in the scope?
The scope includes managed monitoring, SaaS delivery, control-center integration, edge monitoring and combined field plus remote service. It covers monitoring work tied to substations, transformers, transmission lines, distribution feeders and DER or microgrid assets. Adjacent Volt VAR management overlaps where monitoring supports voltage and reactive-power control.
Related grid resilience alliances cover coordination across utilities and public agencies where resilience work spans several organizations.
What is excluded from the scope?
The scope excludes standalone hardware sold without a service, electricity generation assets and grid construction work without condition or event analysis. General IT services fall outside the boundary unless they are directly tied to physical grid resilience.
How Was the Analysis Built?
The analysis draws on 120+ sources, 35+ company portfolios, 25+ countries, and more than 20 industry interviews.
- Primary Research: Primary research includes discussions with manufacturers, service providers, technology developers, distributors, end users, and subject-matter experts. These conversations examine purchasing priorities, product adoption, operational challenges, approval requirements, competitive positioning, and the factors that influence wider market acceptance.
- Desk Research: Desk research covers government statistics, regulatory publications, company filings, trade data, technical studies, industry associations, standards, public policy, and other authoritative sources. Every source used in the analysis is documented in the bibliography.
- Market Sizing and Forecasting: Market estimates combine historical performance, demand indicators, pricing and volume trends, segment shares, company participation, country-level growth, adoption patterns, investment activity, and barriers to market expansion.
- Data Validation and Update Cycle: Findings are validated by comparing primary interviews with public data, company activity, regulatory changes, trade patterns, and industry developments. Regular updates review new product launches, capacity changes, partnerships, approvals, and shifts in commercial adoption.
What is the report’s scope and coverage?
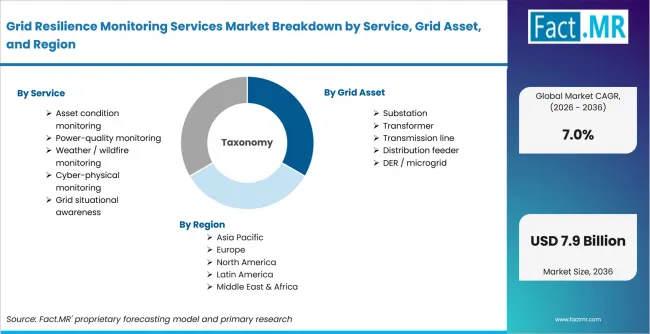
Grid Resilience Monitoring Services Market Breakdown By Service, Grid Asset, And Region | Source: Fact.MR
| Attribute | Details |
|---|---|
| Quantitative Units | USD billion |
| Market Definition | Services that monitor grid assets and operating conditions to improve resilience, including condition monitoring, power-quality monitoring, weather and wildfire monitoring, cyber-physical monitoring, situational awareness, analytics and remote or managed support. |
| Service | Asset condition monitoring; Power-quality monitoring; Weather / wildfire monitoring; Cyber-physical monitoring; Grid situational awareness |
| Grid Asset | Substation; Transformer; Transmission line; Distribution feeder; DER / microgrid |
| Analytics | Event detection; Failure prediction; Dynamic rating; Outage risk; Restoration prioritization |
| Delivery | Managed service; SaaS; Control-center integration; Edge monitoring; Field + remote service |
| Regions Covered | North America; Latin America; Western Europe; Eastern Europe; East Asia; South Asia & Pacific; Middle East & Africa |
| Countries Covered | UK; Japan; USA; Germany; France |
| Key Companies Profiled | GE Vernova; Hitachi Energy; Siemens Energy; Schneider Electric; ABB; Danovo Energy Solutions |
| Forecast Period | 2026 to 2036 |
| Approach | Hybrid top-down and bottom-up approach using grid investment signals, utility asset exposure, monitoring service mix, country growth, company participation and first-hand reliability evidence. |
How is the market segmented?
-
By Service:
- Asset condition monitoring
- Power-quality monitoring
- Weather / wildfire monitoring
- Cyber-physical monitoring
- Grid situational awareness
-
By Grid Asset:
- Substation
- Transformer
- Transmission line
- Distribution feeder
- DER / microgrid
-
By Analytics:
- Event detection
- Failure prediction
- Dynamic rating
- Outage risk
- Restoration prioritization
-
By Delivery:
- Managed service
- SaaS
- Control-center integration
- Edge monitoring
- Field + remote service
-
By Region:
- North America
- Latin America
- Western Europe
- Eastern Europe
- East Asia
- South Asia & Pacific
- Middle East & Africa