- Market Value (2025): USD 3.4 Bn
- Estimated Value (2026): USD 3.6 Bn
- Forecast Value (2036): USD 6.1 Bn
- CAGR (2026-2036): 5.5%
What is the Low-Carbon Fertilizers Market forecast to be worth by 2036?
USD 3.6 billion in 2026 to USD 6.1 billion by 2036, at 5.5% CAGR.
- The low-carbon fertilizers market crossed a valuation of USD 3.4 billion in 2025 as farms and crop-input dealers linked nutrient decisions to emissions reporting.
- Demand is projected to increase from USD 3.6 billion in 2026 to USD 6.1 billion by 2036.
- The market is forecast to record 5.5% CAGR from 2026 to 2036 as growers, cooperatives and food companies use lower-emission nitrogen programs to manage carbon claims.
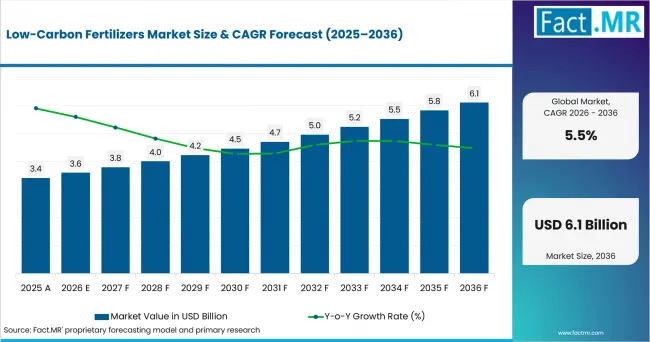
Low Carbon Fertilizers Market Value Analysis | Source: Fact.MR
What are the defining numbers behind Low-Carbon Fertilizers Market growth?
USD 2.5 billion absolute opportunity by 2036, led by Bio-Based Nitrogen Fertilizers, Agricultural Farms and Solid Fertilizer Formulations.
- Demand Drivers in the Market
- Growers need nitrogen products that fit normal crop calendars while reducing the emissions burden attached to fertilizer manufacture and field application.
- Agronomists require documented nutrient performance so lower-carbon inputs are compared with conventional fertilizer plans during seasonal recommendations.
- Cooperatives need direct agricultural sales models because verified lower-carbon fertilizer programs require grower records and product traceability.
- Food companies are expected to prefer crop-input programs that support emissions claims without forcing farmers to change their full fertility system.
- Key Segments Analyzed
- By Product: Bio-Based Nitrogen Fertilizers is expected to hold 58.90% share in 2026.
- By Application: Crop Production Applications is projected to account for 41.60% share in 2026.
- By End Use: Agricultural Farms is anticipated to capture 63.40% share in 2026.
- By Technology: Precision Nutrient Delivery Systems is estimated to represent 35.80% share in 2026.
- By Formulation: Solid Fertilizer Formulations is forecast to hold 52.70% share in 2026.
- By Distribution Channel: Direct Agricultural Sales is expected to account for 47.30% share in 2026.
- Analyst Opinion at Fact.MR
- Shambhu Nath Jha, Principal Consultant at Fact.MR, states, “Low-carbon fertilizers are drawing attention because nutrient choice is now part of food-chain carbon accounting. Adoption is expected to depend on verified carbon intensity, agronomic proof and dealer support.”
- Strategic Implications
- Fertilizer manufacturers should document production carbon intensity before offering premium crop nutrition contracts.
- Agro dealers should train agronomists to explain nutrient efficiency without making broad environmental claims.
- Food processors should align procurement language with farm records so crop inputs support product-level carbon reporting.
- Investors should separate low-carbon ammonia capacity from biological nutrient products because certification, agronomic proof and buyer acceptance differ.
The USA is expected to record 6.3% CAGR through 2036. Japan and the UK are projected to post 6.0%. Canada is estimated at 5.7%, while Germany is forecast at 5.5%.
How does the Low-Carbon Fertilizers Market break down by segment?
Bio-Based Nitrogen Fertilizers lead Product at 58.9%; Agricultural Farms lead End Use at 63.4%.
Which product dominates?
Bio-Based Nitrogen Fertilizers are projected to account for 58.9% share in 2026.
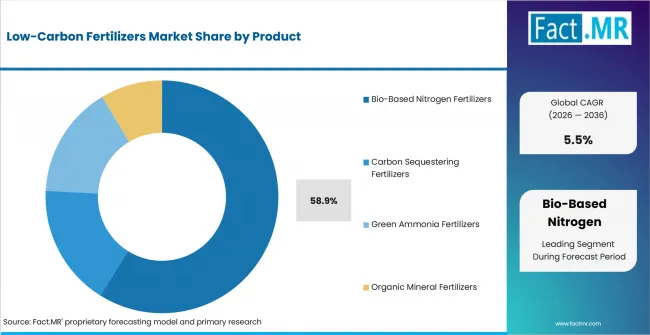
Low Carbon Fertilizers Market Analysis By Product | Source: Fact.MR
Bio-Based Nitrogen Fertilizers are projected to lead Product with 58.9% share in 2026 because growers already understand nitrogen’s role in crop productivity. Familiar agronomy practices support adoption, while established biofertilizer applications help these products move through existing farm-input channels with less change to nutrient-management routines.
What leads the Application segment?
Crop Production Applications are expected to hold 41.6% share in 2026.
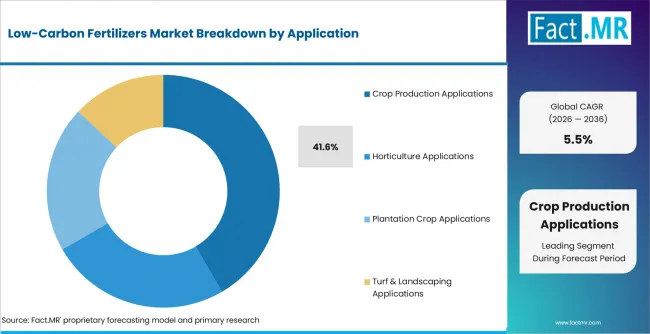
Low Carbon Fertilizers Market Analysis By Application | Source: Fact.MR
Crop Production Applications are expected to lead Application with 41.6% share in 2026 because cereal, oilseed and other field crops require measurable nutrient inputs across large acreages. This keeps organic fertilizer demand connected to repeat farm use, where application rates, crop response and nutrient efficiency can be monitored.
How does End Use shape demand?
Agricultural Farms are anticipated to capture 63.4% share in 2026.
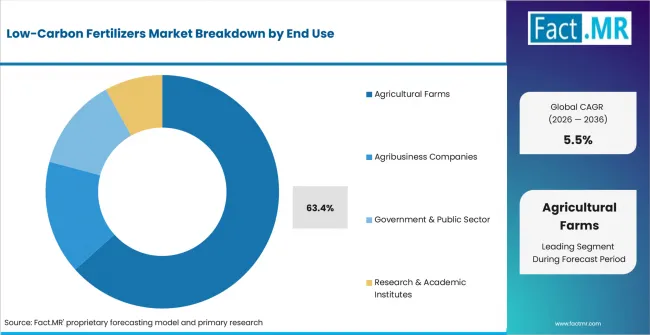
Low Carbon Fertilizers Market Analysis By End Use | Source: Fact.MR
Agricultural Farms are anticipated to lead End Use with 63.4% share in 2026 because field-level performance records directly influence fertilizer acceptance. Growers need documented evidence on nutrient response, application timing and crop outcomes, making agricultural biologicals more relevant when suppliers provide clear agronomic guidance and repeatable farm results.
What supports Technology demand?
Precision Nutrient Delivery Systems are estimated to represent 35.8% share in 2026.
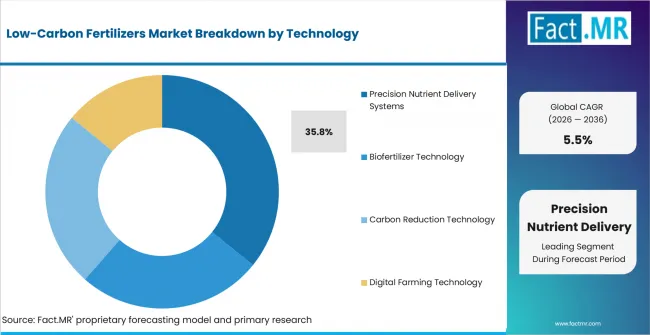
Low Carbon Fertilizers Market Analysis By Technology | Source: Fact.MR
Precision Nutrient Delivery Systems are estimated to lead Technology with 35.8% share in 2026 because growers increasingly value proof of nutrient rate, placement and timing. These systems support more controlled fertilizer use, while smart release fertilizers gain relevance where farms monitor nutrient loss, application efficiency and field-level performance.
Which formulation leads use?
Solid Fertilizer Formulations are forecast to hold 52.7% share in 2026.
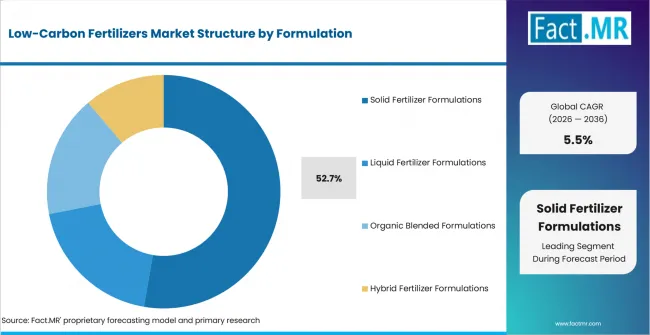
Low Carbon Fertilizers Market Analysis By Formulation | Source: Fact.MR
Solid Fertilizer Formulations are forecast to lead Formulation with 52.7% share in 2026 because granular products fit established farm equipment, storage and spreading practices. Their handling familiarity supports broad adoption, while soil carbon fertilizer blends provide suppliers with opportunities to differentiate products through nutrient and soil-performance positioning.
What leads Distribution Channel demand?
Direct Agricultural Sales are expected to account for 47.3% share in 2026.
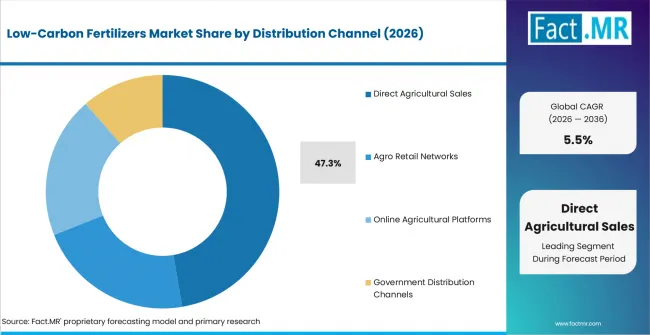
Low Carbon Fertilizers Market Analysis By Distribution Channel | Source: Fact.MR
Direct Agricultural Sales are expected to lead Distribution Channel with 47.3% share in 2026 because farm buyers often require certificates, technical guidance and consistent supply terms. Direct relationships support specification-led purchasing, while fertilizer additives and related inputs still benefit from dealer advice when growers compare application requirements.
What is accelerating Low-Carbon Fertilizers Market adoption, and what is holding it back?
Verified low-carbon nitrogen drives it; fertilizer cost and proof burden restrain it.
Drivers Impact Analysis
| DRIVER | (~) % IMPACT ON CAGR | GEOGRAPHIC RELEVANCE | IMPACT TIMELINE |
|---|---|---|---|
| Bio-based nitrogen substitution | +1.6% | USA, Japan, UK | Short term (<= 2 years) |
| Certified low-carbon ammonia | +1.3% | USA, Canada, Germany | Medium term (2-4 years) |
| Precision nutrient delivery | +1.0% | USA, UK, Germany | Medium term (2-4 years) |
| Food-chain carbon accounting | +0.8% | North America, Europe, Japan | Long term (>= 4 years) |
| Direct grower programs | +0.6% | USA and Canada | Short term (<= 2 years) |
- Bio-based nitrogen substitution: Bio-based nitrogen products are expected to gain where growers want lower-emission nutrient plans without changing full fertility systems.
- Certified low-carbon ammonia: Certified ammonia is projected to support nitrogen programs that require carbon-intensity documents from production to field use.
- Precision nutrient delivery: Precision systems are anticipated to raise adoption by linking rate, timing and placement data to nutrient-efficiency proof.
- Food-chain carbon accounting: Food companies ask for farm records that connect fertilizer choice to crop footprints, especially for grain-based supply chains.
- Direct grower programs: Direct agricultural sales improve documentation flow between manufacturers, cooperatives and farms, reducing proof gaps at purchase.
Opportunity Impact Analysis
| OPPORTUNITY | (~) % IMPACT ON CAGR | GEOGRAPHIC RELEVANCE | IMPACT TIMELINE |
|---|---|---|---|
| Green ammonia fertilizer supply | +1.1% | USA, Canada, Japan, Europe | Medium term (2-4 years) |
| Carbon sequestering blends | +0.9% | Germany, UK, Canada | Long term (>= 4 years) |
| Bio-waste derived formulations | +0.7% | Europe and Japan | Medium term (2-4 years) |
| Digital proof for nutrient programs | +0.5% | USA and UK | Short term (<= 2 years) |
- Green ammonia fertilizer supply: Lower-emission ammonia projects are expected to support green ammonia fertilizer programs where carbon certificates are required.
- Carbon sequestering blends: Humic and biochar blends give farms a nutrient route tied to soil-carbon goals and climate smart fertilizer positioning.
- Bio-waste derived formulations: Bio-waste inputs are forecast to expand where local organic resources are processed into documented fertilizer blends.
- Digital proof for nutrient programs: Digital farming tools connect product certificates, farm records and crop-buyer requirements in carbon-neutral nitrogen programs.
Restraints Impact Analysis
| RESTRAINT | (~) % IMPACT ON CAGR | GEOGRAPHIC RELEVANCE | IMPACT TIMELINE |
|---|---|---|---|
| Premium product pricing | -1.1% | Global | Short term (<= 2 years) |
| Yield-risk concerns | -0.9% | Commodity crop regions | Short term (<= 2 years) |
| Carbon verification burden | -0.7% | USA, Canada, Europe | Medium term (2-4 years) |
| Distribution complexity | -0.5% | Rural dealer networks | Medium term (2-4 years) |
- Premium product pricing: USDA ERS reported on March 27, 2025 that fertilizer constituted 33% to 44% of U.S. corn operating costs since 2020.
- Yield-risk concerns: Growers are expected to avoid unfamiliar bio-based nitrogen products when local field performance is not proven.
- Carbon verification burden: Batch certificates, farm records and application data raise administrative work for manufacturers, dealers and growers.
- Distribution complexity: Solid, liquid and suspension products need different handling, raising service cost for smaller agro dealers.
Which countries are scaling Low-Carbon Fertilizers Market fastest?
- The country comparison spans 0.8 percentage point and forms a narrow adoption range across the forecast period.
- The USA remains 0.3 percentage point above Japan through corn acreage, direct grower programs and certified nitrogen supply.
- Japan remains level with the UK at 6.0% CAGR through MIDORI certification and larger farm entities.
- The UK remains 0.3 percentage point above Canada through nutrient planning and cereal acreage.
- Canada remains 0.2 percentage point above Germany because agriculture emissions and fertilizer shipment tracking create a measurable carbon-accounting case.
- Germany closes the displayed range through organic acreage and crop-output scale.
Comparable CAGRs create different entry conditions because farm structure, fertilizer cost and emissions documentation differ by country. Low-Carbon Fertilizers Market is segmented into North America, Latin America, Europe, East Asia, South Asia and Pacific, and Middle East and Africa.
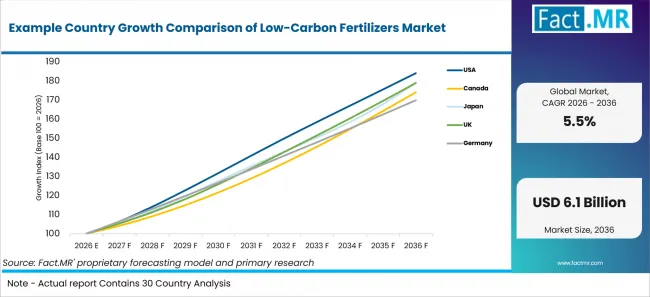
Example Country Growth Comparison Of Low Carbon Fertilizers Market | Source: Fact.MR
| Country | CAGR (2026-2036) |
|---|---|
| USA | 6.3% |
| Japan | 6.0% |
| UK | 6.0% |
| Canada | 5.7% |
| Germany | 5.5% |
What supports USA adoption?
6.3% CAGR, supported by corn acreage and certified low-carbon nitrogen programs.
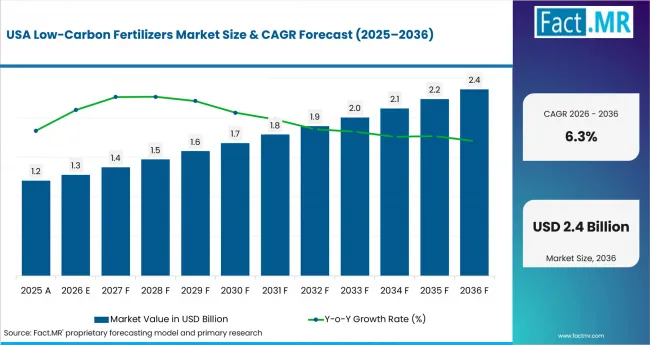
Low Carbon Fertilizers Market Country Value Analysis | Source: Fact.MR
USA growth is supported by large corn acreage and expanding climate-smart nutrient programs. USDA NASS estimated 95.2 million acres of corn planted in the United States in 2025, while NRCS updated its FY2025 Climate-Smart Agriculture and Forestry Mitigation Activities list with 14 new activities and continued to include nitrogen management among its mitigation categories. High fertilizer costs, limited local yield proof and documentation requirements may restrain premium low-carbon fertilizer adoption.
How is Japan scaling low-carbon fertilizer demand?
6.0% CAGR, driven by MIDORI policy recognition and farm consolidation.
Japan’s growth is supported by MIDORI policy adoption and increasing corporate farm participation. MAFF reported more than 27,000 certified MIDORI producer entities by March 2025, while corporate farm entities increased 10.1%. Shrinking cultivated area, yield-stability concerns and imported-energy exposure may slow adoption of lower-carbon fertilizer formulations.
What supports the UK outlook?
6.0% CAGR, shaped by nutrient planning and fertilizer-cost pressure.
UK growth reflects widespread nutrient planning and a sizeable cereal-production base. Defra reported that 64% of farmers in England had a nutrient management plan in 2025, while UK cereal production was just over 19.5 million tonnes. Falling fertilizer volumes, higher prices and uncertainty around routes to market may restrain adoption of premium low-carbon products.
How is Canada developing demand?
5.7% CAGR, led by Prairie nitrogen use and carbon-intensity accounting.
Canada’s growth is supported by Prairie crop production and increasing attention to fertilizer carbon intensity. Environment and Climate Change Canada reported that the Agriculture sector emitted 56 Mt CO₂ equivalent in 2024, accounting for 8.2% of Canada’s total greenhouse gas emissions. High fertilizer input costs, limited rewards for lower-carbon output and regional shipment gaps may constrain wider adoption outside major crop-producing provinces.
What underpins Germany’s growth?
5.5% CAGR, driven by organic acreage and crop-output scale.
Germany’s growth reflects substantial crop output and expanding organic production. Destatis reported 45 million tonnes of grain and 14 million tonnes of potatoes in 2025, while organic vegetable harvest reached 596,610 tonnes. Nutrient-rule administration, cheaper conventional contracts and documentation requirements may slow adoption of newer low-carbon fertilizer formulations.
Who leads the Low-Carbon Fertilizers Market?
Yara International, CF Industries, BASF SE and Fertiberia are among the companies profiled in this report for low-emission ammonia, biologicals and nutrient-efficiency activity.
Yara International and CF Industries connect low-emission ammonia with crop nutrition. BASF SE, Fertiberia and Nutrien add biological and nutrient-efficiency relevance. CF Industries started Donaldsonville CO2 sequestration in July 2025.
Lantmännen, EuroChem Group, ICL Group, K+S AG, OCP Group, FERTIGLOBE, PhosAgro Group, COMPO EXPERT GmbH and Uralkali add portfolio or distribution reach. Competition is expected to turn on verified carbon intensity and agronomic proof.
Which companies are the key providers?
Key companies include Yara International, BASF SE, Lantmännen, CF Industries Holdings, Fertiberia, EuroChem Group, ICL Group, K+S AG, OCP Group, Nutrien Ltd., FERTIGLOBE, PhosAgro Group, COMPO EXPERT GmbH, Uralkali.
- Yara International
- BASF SE
- Lantmännen
- CF Industries Holdings
- Fertiberia
- EuroChem Group
- ICL Group
- K+S AG
- OCP Group
- Nutrien Ltd.
- FERTIGLOBE
- PhosAgro Group
- COMPO EXPERT GmbH
- Uralkali
Bibliography
- CF Industries Holdings, Inc. (2026, January 26). CF Industries, POET, and major agriculture co-operatives launch low-carbon fertilizer pilot to cut ethanol production carbon intensity.
- CF Industries Holdings, Inc. (2025, July 14). CF Industries announces start-up of Donaldsonville Complex CO2 dehydration and compression unit, permanent CO2 sequestration.
- Department for Environment, Food & Rural Affairs. (2026, June 11). Nutrient management.
- Department for Environment, Food & Rural Affairs. (2026, July 29). Chapter 7: Crops. In Agriculture in the United Kingdom 2025.
- Department for Environment, Food & Rural Affairs. (2026, June 11). Total Factor Productivity of the United Kingdom agricultural industry in 2025.
- Environment and Climate Change Canada. (2026, April 14). Executive summary of the report: Greenhouse gas sources and sinks in Canada: 2026.
- Statistics Canada. (2026, April 10). Farm input price index, quarterly (Table 18-10-0258-01).
- Statistics Canada. (2026, March 3). Fertilizer Shipments Survey, first and second quarters 2025/2026.
- Statistics Canada. (2026, March 2). Fertilizer Shipments Survey: Detailed information for the first and second quarters of the 2025/2026 fertilizer year.
- Statistisches Bundesamt (Destatis). (2026, January 23). 2025 grain and potato harvest: 45 million tons of grain and 14 million tons of potatoes.
- Syngenta Group. (2026, March 31). Syngenta Group reports 2025 full year results.
- Yara International ASA. (2025, December 8). Air Products and Yara in advanced negotiations to partner on low-emission ammonia projects.
- U.S. Department of Agriculture, National Agricultural Statistics Service. (2025, June 30). Corn planted acreage up 5% from 2024, soybean acreage down 4% from last year.
This Report Addresses
- The report provides strategic intelligence on the Low-Carbon Fertilizers Market across product and application choices that shape crop nutrition programs.
- Segment analysis covers Bio-Based Nitrogen Fertilizers and Crop Production Applications as the 2026 share leaders.
- Country outlook evaluates the USA, Canada, Japan, the UK and Germany.
- Competitive analysis profiles Yara International, BASF SE, CF Industries Holdings, Fertiberia, Nutrien Ltd. and COMPO EXPERT GmbH.
- Technology assessment covers precision nutrient delivery, biofertilizer technology, carbon reduction technology and digital farming technology.
What does the Low-Carbon Fertilizers Market cover?
Low-carbon fertilizers cover crop nutrition products designed to reduce carbon intensity against conventional fertilizers.
The market covers bio-based nitrogen fertilizers, carbon sequestering fertilizers, green ammonia fertilizers and organic mineral fertilizers used across farming and horticulture.
What is included in the scope?
Low-carbon fertilizers are used across farms, agribusiness companies, public programs and research institutions.
The scope includes Product, Application, End Use, Technology, Formulation and Distribution Channel. It also covers specialty fertilizers where lower-carbon nutrient delivery is clear.
What is excluded from the scope?
Conventional commodity fertilizers without a lower-carbon production route or verified nutrient-efficiency claim are excluded.
The scope excludes crop protection products without nutrient value and soil amendments with no fertilizer function. General farm software is excluded unless it directly supports fertilizer selection, application records or nutrient verification.
How Was the Analysis Built?
The analysis draws on 120+ sources, 35+ company portfolios, 25+ countries and more than 20 industry interviews.
- Primary Research: Interviews with manufacturers, dealers, agronomists, cooperatives and growers examine purchasing priorities, field performance and approval requirements.
- Desk Research: Desk research covers government statistics, fertilizer-use data, company announcements, technical studies, public policy and authoritative sources.
- Market Sizing and Forecasting: Market estimates combine demand indicators, segment shares, country growth, company participation and adoption barriers.
- Data Validation and Update Cycle: Findings are validated against public data, company activity, regulatory changes and new product developments.
What is the report’s scope and coverage?
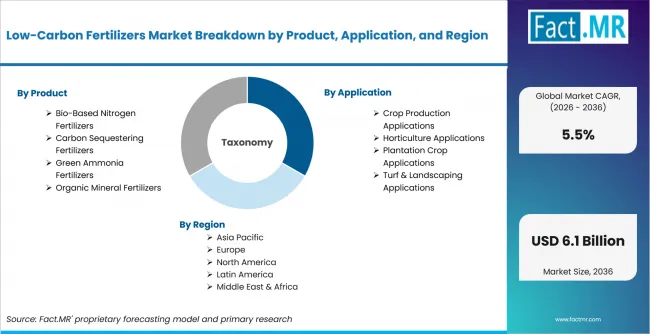
Low Carbon Fertilizers Market Breakdown By Product, Application, And Region | Source: Fact.MR
| Attribute | Details |
|---|---|
| Quantitative Units | USD billion |
| Market Definition | Fertilizer products and nutrient programs designed to lower the carbon burden of crop nutrition. |
| Product | Bio-Based Nitrogen Fertilizers; Carbon Sequestering Fertilizers; Green Ammonia Fertilizers; Organic Mineral Fertilizers |
| Application | Crop Production Applications; Horticulture Applications; Plantation Crop Applications; Turf & Landscaping Applications; Agricultural Soil Restoration |
| End Use | Agricultural Farms; Agribusiness Companies; Government & Public Sector; Research & Academic Institutes |
| Technology | Precision Nutrient Delivery Systems; Biofertilizer Technology; Carbon Reduction Technology; Digital Farming Technology |
| Formulation | Solid Fertilizer Formulations; Liquid Fertilizer Formulations; Organic Blended Formulations; Hybrid Fertilizer Formulations |
| Distribution Channel | Direct Agricultural Sales; Agro Retail Networks; Online Agricultural Platforms; Government Distribution Channels |
| Regions Covered | North America; Latin America; Europe; East Asia; South Asia and Pacific; Middle East and Africa |
| Countries Covered | USA; Canada; Japan; UK; Germany |
| Key Companies Profiled | Yara International; BASF SE; Lantmännen; CF Industries Holdings; Fertiberia; EuroChem Group; ICL Group; K+S AG; OCP Group; Nutrien Ltd.; FERTIGLOBE; PhosAgro Group; COMPO EXPERT GmbH; Uralkali |
| Forecast Period | 2026 to 2036 |
| Approach | Hybrid approach using crop needs, carbon-intensity evidence and company portfolio review. |
How is the market segmented?
-
By Product:
- Bio-Based Nitrogen Fertilizers
- Plant Derived Nitrogen Formulations
- Microbial Nitrogen Fixers
- Carbon Sequestering Fertilizers
- Humic Substance Fertilizers
- Biochar Based Fertilizers
- Green Ammonia Fertilizers
- Renewable Energy Based Ammonia
- Low Emission Ammonia Blends
- Organic Mineral Fertilizers
- Low Carbon Phosphate Fertilizers
- Low Carbon Potassium Fertilizers
- Bio-Based Nitrogen Fertilizers
-
By Application:
- Crop Production Applications
- Cereal Crop Cultivation
- Oilseed Cultivation
- Horticulture Applications
- Fruit Production Systems
- Vegetable Farming Systems
- Plantation Crop Applications
- Cash Crop Farming
- Fiber Crop Farming
- Turf & Landscaping Applications
- Commercial Landscaping
- Agricultural Soil Restoration
- Crop Production Applications
-
By End Use:
- Agricultural Farms
- Large Scale Farms
- Smallholder Farms
- Agribusiness Companies
- Agro Input Manufacturers
- Agricultural Trading Firms
- Government & Public Sector
- Agricultural Development Agencies
- Subsidy Driven Farming Programs
- Research & Academic Institutes
- Agricultural Research Centers
- University Agricultural Faculties
- Agricultural Farms
-
By Technology:
- Precision Nutrient Delivery Systems
- Controlled Release Technology
- Smart Fertilizer Dispersion
- Biofertilizer Technology
- Microbial Activation Systems
- Soil Microbiome Engineering
- Carbon Reduction Technology
- Carbon Capture Fertilizer Systems
- Green Chemistry Fertilization
- Digital Farming Technology
- IoT Soil Monitoring Systems
- Predictive Agriculture Platforms
- Precision Nutrient Delivery Systems
-
By Formulation:
- Solid Fertilizer Formulations
- Granular Fertilizers
- Powder Fertilizers
- Liquid Fertilizer Formulations
- Suspension Fertilizers
- Solution Based Fertilizers
- Organic Blended Formulations
- Compost Based Fertilizers
- Bio Waste Derived Formulations
- Hybrid Fertilizer Formulations
- Chemical Bio Hybrid Systems
- Solid Fertilizer Formulations
-
By Distribution Channel :
- Direct Agricultural Sales
- Farm Input Direct Supply
- Corporate Agribusiness Sales
- Agro Retail Networks
- Rural Agro Dealers
- Urban Agro Retail Chains
- Online Agricultural Platforms
- E Agriculture Marketplaces
- Manufacturer Direct Platforms
- Government Distribution Channels
- Subsidized Fertilizer Programs
- Rural Development Schemes
- Direct Agricultural Sales
-
By Region:
- North America
- Latin America
- Western Europe
- Eastern Europe
- East Asia
- South Asia and Pacific
- Middle East & Africa

