- Market Value (2025): USD 101.3 Mn
- Estimated Value (2026): USD 120.0 Mn
- Forecast Value (2036): USD 650.0 Mn
- CAGR (2026-2036): 18.4%
What is the Low-Carbon Peroxide Market forecast to be worth by 2036?
USD 120.0 million in 2026 to USD 650.0 million by 2036, at 18.4% CAGR.
- The low-carbon peroxide market crossed a valuation of USD 101.3 million in 2025 as lower-emission peroxide became a commercial supply option within the wider hydrogen peroxide industry.
- Demand is projected to increase from USD 120.0 million in 2026 to USD 650.0 million by 2036.
- The market is forecast to record an 18.4% CAGR from 2026 to 2036 as large industrial users add purchased-chemical emissions to vendor reviews without changing the peroxide chemistry used in their processes.
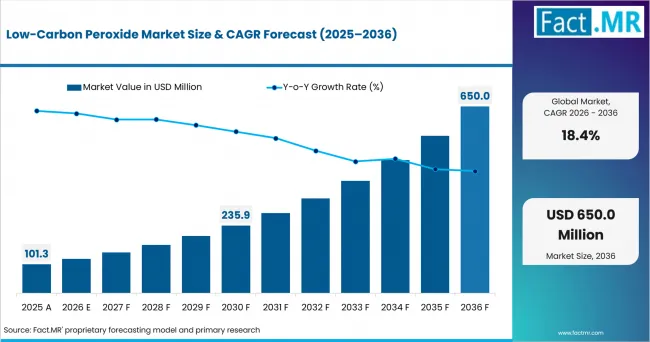
Low Carbon Peroxide Market Value Analysis | Source: Fact.MR
What are the defining numbers behind Low-Carbon Peroxide Market growth?
USD 530 million absolute opportunity is projected by 2036, led by Pulp bleaching and 35-50% within their respective segments.
- Demand Drivers in the Market
- Pulp and paper mills use large amounts of hydrogen peroxide. A lower-carbon grade can help them reduce the emissions linked to the chemicals they buy.
- Water-treatment plants use hydrogen peroxide for many cleaning and treatment tasks. This supports repeat demand for products with clear carbon records.
- Renewable electricity and fossil-free hydrogen can reduce emissions from production without changing the product strength or handling needs.
- Bulk delivery can cut emissions further through cleaner fuels and better route planning after the product leaves the factory.
- Key Segments Analyzed
- By End Use: Pulp Bleaching is expected to hold 36.0% share in 2026 supported by recurring bulk demand and closer tracking of process-chemical emissions.
- By Concentration: 35–50% is projected to account for 41.0% share in 2026 owing to its balance of active content, established storage practices, and familiar dosing requirements.
- By Carbon Reduction Route: Renewable Electricity is anticipated to capture 45.0% share in 2026 because lower-emission power reduces plant-level carbon intensity without changing peroxide specifications.
- By Delivery Mode: Bulk Tanker is estimated to represent 47.0% share in 2026 attributable to regular storage replenishment at high-volume industrial sites.
- By Buyer Type: Pulp & Paper Mills are forecast to account for 38.0% share in 2026 driven by large peroxide consumption, structured supply contracts, and on-site storage capacity.
- Analyst Opinion at Fact.MR
- Shambhu Nath Jha of Fact.MR states, “Low-carbon peroxide changes how companies buy a familiar industrial chemical. The product and its main uses stay the same, so clear carbon data is more important than a new product claim. Before choosing an offer, customers can compare how the footprint was measured and what type of hydrogen was used. Product strength and delivery emissions also need to be checked before a contract is awarded.”
- Strategic Implications
- Peroxide producers should publish product-carbon-footprint data on a consistent concentration basis so customers do not confuse diluted and active-content results.
- Pulp mills are expected to include delivered carbon intensity and supply resilience in tenders while retaining bleaching-performance requirements.
- Logistics providers have a direct role because tanker use and return movements affect the delivered footprint of a water-rich product.
- Distributors need rigorous inventory controls when conventional and low-carbon grades share storage or customer routes.
Nouryon launched Eka HP Puroxide in March 2025 as a low-carbon hydrogen peroxide product using fossil-free hydrogen and lower-carbon electricity. Evonik announced certified carbon-neutral hydrogen peroxide for European customers in April 2024 through its Way to GO2 certificate. Solvay announced in January 2024 that H2O2 shipments from Finland would shift to biofuel and cut transport CO2 emissions by more than 80%.
The United States is expected to register a 21.7% CAGR through 2036 as industrial accounts include producer carbon data in large contracts. Finland is projected at 19.9% because its pulp sector pairs renewable energy with efficient chemical logistics. Sweden is forecast at 19.5% because its low-carbon grid supports product-footprint claims for peroxide supply. Germany is anticipated to reach 19.1% as industrial accounts test product-footprint evidence through demanding purchasing controls. The Netherlands is estimated to advance at 18.6% as Rotterdam strengthens lower-carbon feedstock programs for nearby chemical users.
How does the Low-Carbon Peroxide Market break down by segment?
Pulp bleaching is projected to lead End Use at 36.0%, and 35-50% is expected to lead Concentration at 41.0% in 2026.
What leads the End Use segment?
Pulp Bleaching holds 36.0% share in 2026.
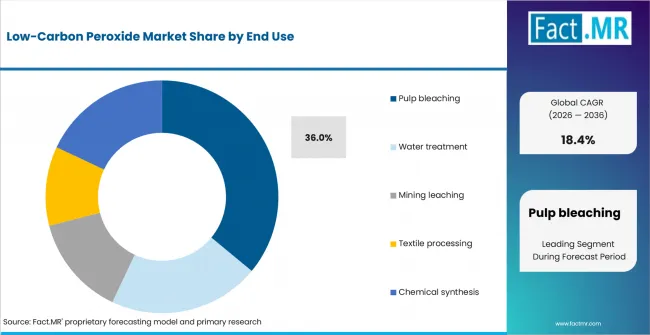
Low Carbon Peroxide Market Analysis By End Use | Source: Fact.MR
Pulp Bleaching is expected to lead because mills already use hydrogen peroxide in established bleaching systems and purchase it in large, recurring volumes. A lower-carbon grade fits the same oxidizing role, which allows mills to reduce the footprint of process chemicals without changing the basic bleaching route or rebuilding existing dosing systems.
Which Concentration band dominates?
35–50% accounts for 41.0% share in 2026.
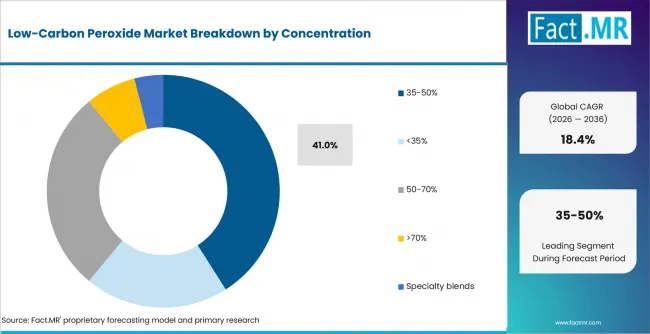
Low Carbon Peroxide Market Analysis By Concentration | Source: Fact.MR
The 35–50% band gives industrial users a practical balance between active peroxide content and familiar handling requirements. It supports regular transport, storage, and dosing without pushing every site toward the tighter controls needed for highly concentrated grades. This broad operating fit gives the range the strongest position in 2026.
Why does Renewable Electricity lead Carbon Reduction Route?
Renewable Electricity captures 45.0% share in 2026.
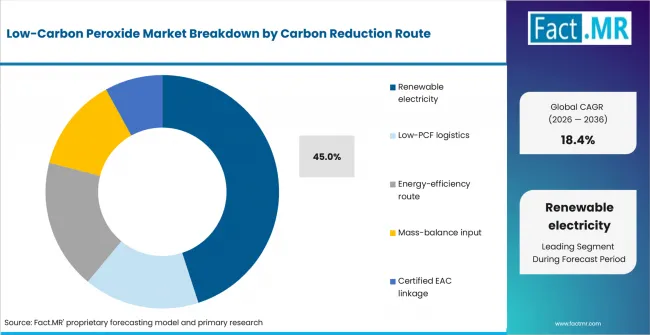
Low Carbon Peroxide Market Analysis By Carbon Reduction Route | Source: Fact.MR
Changing the electricity source lowers production emissions while leaving peroxide chemistry and customer specifications unchanged. Producers can apply this route across an existing plant and combine it with efficiency improvements or lower-carbon hydrogen. Its wide site-level effect and easier integration into current operations support the leading share.
What leads the Delivery Mode segment?
Bulk Tanker represents 47.0% share in 2026.
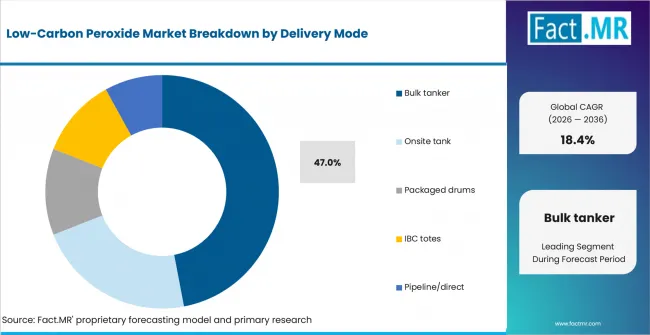
Low Carbon Peroxide Market Analysis By Delivery Mode | Source: Fact.MR
Large industrial sites use dedicated tanks and need regular peroxide replenishment. Bulk tanker delivery reduces packaging work and supports planned supply into existing storage systems. It also fits the volume needs of pulp mills and other major users better than drums or smaller containers, which keeps it ahead of other delivery formats.
Which Buyer Type holds the largest share?
Pulp & Paper Mills account for 38.0% share in 2026.
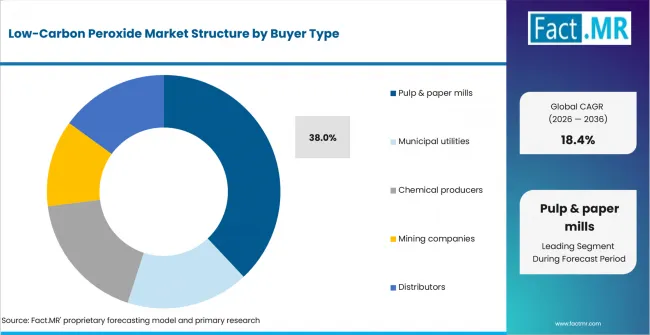
Low Carbon Peroxide Market Analysis By Buyer Type | Source: Fact.MR
Pulp and paper mills combine high peroxide use with site storage, scheduled deliveries, and long-term supply arrangements. Their purchasing teams also track the footprint of process chemicals more closely as mill-level emission targets become stricter. This mix of volume, infrastructure, and reporting needs places them at the front of buyer demand.
What is accelerating Low-Carbon Peroxide Market adoption, and what is holding it back?
Growth is supported by a lower-carbon version of a chemical that many industries already use. It can often fit into current processes without major changes. The main problem is that companies do not always measure carbon impact in the same way. Different production methods, power sources, hydrogen types, and delivery distances can also make supplier offers harder to compare.
Drivers Impact Analysis
| DRIVER | (~) % IMPACT ON CAGR | GEOGRAPHIC RELEVANCE | IMPACT TIMELINE |
|---|---|---|---|
| Pulp supply-chain decarbonization | +2.8% | Finland, North America, and Europe | Long term (>= 4 years) |
| Renewable plant power | +2.4% | Nordic markets, Europe, and other lower-carbon grids | Medium term (2-4 years) |
| Lower-carbon hydrogen | +2.0% | Europe and regions developing renewable hydrogen supply | Long term (>= 4 years) |
| Delivered-footprint tenders | +1.7% | Europe, United States, and export-oriented industrial buyers | Short term (<= 2 years) |
| Water-treatment expansion | +1.3% | United States, Germany, and the Nordic countries | Medium term (2-4 years) |
Source: Fact.MR analysis. Updated Jul 17, 2026
- Pulp supply-chain decarbonization: Pulp producers buy peroxide repeatedly through structured chemical contracts with recurring volume commitments. That purchasing concentration is expected to make grade-level carbon reduction easier to document than diffuse changes across many small inputs.
- Renewable plant power: Electricity is a practical lever for peroxide sites and related electrochemical operations. Producers with credible renewable sourcing can reduce product footprint while retaining the same active chemical specification.
- Lower-carbon hydrogen: Hydrogen origin affects upstream emissions in hydrogen peroxide manufacture and can alter the product footprint. Fossil-free or otherwise lower-carbon hydrogen is expected to create a differentiated grade without asking the buyer to alter its oxidation process.
Opportunity Impact Analysis
| OPPORTUNITY | (~) % IMPACT ON CAGR | GEOGRAPHIC RELEVANCE | IMPACT TIMELINE |
|---|---|---|---|
| Concentration-normalized PCF offers | +1.5% | Global | Short term (<= 2 years) |
| Low-carbon mill corridors | +1.3% | Finland, northern Europe, and integrated pulp regions | Medium term (2-4 years) |
| Mining and metals processing | +1.1% | Australia and the Americas | Long term (>= 4 years) |
| Distributor-certified packages | +0.9% | Fragmented specialty markets | Medium term (2-4 years) |
Source: Fact.MR analysis. Updated Jul 17, 2026
- Concentration-normalized PCF offers: Manufacturers can make comparisons easier by reporting both delivered-solution and active-peroxide footprint on a declared basis. Clear normalization helps customers avoid choosing a diluted product simply because its reported mass carries more water.
- Low-carbon mill corridors: Regional production and efficient bulk transport can be combined around clusters of pulp mills. A corridor approach is expected to turn plant decarbonization and logistics optimization into one customer offer.
- Mining and metals processing: Mining buyers use peroxide in selected leaching and treatment steps where site conditions determine demand. Producers can differentiate with safe bulk delivery and carbon evidence suited to project-level reporting for mines.
Restraints Impact Analysis
| RESTRAINT | (~) % IMPACT ON CAGR | GEOGRAPHIC RELEVANCE | IMPACT TIMELINE |
|---|---|---|---|
| Footprint comparability | -1.3% | Global | Short term (<= 2 years) |
| Renewable input availability | -1.0% | Global | Medium term (2-4 years) |
| Transporting water | -0.8% | Large or remote markets | Long term (>= 4 years) |
| Safety and infrastructure lock-in | -0.6% | Global | Medium term (2-4 years) |
Source: Fact.MR analysis. Updated Jul 17, 2026
- Footprint comparability: One producer may report at plant gate while another includes delivery in the declared boundary. Concentration can further distort a simple per-ton comparison when buyers compare aqueous peroxide solutions with different active content. Buyers need a common functional unit and boundary before ranking offers against one another in a tender process.
- Renewable input availability: Lower-carbon electricity and hydrogen are not equally available at every peroxide plant. Certified instruments may support an accounting route, but physical supply limits can still constrain product allocation and price.
- Transporting water: Aqueous peroxide moves substantial non-active mass, making distance and concentration central to delivered emissions. Remote customers may see logistics offset part of the production-side carbon advantage in delivered tenders.
Which countries anchor low-carbon peroxide demand?
United States 21.7%, Finland 19.9%, Sweden 19.5%, Germany 19.1%, Netherlands 18.6%
The regional review focuses on North America and Europe, where low-carbon peroxide products are already more visible. The country analysis covers the United States and four European countries with active commercial use. The full report applies the same review across more than 30 countries.
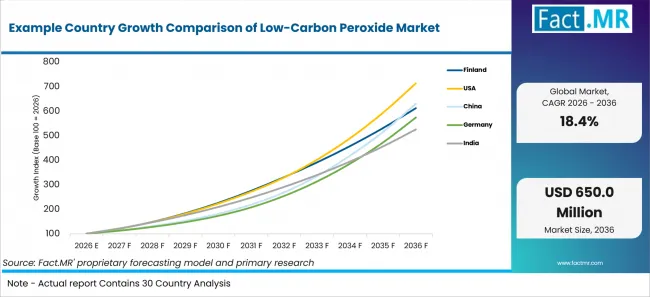
Example Country Growth Comparison Of Low Carbon Peroxide Market | Source: Fact.MR
| COUNTRY | CAGR |
|---|---|
| United States | 21.7% |
| Finland | 19.9% |
| Sweden | 19.5% |
| Germany | 19.1% |
| Netherlands | 18.6% |
Source: Fact.MR analysis. Updated Jul 17, 2026
Why does the United States lead low-carbon peroxide growth?
21.7% CAGR, driven by bulk peroxide demand and clearer carbon reporting in large contracts.
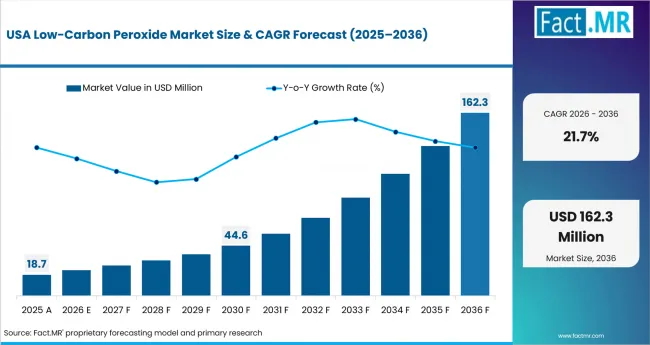
Low Carbon Peroxide Market Country Value Analysis | Source: Fact.MR
The United States already has strong demand for bulk hydrogen peroxide, which gives lower-carbon grades a ready customer base. Buyers are asking for clearer proof of emissions linked to the product they purchase. The market is forecast to grow at a 21.7% CAGR from 2026 to 2036. Reliable tanker delivery and clear carbon data per unit of active peroxide are expected to remain important for large contracts.
Why is Finland important for low-carbon peroxide?
19.9% CAGR, supported by pulp production, renewable energy, and reliable regional delivery.
Finland has a large pulp industry that uses hydrogen peroxide in high volumes. This creates a clear opening for products made with lower-carbon energy in the Nordic region. The market is projected to expand at a 19.9% CAGR from 2026 to 2036. Buyers are likely to focus on verified plant emissions, dependable winter supply, and efficient bulk delivery to mills located farther from production sites.
Why does Sweden fit low-carbon peroxide supply?
19.5% CAGR, driven by pulp and chemical demand linked to low-carbon electricity.
Sweden combines high peroxide use in pulp and paper with access to low-carbon power. This gives locally made or nearby peroxide a lower starting footprint. Demand is forecast to rise at a 19.5% CAGR between 2026 and 2036. Mills that already track emissions from purchased chemicals can show a clear reduction when they switch to a verified lower-carbon grade.
How is Germany expected to assess low-carbon peroxide offers?
19.1% CAGR, supported by strict quality checks and clear carbon records.
German chemical plants and water-treatment companies are likely to favor products with steady quality and clear carbon records. The market is forecast to register a 19.1% CAGR from 2026 to 2036. Independent checks and simple explanations of how renewable electricity is counted are expected to help producers pass internal purchasing reviews.
What supports growth in the Netherlands?
18.6% CAGR, driven by Rotterdam’s chemical base and demand for lower-carbon raw materials.
The Netherlands has many peroxide users located close to chemical and water-treatment sites. This short distance supports efficient bulk delivery. Demand is projected to grow at an 18.6% CAGR from 2026 to 2036. Producers that can clearly show how green hydrogen is sourced through port programs are likely to receive more interest from industrial customers.
Who leads the Low-Carbon Peroxide Market?
Nouryon and Evonik lead through verified lower-carbon hydrogen peroxide offers, while Solvay strengthens the field through lower-emission logistics and established peroxide supply.
Nouryon has introduced hydrogen peroxide made with fossil-free hydrogen and lower-carbon electricity for Nordic customers. Evonik offers certified product-footprint reductions through its Way to GO2 program, giving European industrial users clearer carbon information without changing the peroxide used in their processes. Solvay adds a different route by reducing transport emissions for hydrogen peroxide deliveries from Finland. These companies compete through production method, certification, regional availability, and dependable supply to large industrial sites.
Arkema and Mitsubishi Gas Chemical complete the profiled company set through established hydrogen peroxide portfolios and application coverage. Their position depends on the ability to connect lower-carbon production claims with familiar concentrations, safe delivery, and consistent product quality. Competition through 2036 is expected to focus on verified carbon data, renewable energy use, lower-emission transport, and reliable supply across pulp, water-treatment, chemical, and mining applications.
Which companies are the key providers?
The company set includes Nouryon; Solvay; Evonik; Arkema; and Mitsubishi Gas Chemical as defined in the market scope.
- Nouryon
- Solvay
- Evonik
- Arkema
- Mitsubishi Gas Chemical
Bibliography
- Nouryon. (2025, March 18). Nouryon becomes first Nordic supplier to launch low-carbon footprint hydrogen peroxide.
- Evonik Industries AG. (2024, April 11). Evonik offers certified carbon-neutral hydrogen peroxide.
- Solvay. (2024, January 23). Solvay reduces its transportation carbon footprint in Finland.
- Department for Energy Security and Net Zero. (2025, July 23). Hydrogen update to the market: July 2025.
- Department of Chemicals and Petrochemicals. (2025, December 22). Chemical and petrochemical statistics at a glance 2025. Ministry of Chemicals and Fertilizers, Government of India.
This Report Answers
- The report explains how factory energy use and the type of hydrogen used in production affect low-carbon peroxide purchases. It also shows how product strength and delivery distance can change the final carbon result.
- The country review compares the United States with Finland and Sweden. Germany and the Netherlands are also covered through their industrial demand and chemical transport networks.
- The company review covers Nouryon, Solvay, Evonik, Arkema, and Mitsubishi Gas Chemical.
- The carbon review separates the effect of renewable power, cleaner delivery, and better factory efficiency. It also covers mass-balance methods and energy certificates where company records support the claim.
- The end-use review includes pulp bleaching, water treatment, mining, textile processing, and chemical production.
- The forecast links plant output and delivery programs with expected contract demand. Product strength and customer carbon goals are checked before lower-carbon sales are included in the forecast.
What does the Low-Carbon Peroxide Market cover?
The market covers hydrogen peroxide products carrying a documented production or delivered-carbon advantage over conventional supply.
The report measures low-carbon peroxide value across end use and concentration exactly as defined in the source data. Carbon-reduction route and delivery mode are assessed under the same boundary used for revenue sizing. Buyer type is reviewed separately to show which industrial accounts purchase the eligible lower-carbon grade. Results are expressed on the sold peroxide product and exclude downstream pulp or water output. Mining and textile output value is outside the market boundary used in this report. Chemical output value is also excluded from the reported market size calculation.
What is included in the scope?
Included products span bulk and packaged hydrogen peroxide solutions supported by product-footprint or logistics carbon evidence.
The boundary includes the <35% and 35-50% concentration bands along with 50-70% and >70% grades. Specialty-blend supply is included when it matches the stated peroxide applications and documented carbon route. Delivery coverage includes tankers and onsite tanks used by large industrial accounts with fixed storage. Drums and IBC totes are covered where they match the defined peroxide applications and customer handling needs. Direct or pipeline delivery is included only when producer and customer assets are closely linked. Eligible reduction routes are renewable electricity and lower-PCF logistics with documented allocation or delivery evidence. Energy efficiency and mass-balance input are also included where producers document the claim. Certified EAC linkage is included when the attribution route is clearly stated for the product.
Buyer coverage comprises pulp & paper mills and municipal utilities within the defined market scope. Chemical producers and mining companies are included when peroxide is tied to the listed applications. Distributors are included where they sell eligible grades into the same industrial customer base and maintain claim traceability.
What is excluded from the scope?
Undifferentiated conventional peroxide and other peroxide chemistries are excluded from the market boundary used for this report.
The scope does not include the full value of bleached pulp and treated water produced by customers. Mined metals and textile output are also outside the market boundary used for sizing. General corporate emissions reductions are excluded unless they are tied to a specific peroxide grade. The producing site or attributed input must be clear before the claim enters. Delivery programs are counted only when the link to peroxide supply is documented in the evidence file.
How Was the Analysis Built?
The analysis draws on 120+ sources, 35+ company portfolios, 25+ countries, and more than 20 industry interviews.
- Primary Research: Primary research includes discussions with manufacturers, service providers, technology developers, distributors, end users, procurement teams, and subject-matter experts. These conversations examine purchasing priorities, product adoption, operational challenges, approval requirements, competitive positioning, and the factors that influence wider market acceptance.
- Desk Research: Desk research covers government statistics, regulatory publications, company filings, trade data, technical studies, industry associations, standards, public policy, and other authoritative sources. Every source used in the analysis is documented in the bibliography.
- Market Sizing and Forecasting: Market estimates combine historical performance, demand indicators, pricing and volume trends, segment shares, company participation, country-level growth, adoption patterns, investment activity, and barriers to market expansion.
- Data Validation and Update Cycle: Findings are validated by comparing primary interviews with public data, company activity, regulatory changes, trade patterns, and industry developments. Regular updates review new product launches, capacity changes, partnerships, approvals, procurement trends, and shifts in commercial adoption.
Segmentation
What is the report's scope and coverage?
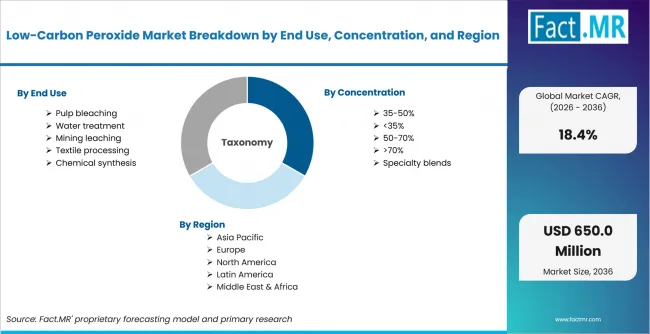
Low Carbon Peroxide Market Breakdown By End Use, Concentration, And Region | Source: Fact.MR
| ATTRIBUTE | DETAILS |
|---|---|
| Quantitative Units | USD million in 2026 to USD million by 2036 at a CAGR |
| Market Definition | The market covers hydrogen peroxide solutions and specialty blends sold with a documented lower product or delivered carbon footprint through renewable electricity, lower-carbon hydrogen or inputs, energy efficiency, mass balance, certified energy attributes, or lower-PCF logistics. |
| End Use | Pulp bleaching; Water treatment; Mining leaching; Textile processing; Chemical synthesis |
| Concentration | 35-50%; <35%; 50-70%; >70%; Specialty blends |
| Carbon Reduction Route | Renewable electricity; Low-PCF logistics; Energy-efficiency route; Mass-balance input; Certified EAC linkage |
| Delivery Mode | Bulk tanker; Onsite tank; Packaged drums; IBC totes; Pipeline/direct |
| Buyer Type | Pulp & paper mills; Municipal utilities; Chemical producers; Mining companies; Distributors |
| Regions Covered | North America; Europe; Asia Pacific; Latin America; Middle East and Africa |
| Countries Covered | United States; Finland; Sweden; Germany; Netherlands (analysis on 30+ countries in the full report) |
| Key Companies Profiled | Nouryon; Solvay; Evonik; Arkema; Mitsubishi Gas Chemical |
| Forecast Period | 2026 to 2036 |
| Approach | Sizing combines low-carbon peroxide solution volumes, active-content concentration, grade and logistics premiums, delivery mode, eligible site output, and adoption across the five end uses. |
Source: Fact.MR analysis. Updated Jul 17, 2026
How is the market segmented?
-
By End Use
- Pulp bleaching
- Water treatment
- Mining leaching
- Textile processing
- Chemical synthesis
-
By Concentration
- 35-50%
- <35%
- 50-70%
- >70%
- Specialty blends
-
By Carbon Reduction Route
- Renewable electricity
- Low-PCF logistics
- Energy-efficiency route
- Mass-balance input
- Certified EAC linkage
-
By Delivery Mode
- Bulk tanker
- Onsite tank
- Packaged drums
- IBC totes
- Pipeline/direct
-
By Buyer Type
- Pulp & paper mills
- Municipal utilities
- Chemical producers
- Mining companies
- Distributors
-
By Region
- North America
- United States
- Europe
- Finland
- Sweden
- Germany
- Netherlands
Frequently Asked Questions
Which end use leads demand?
Which concentration band has the largest share?
Which carbon-reduction route leads?
Which delivery mode is most common?
Which markets lead adoption?
Why should peroxide footprints be normalized for concentration?
Who worked on this report


Preview the report firsthand - request a free sample
Free SampleGet the brochure for pricing and purchase details
Download PDF