- Market Value (2025): USD 2,356.0 Bn
- Estimated Value (2026): USD 2,700.0 Bn
- Forecast Value (2036): USD 10,549.0 Bn
- CAGR (2026-2036): 14.6%
What is the M-Commerce Payment Market forecast to be worth by 2036?
USD 2,700.0 billion in 2026 to USD 10,549.0 billion by 2036 at 14.6% CAGR.
- The m-commerce payment market was valued at USD 2,356.0 billion in 2025 as mobile checkout became a routine route for online retail and app-based service purchases.
- Demand is projected to rise from USD 2,700.0 billion in 2026 to USD 10,549.0 billion by 2036.
- The market is forecast to record 14.6% CAGR from 2026 to 2036 owing to wider wallet use and deeper retail checkout integration.
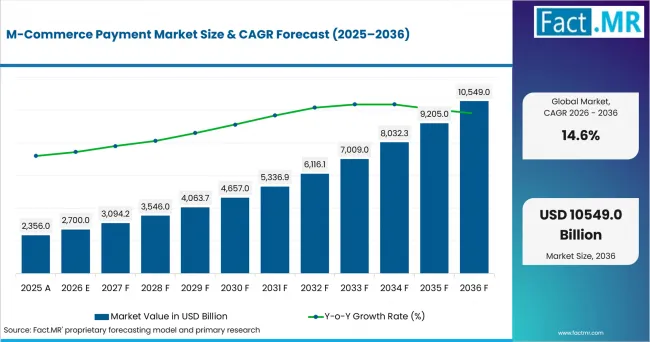
M Commerce Payment Market Value Analysis | Source: Fact.MR
What are the defining numbers behind M-Commerce Payment Market growth?
USD 7,849.0 billion absolute opportunity is expected by 2036.
- Demand Drivers in the Market
- Mobile wallet payments are expected to support repeat checkout where consumers prefer stored credentials and clear approval inside retail apps.
- Retailers need e-commerce payment routes that keep order confirmation simple and reduce drop-off during mobile checkout.
- Individual consumers remain central to demand since personal device use makes mobile payment a normal step in daily buying.
- Mobile applications are expected to remain the main distribution route where digital wallet systems can manage sign-in and payment approval together.
- Key Segments Analyzed
- By Product Type: Mobile Wallet Payments are projected to hold 35.6% share in 2026 because they give users a familiar stored-payment route.
- By Application: Retail & E-commerce is expected to account for 31.0% share in 2026 as mobile checkout becomes central to digital carts and repeat orders.
- By End User: Individual Consumers are anticipated to capture 30.2% share in 2026 since personal device use remains the core demand base.
- By Distribution Channel: Mobile Applications are estimated to represent 31.2% share in 2026 due to their role in direct checkout and account control.
- By Payment Method: Digital Wallets are forecast to hold 42.7% share in 2026 as card credentials and bank access move into mobile interfaces.
- Analyst Opinion at Fact.MR
- Shambhu Nath Jha, Principal Consultant at Fact.MR, states “M-commerce payment suppliers must make checkout faster without hiding security steps. Adoption is expected to depend on wallet trust and merchant integration through the mobile journey.”
- Strategic Implications
- Retailers should treat wallet acceptance as part of checkout design. Contactless payment infrastructure becomes useful when the same credentials work across app, web and store purchases.
- Payment providers can strengthen proposals by showing how fraud review fits normal order flow. A payment gateway gains relevance when merchants see clearer settlement records.
- Investors should compare wallet scale with merchant acceptance depth. Buy now pay later becomes useful only when repayment controls and checkout placement support repeat mobile purchases.
Germany leads at 19.0% CAGR, followed by Brazil at 17.5%. The USA, Australia, Canada and the UK show steady growth through wallet use, app commerce and banking innovation. Japan records 13.1% CAGR as reliability and established payment habits slow migration.
How does the M-Commerce Payment Market break down by segment?
Mobile Wallet Payments are expected to lead Product Type at 35.6% share in 2026. Retail & E-commerce is projected to lead Application at 31.0% share in 2026.
Why does Mobile Wallet Payments lead Product Type?
Mobile Wallet Payments are projected to account for 35.6% share in 2026.
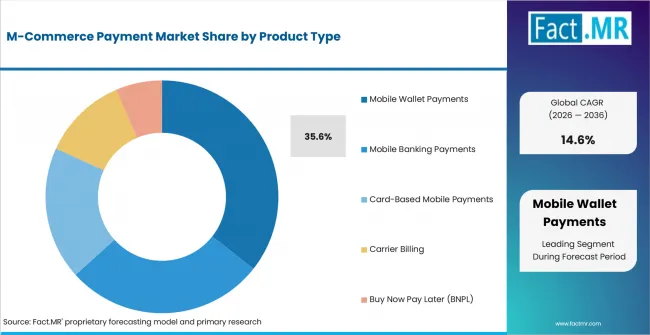
M Commerce Payment Market Analysis By Product Type | Source: Fact.MR
Stored credentials make wallets easier to repeat. NFC wallets remain useful where merchant acceptance is visible. Mobile banking payment links support users that prefer bank-led control.
Why does Retail & E-commerce lead Application?
Retail & E-commerce is expected to hold 31.0% share in 2026.
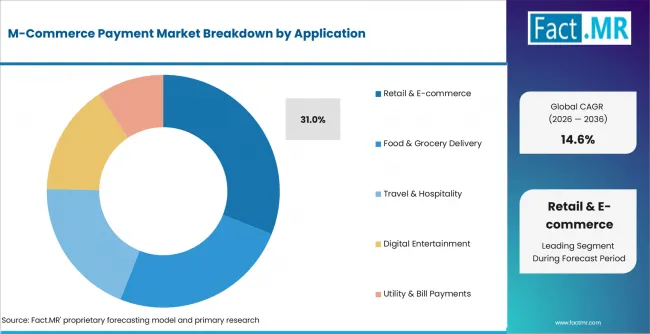
M Commerce Payment Market Analysis By Application | Source: Fact.MR
Retailers gain value when payment supports cart recovery. Online shopping creates frequent mobile checkout moments. In-app purchases and food delivery add repeat use when payment stays inside the buying flow.
Why do Individual Consumers lead End User?
Individual Consumers are anticipated to represent 30.2% share in 2026.
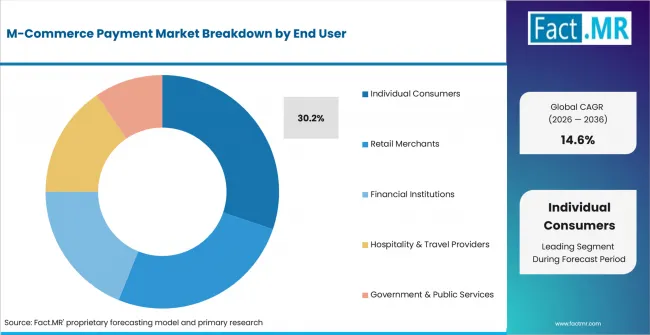
M Commerce Payment Market Analysis By End User | Source: Fact.MR
Personal device ownership gives consumers the largest role. Smartphone users set the main use pattern through daily apps. Retail merchants respond when checkout choices affect conversion.
What supports Mobile Applications within Distribution Channel?
Mobile Applications are estimated to account for 31.2% share in 2026.
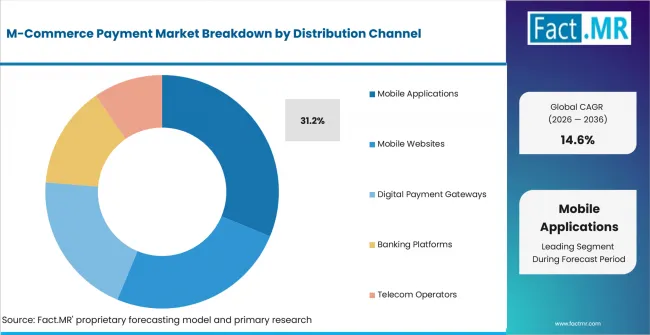
M Commerce Payment Market Analysis By Distribution Channel | Source: Fact.MR
Apps give providers direct control over sign-in and approval. Native mobile apps keep payment inside the purchase journey. Super apps widen use when payment appears beside shopping features.
What supports Digital Wallets within Payment Method?
Digital Wallets are forecast to hold 42.7% share in 2026.
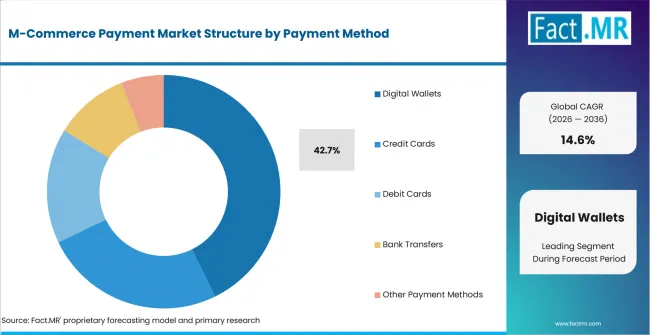
M Commerce Payment Market Analysis By Payment Method | Source: Fact.MR
Digital wallets lead when users can save one funding source and reuse it. Apple Pay and Google Pay support device-led acceptance. Cards remain central behind many wallet transactions.
What is accelerating M-Commerce Payment Market adoption, and what is holding it back?
Demand is expected to rise with wider use of mobile wallets and app-based shopping. High integration costs and fraud risks may slow adoption.
Drivers Impact Analysis
| DRIVER | QUALITATIVE RELEVANCE | GEOGRAPHIC RELEVANCE | IMPACT TIMELINE |
|---|---|---|---|
| Mobile wallet checkout habit | High | Germany and USA | Short term (<= 2 years) |
| Retail and e-commerce integration | High | Brazil and Germany | Short term (<= 2 years) |
| App-based account control | Moderate | Australia and Canada | Medium term (2-4 years) |
| Merchant authentication readiness | Selective | Japan and UK | Medium term (2-4 years) |
Source: Fact.MR analysis. Updated Jul 31, 2026
- Mobile wallet checkout habit: Repeat purchases are expected to increase the value of stored credentials and simple approval.
- Retail and e-commerce integration: Merchants need payment steps that fit cart design without sending users away from checkout.
- App-based account control: Payment providers are likely to favor channels where onboarding and dispute messages remain easy to manage.
- Merchant authentication readiness: Sellers can expand wallet acceptance when security prompts are clear and payment failures stay low.
Opportunity Impact Analysis
| OPPORTUNITY | QUALITATIVE RELEVANCE | GEOGRAPHIC RELEVANCE | IMPACT TIMELINE |
|---|---|---|---|
| Checkout orchestration services | High | Germany and USA | Medium term (2-4 years) |
| Security-led wallet upgrades | Moderate | UK and Japan | Medium term (2-4 years) |
| Mobile banking payment links | Selective | Brazil and Australia | Long term (>= 4 years) |
| Cross-border wallet acceptance | Selective | Canada and travel corridors | Long term (>= 4 years) |
Source: Fact.MR analysis. Updated Jul 31, 2026
- Checkout orchestration services: Providers that help merchants route wallet and card payments are expected to gain more account access.
- Security-led wallet upgrades: Tokenization and fraud detection tools are expected to create upgrade demand where merchants need safer mobile approval.
- Mobile banking payment links: Bank-led payment routes can help users who prefer account control over stored card credentials.
- Cross-border wallet acceptance: Travel and marketplace sellers are expected to favor providers that keep payment approval familiar across countries.
Restraints Impact Analysis
| RESTRAINT | QUALITATIVE RELEVANCE | GEOGRAPHIC RELEVANCE | IMPACT TIMELINE |
|---|---|---|---|
| Integration complexity and switching cost | High | Global merchants | Short term (<= 2 years) |
| Fraud and dispute exposure | Moderate | USA, UK, Canada | Short term (<= 2 years) |
| Fee pressure in retail checkout | Moderate | Brazil and Germany | Medium term (2-4 years) |
| Uneven wallet acceptance | Selective | Japan and smaller merchants | Long term (>= 4 years) |
Source: Fact.MR analysis. Updated Jul 31, 2026
- Integration complexity and switching cost: Merchants may delay wallet upgrades when payment routing affects checkout code and settlement records.
- Fraud and dispute exposure: Providers must prove that faster checkout does not weaken identity checks or chargeback control.
- Fee pressure in retail checkout: Retailers can resist premium payment options when acceptance cost is not matched by conversion gains.
- Uneven wallet acceptance: Smaller merchants may wait until customer demand and point-of-sale terminals justify the change.
Which countries are scaling M-Commerce Payment Market fastest?
- Germany leads, while Brazil ranks second through strong mobile-first payment use. The USA and Australia form the next group, supported by merchant upgrades and mobile banking habits.
- Canada and the UK follow measured paths shaped by service consistency, regulation and payment testing. Japan grows slowest as reliability and consumer habits delay migration.
- Across markets, supplier success depends on secure checkout integration, merchant support and smooth mobile purchasing experiences at scale.
The full report provides country-level CAGR analysis across North America and Latin America. It covers Europe and East Asia along with South Asia and Oceania plus the Middle East and Africa.
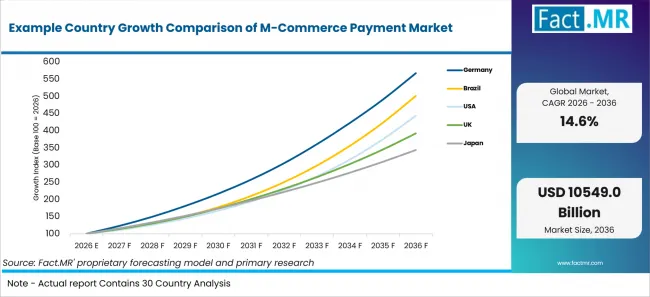
Example Country Growth Comparison Of M Commerce Payment Market | Source: Fact.MR
| Country | CAGR (2026-2036) |
|---|---|
| Germany | 19.0% |
| Brazil | 17.5% |
| USA | 16.1% |
| Australia | 10.2% |
| Canada | 11.7% |
| UK | 14.6% |
| Japan | 13.1% |
Source: Fact.MR analysis. Updated Jul 31, 2026
What supports Germany adoption?
16.8% CAGR, supported by wallet acceptance and regulated merchant approval.
German merchants are expected to review payment security before changing checkout systems. Mobile Wallet Payments gain approval when settlement clarity is visible before contracts move ahead.
How is Brazil scaling demand?
15.3% CAGR, driven by mobile-first retail and app-led payment use.
Brazilian demand comes from consumers that use mobile channels for shopping and routine services. Retail & E-commerce rewards easier checkout and local merchant support.
What supports USA adoption?
13.9% CAGR, backed by app commerce and merchant checkout upgrades.
USA growth is shaped by a mature card ecosystem where wallets must prove added convenience. Merchant acceptance decides whether wallets become a default route during repeat purchases.
How does Australia build demand?
13.1% CAGR, supported by mobile banking familiarity and secure app usage.
Australia’s outlook reflects comfort with digital banking and contactless payment routines. Mobile Applications support onboarding and account alerts outside major urban markets.
What shapes Canada’s outlook?
12.7% CAGR, led by wallet service reach and merchant dependability.
Canada’s growth is influenced by merchants that need consistent service across large operating areas. Digital Wallets gain when consumers see reliable acceptance across retail chains.
How does the UK perform?
12.4% CAGR, supported by account-based payment testing and regulatory fit.
UK demand is expected to move through merchants that compare wallet acceptance with account-based alternatives. Providers that explain risk controls plainly are likely to gain more retailer attention.
What supports Japan’s growth?
10.9% CAGR, backed by reliability requirements and gradual consumer migration.
Japan’s growth is slower because customers and merchants place high value on payment reliability. Retail & E-commerce still gives wallet providers a repeat-use route when app performance is stable.
Who leads the M-Commerce Payment Market?
PayPal Holdings, Apple Inc. and Google LLC show the clearest direct relevance through wallet and device-led payment exposure. Block Inc. supports merchant payment tools. Stripe, Adyen and Visa Inc. widen the provider field.
PayPal Holdings supports online and mobile checkout through consumer accounts. Apple Inc. and Google LLC add device-based wallet reach. Block Inc. serves small businesses. Stripe, Adyen and Visa Inc. support routing and card network depth. From 2026 to 2036, competition is expected to depend on checkout reliability. Retailers are likely to compare provider cost with conversion gains. Providers that explain settlement behavior clearly may gain demand from merchants and fintech platforms.
Which companies are the key providers?
Key companies include PayPal Holdings; Apple Inc.; Google LLC; Block Inc.; Stripe; Adyen; and Visa Inc.
- PayPal Holdings
- Apple Inc.
- Google LLC
- Block Inc.
- Stripe
- Adyen
- Visa Inc.
Bibliography
- Bank of England, & HM Treasury. (2024, January 25). Bank of England and HM Treasury respond to digital pound consultation.
- Payment Systems Regulator. (2024, July 12). Publishing APP fraud data: A guide for payment service providers.
- PayPal Holdings, Inc. (2024, January 25). PayPal and Venmo unveil six new innovations to revolutionize commerce.
- Google LLC. (2024, June 27). How device tokens keep your payment cards safe in Google Wallet.
This Report Answers
- The report provides strategic intelligence on the M-Commerce Payment Market across Product Type and Application choices.
- Segment analysis covers Mobile Wallet Payments and Retail & E-commerce as the 2026 share leaders.
- Country outlook evaluates Germany and Brazil alongside USA and Australia. Canada, the UK and Japan complete the growth comparison.
- Competitive analysis profiles PayPal Holdings and Apple Inc. Google LLC; Block Inc.; Stripe; Adyen and Visa Inc. complete the provider set.
- Payment-method assessment covers Digital Wallets, card-based mobile payments and mobile banking payment routes.
What does the M-Commerce Payment Market cover?
M-Commerce Payment covers payments completed through mobile devices for retail purchases and app services. Coverage extends to shopping and bill payment when the final payment step occurs through a mobile route.
The market includes wallet use and app checkout. It differs from general fintech revenue because value comes from mobile payment completion.
What is included in the scope?
The scope includes Product Type and Application alongside End User, Distribution Channel and Payment Method. Coverage spans mobile wallets and QR wallets. Mobile banking payments and card-based mobile payments complete product scope.
The scope includes retail and e-commerce. Online shopping, in-app purchases and food delivery are covered when payment is completed on a mobile device.
What is excluded from the scope?
General corporate software and unrelated banking infrastructure remain outside scope. Non-mobile payment activity is excluded when the purchase is not completed through a mobile route.
Hardware-only terminal spending is excluded unless it supports mobile wallet acceptance. General fintech revenue is excluded when no mobile commerce payment role is present.
How Was the Analysis Built?
The analysis draws on 120+ sources, 35+ company portfolios, 25+ countries, and more than 20 industry interviews.
- Primary Research: Primary research includes discussions with manufacturers, service providers, technology developers, distributors, end users, procurement teams, and subject-matter experts. These conversations examine purchasing priorities, product adoption, operational challenges, approval requirements, competitive positioning, and the factors that influence wider market acceptance.
- Desk Research: Desk research covers government statistics, regulatory publications, company filings, trade data, technical studies, industry associations, standards, public policy, and other authoritative sources. Every source used in the analysis is documented in the bibliography.
- Market Sizing and Forecasting: Market estimates combine historical performance, demand indicators, pricing and volume trends, segment shares, company participation, country-level growth, adoption patterns, investment activity, and barriers to market expansion.
- Data Validation and Update Cycle: Findings are validated by comparing primary interviews with public data, company activity, regulatory changes, trade patterns, and industry developments. Regular updates review new product launches, capacity changes, partnerships, approvals, procurement trends, and shifts in commercial adoption.
Segmentation
What is the report’s scope and coverage?
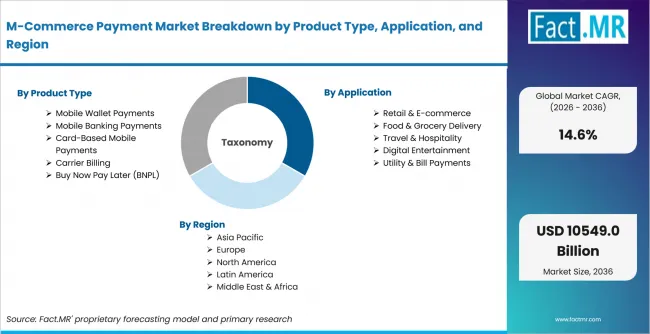
M Commerce Payment Market Breakdown By Product Type, Application, And Region | Source: Fact.MR
| Metric | Value |
|---|---|
| Quantitative Units | USD billion in 2026 to USD billion by 2036 at CAGR |
| Market Definition | Commercial payment activity completed through mobile devices and app-based checkout systems where wallet access, authentication and merchant acceptance determine purchase completion |
| Product Type | Mobile Wallet Payments; NFC Mobile Wallets; QR Code Wallets; Mobile Banking Payments; Card-Based Mobile Payments; Carrier Billing; Buy Now Pay Later (BNPL) |
| Application | Retail & E-commerce; Online Shopping; In-App Purchases; Food & Grocery Delivery; Travel & Hospitality; Digital Entertainment; Utility & Bill Payments |
| End User | Individual Consumers; Smartphone Users; Tablet Users; Retail Merchants; Financial Institutions; Hospitality & Travel Providers; Government & Public Services |
| Distribution Channel | Mobile Applications; Native Mobile Apps; Super Apps; Mobile Websites; Digital Payment Gateways; Banking Platforms; Telecom Operators |
| Payment Method | Digital Wallets; Apple Pay; Google Pay; Credit Cards; Debit Cards; Bank Transfers; Other Payment Methods |
| Regions Covered | North America; Latin America; Europe; East Asia; South Asia and Oceania; Middle East and Africa |
| Countries Covered | Germany; Brazil; USA; Australia; Canada; UK; Japan |
| Key Companies Profiled | PayPal Holdings; Apple Inc.; Google LLC; Block Inc.; Stripe; Adyen; Visa Inc. |
| Forecast Period | 2026 to 2036 |
| Approach | Hybrid top-down and bottom-up assessment using payment demand indicators; segment mix; country adoption; merchant acceptance; app usage; company participation; checkout integration; wallet trust; fraud controls; settlement behavior and service coverage |
Source: Fact.MR analysis. Updated Jul 31, 2026
How is the market segmented?
-
By Product Type:
- Mobile Wallet Payments
- NFC Mobile Wallets
- QR Code Wallets
- Mobile Banking Payments
- Card-Based Mobile Payments
- Carrier Billing
- Buy Now Pay Later (BNPL)
-
By Application:
- Retail & E-commerce
- Online Shopping
- In-App Purchases
- Food & Grocery Delivery
- Travel & Hospitality
- Digital Entertainment
- Utility & Bill Payments
-
By End User:
- Individual Consumers
- Smartphone Users
- Tablet Users
- Retail Merchants
- Financial Institutions
- Hospitality & Travel Providers
- Government & Public Services
-
By Distribution Channel:
- Mobile Applications
- Native Mobile Apps
- Super Apps
- Mobile Websites
- Digital Payment Gateways
- Banking Platforms
- Telecom Operators
-
By Payment Method:
- Digital Wallets
- Apple Pay
- Google Pay
- Credit Cards
- Debit Cards
- Bank Transfers
- Other Payment Methods
-
By Region:
- North America
- Latin America
- Europe
- East Asia
- South Asia and Oceania
- Middle East and Africa
Frequently Asked Questions
Which Product Type leads the market?
Which Distribution Channel leads the market?
Which Payment Method leads the market?
Which country records the highest listed CAGR?
What is the primary driver in this market?
What is the main restraint?
Why do Individual Consumers lead demand?
Who worked on this report


Preview the report firsthand - request a free sample
Free SampleGet the brochure for pricing and purchase details
Download PDF