- Market Value (2025): USD 169.4 Mn
- Estimated Value (2026): USD 200.0 Mn
- Forecast Value (2036): USD 1050.0 Mn
- CAGR (2026-2036): 18.0%
What is the Mass-Balanced TPU Market forecast to be worth by 2036?
USD 200 million in 2026 to USD 1,050.0 million by 2036 at 18.0% CAGR.
- The mass-balanced TPU market reached a valuation of USD 169.4 million in 2025, reflecting the shift from pilot activity to certified commercial portfolios and customer programs.
- Demand is projected to increase from USD 200.0 million in 2026 to USD 1,050.0 million by 2036.
- The market is forecast to record an 18.0% CAGR from 2026 to 2036 as manufacturers adopt lower-fossil-attribution materials without redesigning established components.
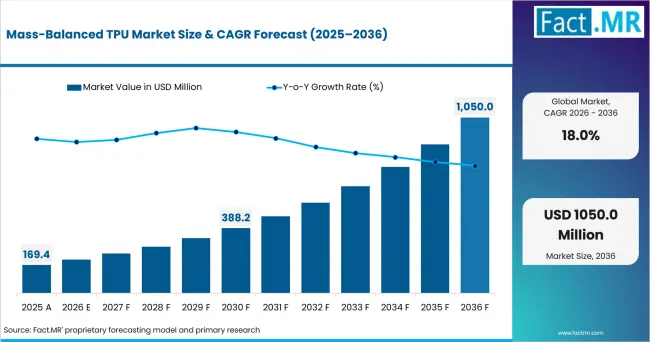
Mass Balanced Tpu Market Value Analysis | Source: Fact.MR
What are the defining numbers behind Mass-Balanced TPU Market growth?
USD 850 million absolute opportunity by 2036 led by Footwear components and Bio-attributed supply within their respective segments.
- Demand Drivers in the Market
- Footwear makers use TPU because it bends well and resists wear in soles and surface films. Matching mass-balanced grades also let them keep using the same molds and approved films.
- Electronics and automotive companies can switch to attributed renewable or recycled inputs without changing their usual molding or film settings.
- ISCC PLUS and similar systems give purchasing staff a clear way to track the material claim through shared production sites.
- Medical-device use may grow where manufacturers provide steady product quality, clear records, and a full review of any material change before approval.
- Key Segments Analyzed
- By Application: Footwear Components are estimated to account for 29.0% share in 2026 supported by high TPU use, seasonal product programs, and strict fit and appearance requirements.
- By Feedstock Route: Bio-attributed TPU is projected to hold 34.0% share in 2026 owing to certified allocation of renewable raw materials through shared production systems.
- By Hardness Grade: Soft Elastomeric TPU is anticipated to capture 32.0% share in 2026 driven by flexibility, cushioning, and repeated-bending requirements across footwear and protective components.
- By Processing Form: Pellets are estimated to hold 57.0% share in 2026 attributable to their compatibility with established extrusion and molding equipment across a broad converting base.
- By Certification Route: ISCC PLUS is forecast to account for 50.0% share in 2026 supported by a recognized chain-of-custody framework for shared chemical production assets.
- Analyst Opinion at Fact.MR
- Shambhu Nath Jha, Senior Analyst at Fact.MR, states, " A strong mass-balanced TPU product has to meet three conditions. It must run like the usual grade, perform well in the final use, and carry a claim that can be checked. Before approval, product staff need clear details on the raw material used, how the claim was assigned, and which plant and grade are covered."
- Strategic Implications
- TPU makers have to match certificate details with the exact product name before any claim reaches customers. Sales material must also make clear when the renewable or recycled share is assigned through records instead of being physically separated in every batch.
- Footwear companies are likely to start with visible parts such as films and soles before changing larger product lines. Protective parts may also move earlier when an approved TPU grade already meets the required performance.
- Even when a mass-balanced grade is described as a direct replacement, processing and quality records still matter. These records show whether the material performs the same way during actual production.
- Medical and electronics customers must review raw material claims separately from safety and purity checks. Fire resistance and electrical performance also require their own test records and approval documents.
Germany is expected to register a 21.3% CAGR from 2026 to 2036 as polymer expertise and formal sourcing rules support certified grade adoption. The United States is projected to follow at a 19.8% CAGR over the same forecast period through footwear and medical programs. Electronics and automotive programs add further qualification routes for matched resin grades. Italy is estimated at an 18.5% CAGR while the Netherlands is anticipated to reach a 17.9% CAGR. Vietnam is forecast to advance at an 18.8% CAGR from 2026 to 2036 as export shoe production translates brand targets into purchasing decisions.
How does the Mass-Balanced TPU Market break down by segment?
Footwear components are projected to lead Application at 29.0% share in 2026, while Bio-attributed is forecast to lead Feedstock Route at 34.0% share.
Which Application leads demand?
Footwear Components hold 29.0% share in 2026.
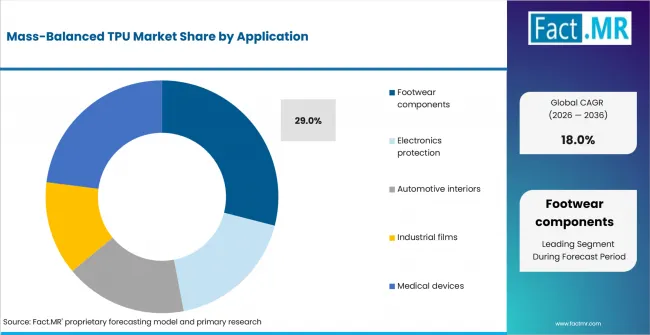
Mass Balanced Tpu Market Analysis By Application | Source: Fact.MR
Footwear Components are estimated to hold 29.0% share in 2026, reflecting the heavy use of TPU in soles, overlays, protective sections, and other flexible parts. These products depend on abrasion resistance, cushioning, and repeated bending performance. Mass-balanced grades fit established footwear programs when processing behavior remains unchanged and certified feedstock records stay intact from resin production through component manufacturing.
What leads the Feedstock Route segment?
Bio-attributed TPU accounts for 34.0% share in 2026.
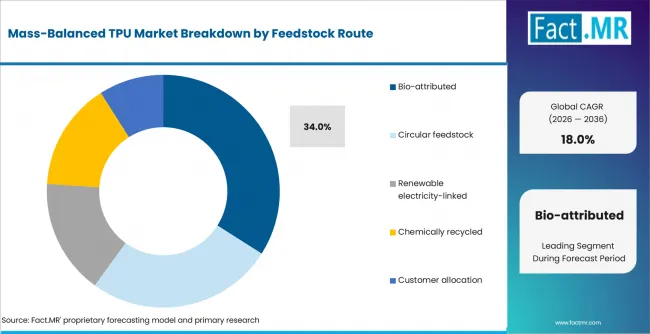
Mass Balanced Tpu Market Analysis By Feedstock Route | Source: Fact.MR
Bio-attributed TPU is projected to account for 34.0% share in 2026 through renewable raw materials introduced into shared chemical production systems. Certified bookkeeping connects eligible input volumes with saleable TPU output without requiring physical separation of every batch. This approach gives producers a practical route to lower-fossil claims while maintaining existing plants, formulations, and customer-qualified product specifications.
Which Hardness Grade dominates?
Soft Elastomeric TPU represents 32.0% share in 2026.
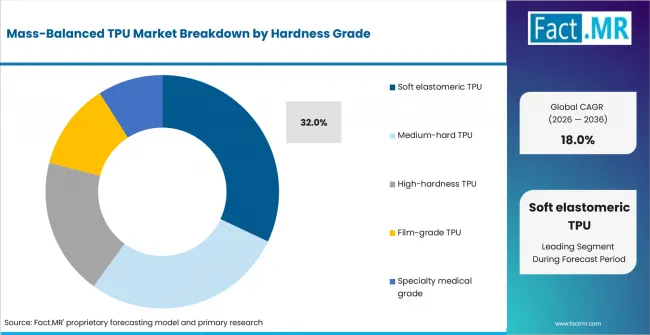
Mass Balanced Tpu Market Analysis By Hardness Grade | Source: Fact.MR
Soft Elastomeric TPU is anticipated to represent 32.0% share in 2026, with flexibility and recovery supporting its use in cushioning, films, cable protection, and soft-touch parts. These grades withstand repeated deformation without losing their original shape. Their broad fit across footwear and protective applications gives them a stronger volume base than harder grades designed for more rigid or load-bearing components.
What leads the Processing Form segment?
Pellets hold 57.0% share in 2026.
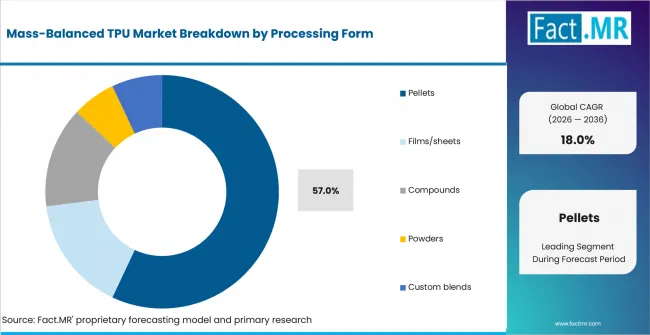
Mass Balanced Tpu Market Analysis By Processing Form | Source: Fact.MR
Pellets are estimated to hold 57.0% share in 2026 since they enter existing extrusion and injection-molding lines with limited operational change. Processors can continue using familiar drying, conveying, and dosing systems when the mass-balanced grade matches the approved conventional resin. This compatibility gives pellets the widest route into commercial production and reduces the qualification burden for converters adopting attributed materials.
Which Certification Route holds the largest share?
ISCC PLUS accounts for 50.0% share in 2026.
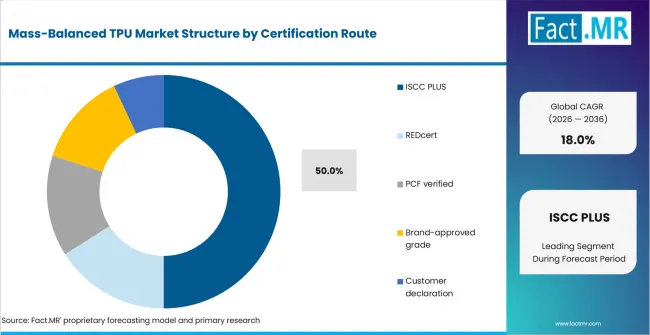
Mass Balanced Tpu Market Analysis By Certification Route | Source: Fact.MR
ISCC PLUS is forecast to account for 50.0% share in 2026 through a widely recognized chain-of-custody system for shared chemical assets. The framework reconciles certified inputs and attributed outputs while keeping claim boundaries clear. Its broad acceptance across producers, processors, and customers makes it easier to transfer mass-balance evidence through the value chain than narrower brand approvals or customer-specific declarations.
What is accelerating Mass-Balanced TPU Market adoption, and what is holding it back?
Adoption is restrained when allocation claims and certificate scope remain unclear. Premiums or downstream custody gaps are expected to prevent a brand or OEM from defending the claim.
Drivers Impact Analysis
| DRIVER | (~) % IMPACT ON CAGR | GEOGRAPHIC RELEVANCE | IMPACT TIMELINE |
|---|---|---|---|
| Drop-in footwear conversion | +2.7% | Germany and Vietnam; wider Asian footwear hubs | Short term (<= 2 years) |
| Certified Asian capacity | +2.3% | Taiwan and Vietnam; regional export chains | Medium term (2-4 years) |
| Brand Scope 3 purchasing | +2.0% | Europe and United States-led global value chains | Medium term (2-4 years) |
| Electronics material continuity | +1.6% | Vietnam and Germany; United States | Long term (>= 4 years) |
| Regulated-grade extension | +1.3% | United States and Germany; Asia Pacific medical manufacturing | Long term (>= 4 years) |
- Drop-in footwear conversion: Footwear converters are expected to adopt matched mass-balanced grades without rebuilding full product architecture. Faster trials and retained tooling make the route practical for seasonal programs with limited development windows.
- Certified Asian capacity: Certification at TPU production sites near major converting clusters is expected to improve availability and claim continuity. Regional supply reduces the burden of importing small specialty allocations from distant plants.
- Brand Scope 3 purchasing: Brands direct alternative-feedstock attributes toward defined components and product lines. The approach gains traction where carbon or circularity claims are reviewed alongside invoices and certificates.
- Electronics material continuity: Electronics and automotive converters favor matched grades that retain molding and film windows. Cable-jacket processing requirements leave little tolerance for resin behavior changes during qualification.
- Regulated-grade extension: Medical-device programs create narrower routes for mass-balanced TPU where grade controls and certificate boundaries are clear. Device teams still separate feedstock evidence from biocompatibility and purity files.
Opportunity Impact Analysis
| OPPORTUNITY | (~) % IMPACT ON CAGR | GEOGRAPHIC RELEVANCE | IMPACT TIMELINE |
|---|---|---|---|
| Footwear capsule-to-core programs | +1.4% | Vietnam and Italy; Germany and global sports brands | Short term (<= 2 years) |
| Film and sheet traceability | +1.3% | Asia Pacific and Europe | Medium term (2-4 years) |
| Application-specific PCF packages | +1.1% | Germany and United States; multinational brand programs | Medium term (2-4 years) |
| Medical-grade allocation | +0.9% | United States and Germany; the Netherlands | Long term (>= 4 years) |
- Footwear capsule-to-core programs: Brands are expected to begin with limited shoe lines and expand attributed volume after confirming processing. Aesthetics and certificate flow must match the commercial claim before scale-up.
- Film and sheet traceability: Film producers carry mass-balance evidence from resin purchase through roll conversion and delivery. Digital lot linkage helps when the film is laminated or printed by another converter.
- Application-specific PCF packages: TPU producers pair chain-of-custody information with product carbon footprint data for the exact grade and site. This separates feedstock attribution from energy-linked carbon reduction during claims review.
- Medical-grade allocation: Specialty medical programs are expected to create narrower opportunities where producers document grade controls and certificate boundaries. Downstream transaction records remain central because attribution evidence does not replace material qualification.
Restraints Impact Analysis
| RESTRAINT | (~) % IMPACT ON CAGR | GEOGRAPHIC RELEVANCE | IMPACT TIMELINE |
|---|---|---|---|
| Misread physical content | -1.3% | Global | Short term (<= 2 years) |
| Allocation premium and availability | -1.0% | Global | Medium term (2-4 years) |
| Downstream custody breaks | -0.8% | Multi-tier footwear and electronics; automotive chains | Medium term (2-4 years) |
| Qualification still required | -0.6% | Global | Short term (<= 2 years) |
- Misread physical content: A mass-balance certificate does not prove that attributed renewable or circular molecules are measurable in each delivered pellet. Claims that blur this distinction expose customers to rejection during approval reviews.
- Allocation premium and availability: Eligible alternative feedstock and certified production remain finite at a given site and time. Converters face premiums or minimum volumes even when the underlying TPU grade is available.
- Downstream custody breaks: Resin often passes through compounders and film extruders before final assembly. Missing transaction documents at one tier prevent the final customer from substantiating the claim.
- Qualification still required: Footwear and film users still test performance before repeat orders are placed. Electronics and medical users usually require deeper application checks before approval.
Where is certified TPU demand forming?
Germany 21.3%, United States 19.8%, Italy 18.5%, Netherlands 17.9%, Vietnam 18.8%
The report covers North America, Europe, and Asia Pacific. Germany and the United States receive detailed country analysis. Italy, the Netherlands, and Vietnam are also reviewed using the same forecast period. The full report includes more than 30 countries.
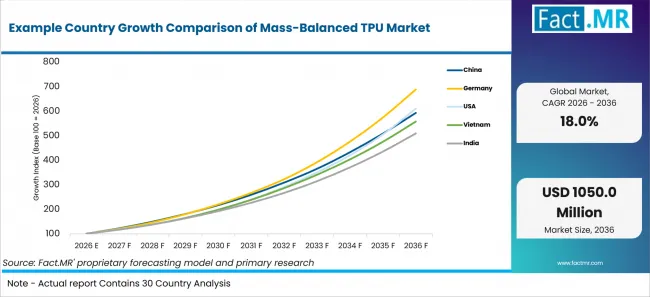
Example Country Growth Comparison Of Mass Balanced Tpu Market | Source: Fact.MR
| COUNTRY | CAGR |
|---|---|
| Germany | 21.3% |
| United States | 19.8% |
| Italy | 18.5% |
| Netherlands | 17.9% |
| Vietnam | 18.8% |
What is driving Germany’s growth through 2036?
21.3% CAGR, supported by polymer expertise, formal feedstock attribution, and qualification-led demand.
German converters assess mass-balanced TPU through established quality systems, while automotive and industrial customers require clear material-attribution evidence. Site-specific certification, consistent processing behavior, and product-footprint records influence whether a grade moves beyond trial volumes. The market is expected to record a 21.3% CAGR through 2036 as qualified materials enter repeat purchasing programs.
How is the United States scaling mass-balanced TPU demand?
19.8% CAGR, driven by footwear, medical, electronics, and automotive programs.
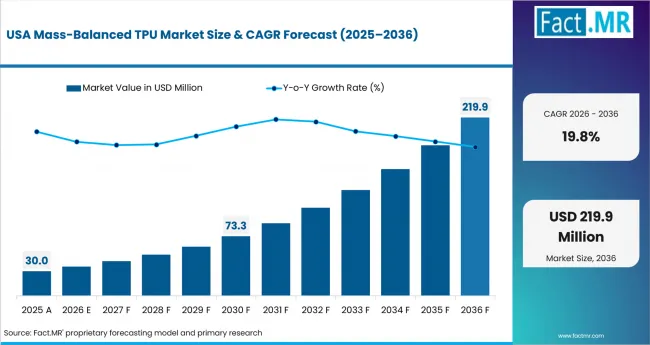
Mass Balanced Tpu Market Country Value Analysis | Source: Fact.MR
United States customers have strong technical teams for comparing mass-balanced grades with conventional TPU. Adoption depends on matching performance while preserving a transparent chain of custody for downstream claims. The market is projected to expand at a 19.8% CAGR from 2026 to 2036 as domestic supply improves and producers meet both certificate and component-level performance requirements.
What supports Italy’s position in the market?
18.5% CAGR, owing to premium footwear, fashion components, and technical-film demand.
Italian manufacturers use TPU in soles, trims, accessories, and films supplied to global brands. These applications place close attention on surface feel, appearance, and processing consistency. Italy is anticipated to advance at an 18.5% CAGR through 2036 as certified grades that closely match conventional resin reduce conversion risk across premium collections and export-oriented programs.
What role does the Netherlands play in certified TPU flows?
17.9% CAGR, supported by chemical distribution, certified trading, and European resin movement.
The Netherlands acts as a routing point for certified TPU entering European markets. Rotterdam-linked logistics, chemical distributors, traders, and compounders help transfer attributed material into customer-specific formats. Demand is estimated to record a 17.9% CAGR from 2026 to 2036 as local certification knowledge and distribution networks support custody transfer across multiple European supply chains.
Why is Vietnam a strategic footwear opportunity?
18.8% CAGR, driven by export footwear production and brand-led material requirements.
Vietnamese factories use TPU through resin, films, compounds, and finished components supplied into global footwear programs. Scaling depends on whether certificate records remain attached to the exact bill of materials used for each shoe. The market is forecast to post an 18.8% CAGR through 2036 as production scheduling, regional supply coordination, and brand approval convert pilot orders into regular volumes.
Who leads the Mass-Balanced TPU Market?
Covestro and BASF lead through broad TPU portfolios and certified production coverage, while Lubrizol strengthens competition with biomass-balanced ESTANE grades.
Covestro brings application-grade TPU coverage across footwear, electronics, automotive, films, and industrial components. BASF adds certified production capabilities and established engineering-plastics support for customers seeking attributed materials without changing approved processing conditions. Lubrizol expanded its ESTANE RNW portfolio with biomass-balanced TPU products designed for certified purchasing. These companies compete through exact grade availability, site eligibility, processing continuity, and the ability to transfer feedstock claims into customer documentation.
Huntsman strengthens the company set through certified TPU manufacturing sites and broad polyurethane application knowledge. Competition through 2036 is expected to depend on certificate scope, matched performance against conventional grades, reliable premium supply, and clear chain-of-custody records across converters, component makers, and finished-product brands.
Which companies are the key providers?
The company set includes Covestro and BASF, with Lubrizol and Huntsman completing the producer group.
- Covestro
- BASF
- Lubrizol
- Huntsman
Bibliography
- BASF. (2024, May 16). BASF expands its biomass balance portfolio for selected chemical intermediates.
- Huntsman Corporation. (2025, March 3). Huntsman Polyurethanes secures ISCC+ certification for TPU production sites.
- ISCC System GmbH. (2026, January 27). Why chemical recycling matters for the circular economy.
- Lubrizol Corporation. (2024, January 17). Three additional Lubrizol Engineered Polymers sites have achieved ISCC PLUS certification.
- Lubrizol Corporation. (2024, October 30). Lubrizol launches four new ESTANE RNW TPU biomass balance products.
This Report Addresses
- The report clarifies how mass balance changes feedstock attribution while retaining familiar TPU processing and performance.
- Country coverage concentrates on Germany and the United States across the current article. Italy and the Netherlands are also included with Vietnam within a study spanning 30+ countries.
- Competitive analysis benchmarks Covestro and BASF against certified TPU supply criteria. Lubrizol and Huntsman are assessed the same evidence base.
- Product coverage compares hardness grades and pellets across mass-balanced TPU supply. Films or sheets and compounds are reviewed separately from powders and custom blends.
- Application intelligence spans footwear and electronics protection across the article. Automotive interiors and industrial films are assessed alongside medical devices.
- Forecast evidence tracks certified output and eligible input allocation across producer systems. Converter qualification and downstream custody shape forecast checks with customer purchasing commitments.
What does the Mass-Balanced TPU Market cover?
Certified attributed TPU sold into five applications without requiring physical segregation of every alternative-feedstock molecule.
The study follows mass-balanced TPU across application and feedstock route. It also covers hardness grade and processing form as defined in the market taxonomy. Certification route is included because the claim depends on the evidence path. The analysis measures resin and qualifying TPU forms while excluding finished footwear and devices. Electronics and vehicles are also outside scope with films made from the resin.
What is included in the scope?
Included material carries auditable bio-attributed and circular value through a defined chain-of-custody model. Energy-linked and chemically recycled claims are counted only when evidence supports them. Customer-allocated claims follow the same evidence test.
Eligible forms include pellets and films or sheets across the market taxonomy. Compounds and powders are assessed with custom blends across soft and medium-hard grades. High-hardness and film grades are reviewed with specialty medical grades. Certification coverage includes ISCC PLUS and REDcert. PCF verification and brand approval are reviewed with customer declarations.
Transactions remain within scope when the certified attribute is allocated through shared production, provided the seller does not present attribution as proof of segregated physical content.
What is excluded from the scope?
Unattributed conventional TPU is excluded from the market boundary because it lacks a qualifying attributed claim. Downstream finished-product value also sits outside the market scope.
The report does not count a producer's full certified capacity automatically. Only eligible attributed sales are included. It also omits feedstock-attribution claims lacking a grade or site. Each claim must include quantity and time period with a traceable custody basis.
How Was the Analysis Built?
The analysis draws on 120+ sources, 35+ company portfolios, 25+ countries, and more than 20 industry interviews.
- Primary Research: Primary research includes discussions with manufacturers, service providers, technology developers, distributors, end users, procurement teams, and subject-matter experts. These conversations examine purchasing priorities, product adoption, operational challenges, approval requirements, competitive positioning, and the factors that influence wider market acceptance.
- Desk Research: Desk research covers government statistics, regulatory publications, company filings, trade data, technical studies, industry associations, standards, public policy, and other authoritative sources. Every source used in the analysis is documented in the bibliography.
- Market Sizing and Forecasting: Market estimates combine historical performance, demand indicators, pricing and volume trends, segment shares, company participation, country-level growth, adoption patterns, investment activity, and barriers to market expansion.
- Data Validation and Update Cycle: Findings are validated by comparing primary interviews with public data, company activity, regulatory changes, trade patterns, and industry developments. Regular updates review new product launches, capacity changes, partnerships, approvals, procurement trends, and shifts in commercial adoption.
What is the report's scope and coverage?
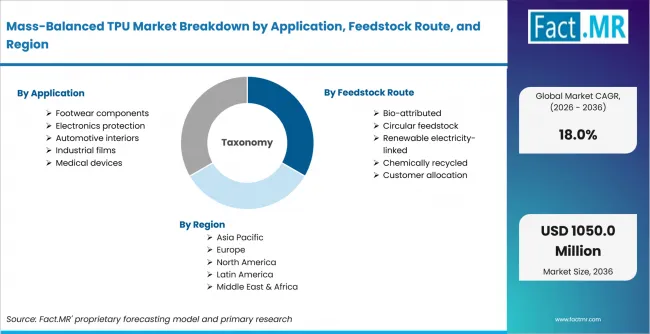
Mass Balanced Tpu Market Breakdown By Application, Feedstock Route, And Region | Source: Fact.MR
| ATTRIBUTE | DETAILS |
|---|---|
| Quantitative Units | USD million in 2026 to USD million by 2036 at a CAGR |
| Market Definition | The market covers thermoplastic polyurethane grades sold with a certified mass-balance or related attributed feedstock claim. Eligible renewable and circular inputs are reconciled through a defined chain-of-custody system. Chemically recycled and energy-linked inputs are counted only when evidence supports attribution. Customer-allocated inputs follow the same evidence rule. |
| Application | Footwear components; Electronics protection; Automotive interiors; Industrial films; Medical devices |
| Feedstock Route | Bio-attributed; Circular feedstock; Renewable electricity-linked; Chemically recycled; Customer allocation |
| Hardness Grade | Soft elastomeric TPU; Medium-hard TPU; High-hardness TPU; Film-grade TPU; Specialty medical grade |
| Processing Form | Pellets; Films/sheets; Compounds; Powders; Custom blends |
| Certification Route | ISCC PLUS; REDcert; PCF verified; Brand-approved grade; Customer declaration |
| Regions Covered | North America; Europe; Asia Pacific; Central and South America; Middle East and Africa |
| Countries Covered | Germany; United States; Italy; Netherlands; Vietnam, and 30+ countries |
| Key Companies Profiled | Covestro; BASF; Lubrizol; Huntsman |
| Forecast Period | 2026 to 2036 |
| Approach | Sizing reconciles certified site and grade availability with attributed TPU volumes and application demand. Hardness mix and form mix are assessed with chain-of-custody transfers. Premiums over the equivalent conventional grade are reviewed only when documented. |
How is the market segmented?
-
By Application
- Footwear components
- Electronics protection
- Automotive interiors
- Industrial films
- Medical devices
-
By Feedstock Route
- Bio-attributed
- Circular feedstock
- Renewable electricity-linked
- Chemically recycled
- Customer allocation
-
By Hardness Grade
- Soft elastomeric TPU
- Medium-hard TPU
- High-hardness TPU
- Film-grade TPU
- Specialty medical grade
-
By Processing Form
- Pellets
- Films/sheets
- Compounds
- Powders
- Custom blends
-
By Certification Route
- ISCC PLUS
- REDcert
- PCF verified
- Brand-approved grade
- Customer declaration
-
By Region
- North America
- United States
- Europe
- Germany
- Italy
- Netherlands
- Asia Pacific
- Vietnam

