- Market Value (2025): USD 5.4 Bn
- Estimated Value (2026): USD 5.7 Bn
- Forecast Value (2036): USD 9.8 Bn
- CAGR (2026-2036): 5.6%
What is the Dry Mix Mortar Additives and Chemicals Market forecast to be worth by 2036?
USD 5.7 billion in 2026 to USD 9.8 billion by 2036 at a 5.6% CAGR.
- The dry mix mortar additives and chemicals market was valued at USD 5.4 billion in 2025.
- Demand is projected to increase from USD 5.7 billion in 2026 to USD 9.8 billion by 2036.
- The market is forecast to record a 5.6% CAGR from 2026 to 2036.
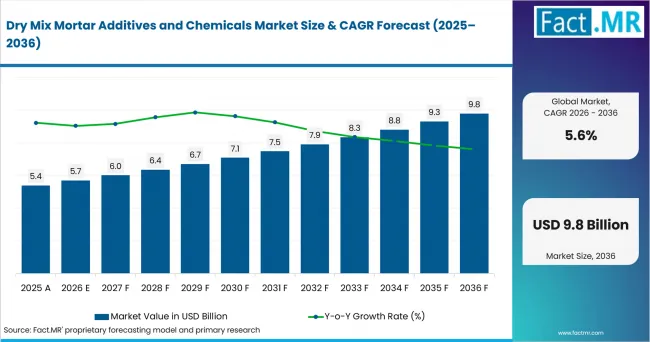
Dry Mix Mortar Additives And Chemicals Market Value Analysis | Source: Fact.MR
What are the defining numbers behind Dry Mix Mortar Additives and Chemicals Market growth?
USD 4.1 billion absolute opportunity by 2036, led by cellulose ethers and tile adhesives alongside residential construction and dry mix mortar manufacturers.
- Demand Drivers in the Market
- Factory-produced mortar is expected to reduce site mixing errors and improve consistency in finishing and bonding work.
- Cellulose ethers are expected to support water retention and open time where application consistency affects acceptance.
- Polymer modification is anticipated to improve adhesion and flexibility. Redispersible polymer powder remains useful when dry mortar formulations must perform across different substrates.
- Specification-led purchasing is expected to raise the value of supplier documentation before products are approved across sites.
- Key Segments Analyzed
- By Additive Type: Cellulose Ethers are expected to hold 35.0% share in 2026 because water retention and workability remain core formulation requirements.
- By Application: Tile Adhesives are projected to account for 37.0% share in 2026 as floor and wall installation systems rely on repeatable bonding performance.
- By End-use Sector: Residential Construction is anticipated to capture 41.0% share in 2026 since housing repair and new-build activity use many dry mortar formats.
- By Customer Category: Dry Mix Mortar Manufacturers are estimated to represent 39.0% share in 2026 due to direct control over formulation and channel supply.
- By Chemical Technology: Polymer Modification Technology is forecast to hold 36.0% share in 2026 as producers seek improved bond strength and water resistance.
- Analyst Opinion at Fact.MR
- Shambhu Nath Jha, Principal Consultant at Fact.MR, states, “Dry mix mortar additives and chemicals companies need to prove each ingredient’s role in the final mortar. Repeat sales are expected to depend on stable quality and clear technical sheets with application support.”
- Strategic Implications
- Brand owners should position products by formulation role. A cellulose ether or polymer powder needs a clear application case before price comparison begins.
- Suppliers can protect repeat business by simplifying dosage guidance and compatibility notes for dry mix mortar manufacturers.
- Distributors should plan inventory around Tile Adhesives and Residential Construction to improve availability and channel margins.
- Pricing strategy should reflect product proof. Suppliers with consistent performance records are expected to defend margins against lower-cost substitutes.
Germany reaches 5.8% and the USA is forecast at 5.4%. Brazil is estimated at 5.1%. Indonesia is estimated at 4.8% and Turkey at 4.5%.
How does the Dry Mix Mortar Additives and Chemicals Market break down by segment?
Cellulose Ethers are expected to lead Additive Type at 35.0% share in 2026. Tile Adhesives are projected to lead Application at 37.0% share.
Why does Cellulose Ethers lead Additive Type?
Cellulose Ethers are projected to account for 35.0% share in 2026.
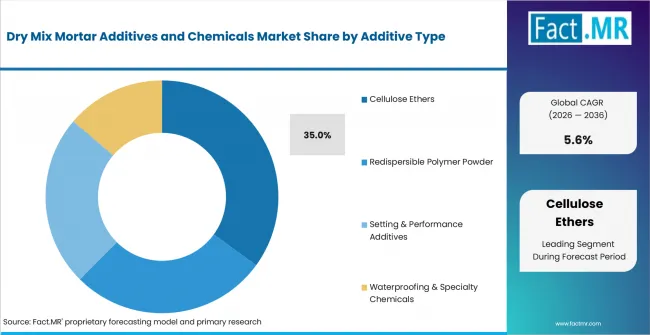
Dry Mix Mortar Additives And Chemicals Market Analysis By Additive Type | Source: Fact.MR
Their leading position comes from the need for water retention, workable consistency and longer open time in cement-based products. Once water is added, installers expect the mixture to remain smooth and easy to apply. This performance requirement keeps cellulose ethers central to formulation decisions.
Why does Tile Adhesives lead Application?
Tile Adhesives are expected to hold 37.0% share in 2026.
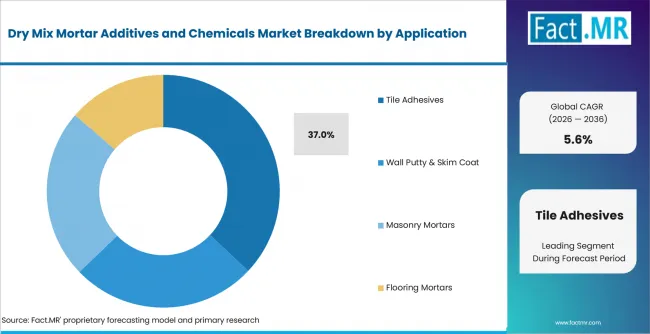
Dry Mix Mortar Additives And Chemicals Market Analysis By Application | Source: Fact.MR
Floor and wall installations require reliable bonding without reducing application time. Dry-mix formulations give contractors more consistent handling across different job sites. As substrate compatibility affects product choice, tile adhesives continue to generate the strongest application demand.
Why does Residential Construction lead End-use Sector?
Residential Construction is anticipated to capture 41.0% share in 2026.
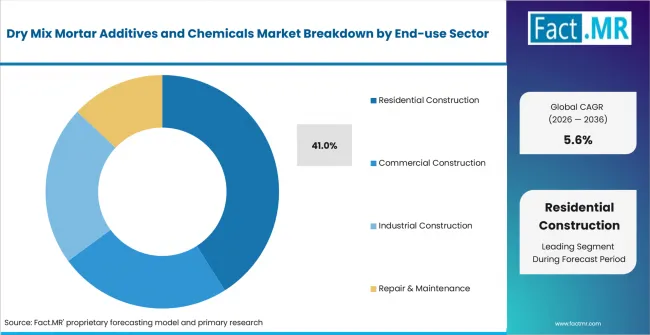
Dry Mix Mortar Additives And Chemicals Market Analysis By End Use Sector | Source: Fact.MR
Housing projects create repeated demand across tiling, finishing, skim coating and repair work. Unlike one-time specialist applications, these activities occur throughout new construction and renovation cycles. The broad use of dry mortar across homes therefore supports higher consumption.
Why does Dry Mix Mortar Manufacturers lead Customer Category?
Dry Mix Mortar Manufacturers are estimated to represent 39.0% share in 2026.
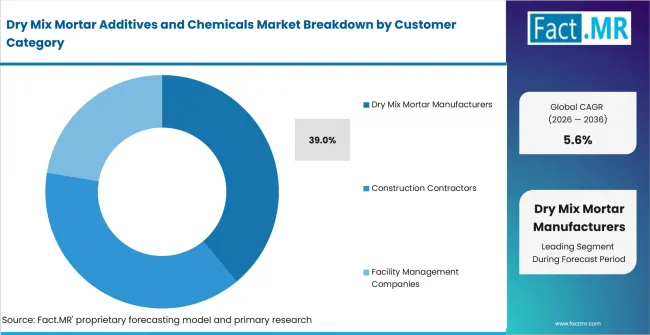
Dry Mix Mortar Additives And Chemicals Market Analysis By Customer Category | Source: Fact.MR
These companies purchase additives at the formulation stage, before the finished product reaches distributors or contractors. Their choices determine dosage, performance claims and packaging specifications. Direct control over product development gives them the largest share of customer demand.
Why does Polymer Modification Technology lead Chemical Technology?
Polymer Modification Technology is forecast to hold 36.0% share in 2026.
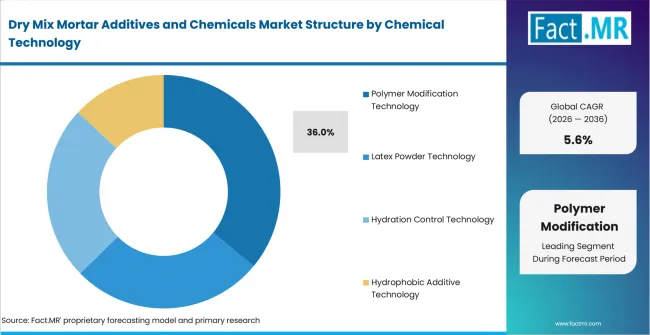
Dry Mix Mortar Additives And Chemicals Market Analysis By Chemical Technology | Source: Fact.MR
Improved adhesion and flexibility make polymer modification valuable in cement-based systems exposed to movement or surface stress. It also supports repair mortar formulations where bond strength is closely reviewed. For this reason, buyers often select the technology when standard cement performance is insufficient.
What is accelerating Dry Mix Mortar Additives and Chemicals Market adoption, and what is holding it back?
Demand is expected to rise through factory-made mortar adoption and tighter performance documentation. Growth is likely to be limited by raw material cost, formulation complexity and substitution by lower-cost alternatives.
Drivers Impact Analysis
| DRIVER | (~) % IMPACT ON CAGR | GEOGRAPHIC RELEVANCE | IMPACT TIMELINE |
|---|---|---|---|
| Adoption of factory-made dry mortar | +1.6% | Global | Short term (<= 2 years) |
| Regulatory and specification checks | +1.4% | USA, Germany, UK | Short term (<= 2 years) |
| Channel access expansion | +1.1% | Global | Medium term (2-4 years) |
| Technical documentation depth | +0.9% | USA, UK, Canada | Medium term (2-4 years) |
| Cost and efficiency gains | +0.6% | Global | Long term (>= 4 years) |
- Adoption of factory-made dry mortar: Pre-mixed dry products are expected to reduce field variability and make additive performance easier to compare across projects.
- Regulatory and specification checks: Contractors and brand owners are expected to favor documented performance where product approval depends on adhesion and durability evidence.
- Channel access expansion: Wider distribution is expected to help suppliers reach contractors that need ready formulations for tile adhesive and wall putty use.
Opportunity Impact Analysis
| OPPORTUNITY | (~) % IMPACT ON CAGR | GEOGRAPHIC RELEVANCE | IMPACT TIMELINE |
|---|---|---|---|
| Emerging application expansion | +1.0% | Global | Medium term (2-4 years) |
| Premium and specialist positioning | +0.8% | USA, UK, Germany | Medium term (2-4 years) |
| Channel and partner expansion | +0.7% | Global | Long term (>= 4 years) |
| Standards and compliance alignment | +0.5% | USA, Canada, Singapore | Long term (>= 4 years) |
- Emerging application expansion: Suppliers can use tile adhesives and flooring mortars to reach projects that require more specialised performance.
- Premium and specialist positioning: Products with clear test data are expected to gain attention where contractors value proven handling and service support.
- Channel and partner expansion: Partnerships with distributors and dry mortar manufacturers are expected to improve access in regions where contractor purchasing remains fragmented.
Restraints Impact Analysis
| RESTRAINT | (~) % IMPACT ON CAGR | GEOGRAPHIC RELEVANCE | IMPACT TIMELINE |
|---|---|---|---|
| Cost and complexity | -1.1% | Global | Short term (<= 2 years) |
| Specification and compliance checks | -0.9% | USA, UK, Germany | Short term (<= 2 years) |
| Substitution by lower-cost alternatives | -0.7% | Import-dependent markets | Medium term (2-4 years) |
| Supply chain and pricing pressure | -0.5% | Global | Long term (>= 4 years) |
- Cost and complexity: Additives raise formulation cost when buyers need several performance functions in one product. This can delay approval for lower-margin mortar lines.
- Specification and compliance checks: Approval work can stretch purchase cycles because customers need proof that additives perform reliably with local cement and sand quality.
- Substitution by lower-cost alternatives: Some buyers are expected to select simpler mortar systems or non-shrink grouts for defined repair uses when premium additives are difficult to justify.
Which countries are scaling the Dry Mix Mortar Additives and Chemicals Market fastest?
- The country comparison spans 1.9% points and forms a clear growth band across the forecast period.
- Germany remains 0.4% point above the USA through specification-led construction chemicals purchasing.
- The USA remains 0.3% point above Brazil as renovation demand supports use of tile adhesives and wall putty systems.
- Brazil remains 0.3% point above Indonesia because urban construction and distribution channels support steady product movement.
- Indonesia remains 0.3% point above Turkey through faster contractor adoption in selected residential and repair applications.
Similar country CAGRs can still create different entry conditions due to formulation standards and local cement quality. Channel depth and contractor buying behavior change how suppliers enter each market. Full report coverage includes North America, Latin America, Europe, East Asia, South Asia and Pacific, Middle East and Africa.
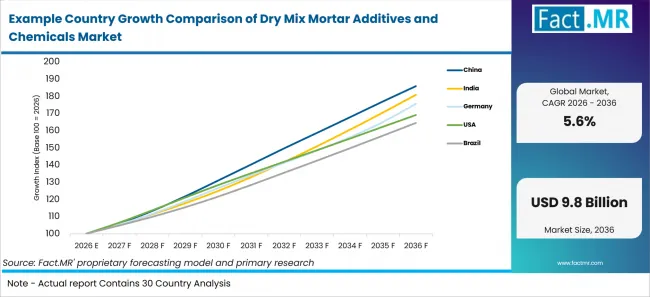
Example Country Growth Comparison Of Dry Mix Mortar Additives And Chemicals Market | Source: Fact.MR
| Country | CAGR (2026-2036) |
|---|---|
| Germany | 5.8% |
| USA | 5.4% |
| Brazil | 5.1% |
| Indonesia | 4.8% |
| Turkey | 4.5% |
What is driving Germany’s growth through 2036?
5.8% CAGR, supported by specification-led construction chemicals use.
Germany’s growth reflects buyer focus on compliance and verified material behavior. Suppliers with clear technical files are expected to gain preference.
What is driving USA’s growth through 2036?
5.4% CAGR, driven by renovation demand and contractor-focused product selection.
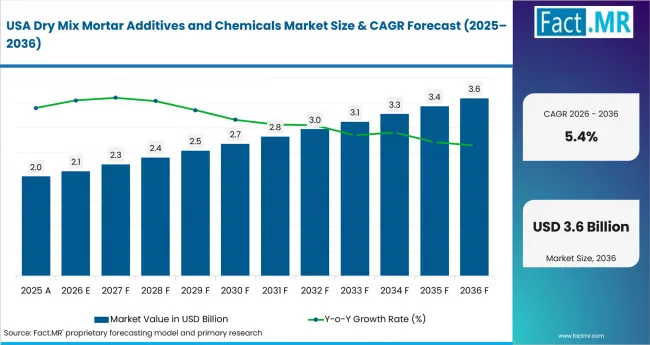
Dry Mix Mortar Additives And Chemicals Market Country Value Analysis | Source: Fact.MR
USA demand is expected to reflect residential repair and commercial finishing work. Buyers compare mixing ease and supplier reliability before selecting additives.
What is driving Brazil’s growth through 2036?
5.1% CAGR, supported by urban construction and packaged mortar distribution.
Brazil’s growth is tied to materials that reduce field mixing variability. Channel reach can speed the shift to packaged systems.
What is driving Indonesia’s growth through 2036?
4.8% CAGR, led by residential projects and expanding contractor adoption.
Indonesia’s growth reflects rising use of ready-to-mix products in urban construction and repair work. Reliable availability supports wider adoption.
What is driving Turkey’s growth through 2036?
4.5% CAGR, supported by repair work and regional construction chemicals supply.
Turkey’s growth reflects steady demand from tile setting and wall finishing. Cost pressure is expected to limit premium additive uptake.
Who leads the Dry Mix Mortar Additives and Chemicals Market?
Dow Inc. and Ashland Inc. hold strong positions through cellulose ethers and formulation additives, with Wacker Chemie AG adding depth in redispersible polymer powders for cement-based systems.
Dow Inc. addresses workability, water retention and open-time requirements in dry mortar formulations. Ashland Inc. contributes cellulose ether technologies used to improve consistency during mixing and application. Wacker Chemie AG strengthens adhesion and flexibility through polymer powders, while BASF SE provides broader construction-chemical and polymer-modification expertise. Sika AG and Saint-Gobain–Chryso extend the field through mortar-performance solutions for bonding, finishing and repair. Nouryon, Arkema S.A., Celanese Corporation and Tate & Lyle–CP Kelco add specialty chemistry, binders and rheology-control capabilities across dry-mix applications.
Which companies are the key providers?
Key companies include Dow Inc.; Ashland Inc.; Wacker Chemie AG; BASF SE; Sika AG; Saint-Gobain – Chryso; Nouryon; Arkema S.A.; Celanese Corporation; and Tate & Lyle – CP Kelco
- Dow Inc.
- Ashland Inc.
- Wacker Chemie AG
- BASF SE
- Sika AG
- Saint-Gobain – Chryso
- Nouryon
- Arkema S.A.
- Celanese Corporation
- Tate & Lyle – CP Kelco
Bibliography
- Eurostat. (2026, July 20). Production in construction up by 0.4% in the euro area and by 0.3% in the EU.
- Department for Business and Trade. (2026, July 1). Building materials and components statistics: June 2026.
- Ministry of Statistics and Programme Implementation. (2026, June 5). Press note on provisional estimates of annual gross domestic product for 2025–26: Quarterly estimates of gross domestic product for the fourth quarter (January–March) of 2025–26.
This Report Answers
- The report provides strategic intelligence on the Dry Mix Mortar Additives and Chemicals Market across Additive Type and Application choices that shape formulation decisions.
- Segment analysis covers Cellulose Ethers and Tile Adhesives as the share leaders within the 2026 market.
- Country outlook evaluates China and India alongside Germany and the USA. Brazil, Indonesia and Turkey complete the growth comparison across the profiled markets.
- Competitive analysis profiles Dow Inc. and Ashland Inc. alongside Wacker Chemie AG, BASF SE and Sika AG. Saint-Gobain – Chryso, Nouryon, Arkema S.A., Celanese Corporation and Tate & Lyle – CP Kelco complete the provider set.
- Technology assessment covers Polymer Modification Technology and Latex Powder Technology. Hydration control and hydrophobic additive technologies complete the process view alongside mortar chemistry exposure.
What does the Dry Mix Mortar Additives and Chemicals Market cover?
Dry mix mortar additives and chemicals are used in factory-made powder systems where water is added before application. The market covers additives that support workability, adhesion and setting behavior.
The Dry Mix Mortar Additives and Chemicals Market covers products used in tile adhesives and wall putty. Skim coat, masonry mortars and flooring mortars are included. Cellulose ethers and polymer powders are covered when they serve dry mortar use.
What is included in the scope?
Dry mix mortar additives and chemicals are assessed across Additive Type and Application. End-use Sector, Customer Category and Chemical Technology complete the scope. Coverage includes residential and commercial construction. Industrial and repair applications are included when dry mortar use is clear.
The scope includes dry powder additives used to change handling and adhesion. Setting behavior and moisture resistance are covered when the additive is sold for dry mortar use.
What is excluded from the scope?
The scope excludes wet ready-mixed materials and general cement. Sand and aggregates are outside the scope. Mixing equipment and unrelated construction services are excluded. Broader concrete admixtures remain adjacent unless the product is directly tied to dry mortar use.
Setting control and accelerator chemistry is covered only when sold for mortar formulation.
How Was the Analysis Built?
The analysis draws on 120+ sources, 35+ company portfolios, 25+ countries, and more than 20 industry interviews.
- Primary Research: Primary research includes discussions with manufacturers, service providers, technology developers, distributors, end users, procurement teams, and subject-matter experts. These conversations examine purchasing priorities, product adoption, operational challenges, approval requirements, competitive positioning, and the factors that influence wider market acceptance.
- Desk Research: Desk research covers government statistics, regulatory publications, company filings, trade data, technical studies, industry associations, standards, public policy, and other authoritative sources. Every source used in the analysis is documented in the bibliography.
- Market Sizing and Forecasting: Market estimates combine historical performance, demand indicators, pricing and volume trends, segment shares, company participation, country-level growth, adoption patterns, investment activity, and barriers to market expansion.
- Data Validation and Update Cycle: Findings are validated by comparing primary interviews with public data, company activity, regulatory changes, trade patterns, and industry developments. Regular updates review new product launches, capacity changes, partnerships, approvals, procurement trends, and shifts in commercial adoption.
What is the report’s scope and coverage?
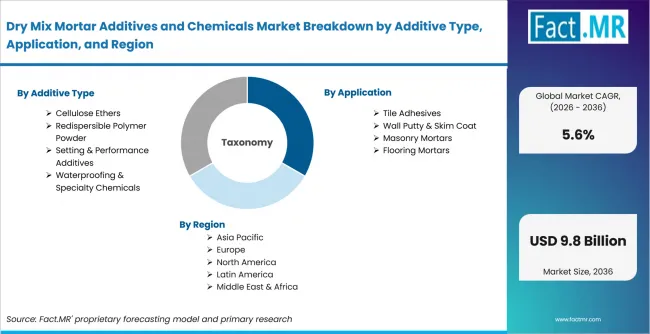
Dry Mix Mortar Additives And Chemicals Market Breakdown By Additive Type, Application, And Region | Source: Fact.MR
| Attribute | Details |
|---|---|
| Quantitative Units | USD billion in 2026 to USD billion by 2036 at CAGR |
| Market Definition | Additives and specialty chemicals used in factory-made dry mortar formulations where workability, adhesion, water retention, setting behavior and durability determine product acceptance |
| Additive Type | Cellulose Ethers; Redispersible Polymer Powder; Setting & Performance Additives; Waterproofing & Specialty Chemicals |
| Application | Tile Adhesives; Wall Putty & Skim Coat; Masonry Mortars; Flooring Mortars |
| End-use Sector | Residential Construction; Commercial Construction; Industrial Construction; Repair & Maintenance |
| Customer Category | Dry Mix Mortar Manufacturers; Construction Contractors; Facility Management Companies |
| Chemical Technology | Polymer Modification Technology; Latex Powder Technology; Hydration Control Technology; Hydrophobic Additive Technology |
| Regions Covered | North America; Latin America; Europe; East Asia; South Asia and Pacific; Middle East and Africa |
| Countries Covered | China; India; Germany; USA; Brazil; Indonesia; Turkey |
| Key Companies Profiled | Dow Inc.; Ashland Inc.; Wacker Chemie AG; BASF SE; Sika AG; Saint-Gobain – Chryso; Nouryon; Arkema S.A.; Celanese Corporation; Tate & Lyle – CP Kelco |
| Forecast Period | 2026 to 2036 |
| Approach | Hybrid top-down and bottom-up approach using dry mortar additive demand; segment shares; country growth; application fit; channel visibility; pricing; specification requirements and company portfolio review |
How is the market segmented?
-
By Additive Type
- Cellulose Ethers
- Methyl Cellulose
- Hydroxyethyl Methyl Cellulose
- Redispersible Polymer Powder
- Vinyl Acetate Ethylene Powder
- Acrylic Polymer Powder
- Setting & Performance Additives
- Set Retarders
- Set Accelerators
- Waterproofing & Specialty Chemicals
- Hydrophobic Agents
- Air Entraining Agents
- Cellulose Ethers
-
By Application
- Tile Adhesives
- Ceramic Tile Installation
- Natural Stone Installation
- Wall Putty & Skim Coat
- Interior Wall Finishing
- Exterior Wall Coating
- Masonry Mortars
- Bricklaying Mortars
- Block Masonry
- Flooring Mortars
- Self-leveling Floors
- Industrial Flooring
- Tile Adhesives
-
By End-use Sector
- Residential Construction
- Housing Projects
- Home Renovation
- Commercial Construction
- Office Buildings
- Infrastructure Projects
- Industrial Construction
- Factories & Warehouses
- Logistics Facilities
- Repair & Maintenance
- Building Rehabilitation
- Heritage Restoration
- Residential Construction
-
By Customer Category
- Dry Mix Mortar Manufacturers
- Building Material Producers
- Construction Chemical Companies
- Contract Manufacturers
- Ready Mix Mortar Suppliers
- Civil Engineering Contractors
- Construction Contractors
- Industrial Builders
- Infrastructure Developers
- Facility Management Companies
- Repair Solution Providers
- Public Infrastructure Authorities
- Dry Mix Mortar Manufacturers
-
By Chemical Technology
- Polymer Modification Technology
- Redispersible Polymer Technology
- Cellulose Ether Technology
- Latex Powder Technology
- Polymer Dispersion Technology
- Synthetic Resin Technology
- Hydration Control Technology
- Cement Hydration Modifier
- Rheology Control Technology
- Hydrophobic Additive Technology
- Silane-based Chemistry
- Air Void Stabilization Technology
- Polymer Modification Technology
-
By Region
- North America
- Latin America
- Western Europe
- Eastern Europe
- East Asia
- South Asia and Pacific
- Middle East & Africa

