Microbiology Culture Market Size, Share, Growth and Forecast (2026 - 2036)
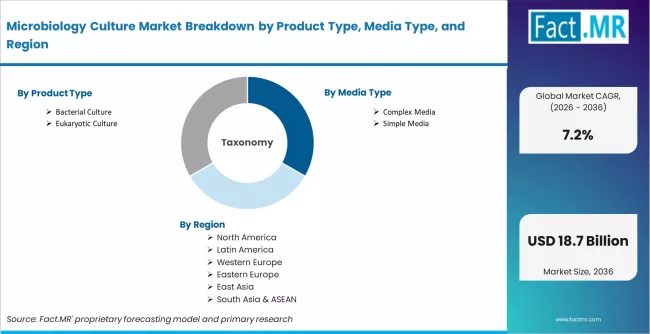
The Microbiology Culture Market is segmented by Product Type (Bacterial Culture, Eukaryotic Culture), Media Type (Simple Media, Complex Media, Synthetic Media, Special Media), Application (Food and Water Testing, Bioenergy and Agricultural Research, Cosmetics, Pharmaceuticals, Clinical Diagnostics), End User (Pharmaceutical and Biotechnology Companies, Diagnostic Laboratories, Food and Beverage Companies, Academic and Research Institutes, Environmental Testing Laboratories), Distribution Channel (Direct Institutional Sales, Laboratory Distributors, Online Scientific Supply Channels, Tender-based Sales), and Region. Forecast for 2026 to 2036.
Fact.MR analysis indicates that microbiology culture demand is shifting from routine lab use toward quality-controlled testing across pharmaceuticals, diagnostics, and food safety. Bacterial culture is projected to lead by product type. Pharmaceutical applications are expected to record the fastest growth during the forecast period.
Microbiology Culture Market Size, Market Forecast and Outlook by Fact.MR
- The microbiology culture market was valued at USD 8.1 billion in 2025.
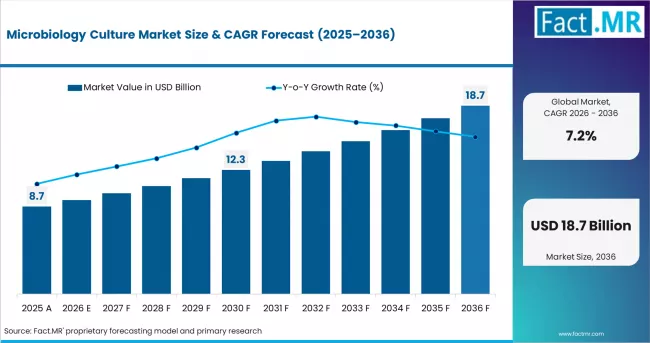
- Demand is set to reach USD 8.7 billion in 2026 at a CAGR of 7.2% during the forecast period.
- Sustained laboratory use takes the valuation to USD 17.4 billion through 2036 as clinical, pharma, and food testing laboratories continue to depend on validated culture workflows.
| Metric | Details |
|---|---|
| Industry Size (2026) | USD 8.7 billion |
| Industry Value (2036) | USD 17.4 billion |
| CAGR (2026 to 2036) | 7.2% |
Summary of Microbiology Culture Market
- Market Definition
- Microbiology culture covers products used to grow and study microorganisms under controlled laboratory conditions. Scope is defined by culture media, viable organism recovery, microbial identification, and quality testing across clinical, pharma, food, and research laboratories.
- Demand Drivers in the Market
- Clinical microbiology managers need validated culture workflows for pathogen isolation and susceptibility testing.
- Pharmaceutical quality-control heads need reliable media for sterility and microbial limit testing.
- Food safety laboratories require culture media that support repeatable pathogen detection.
- Key Segments Analyzed
- Bacterial Culture: Bacterial culture is expected to hold 63.0% share in 2026 because it remains essential for pathogen recovery and quality testing.
- Complex Media: Complex media are projected to account for 36.0% share in 2026 due to broad use across routine laboratory workflows.
- Pharmaceuticals: Pharmaceutical applications are estimated to capture 31.0% share in 2026 as microbial testing remains central to quality control.
- Pharmaceutical and Biotechnology Companies: Pharmaceutical and biotechnology companies are likely to hold 34.0% share in 2026 due to QC, R&D, and production testing needs.
- Direct Institutional Sales: Direct institutional sales are projected to account for 46.0% share in 2026 because large laboratories prefer contracted supply.
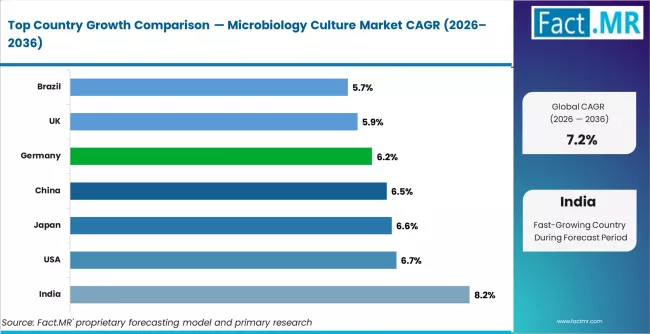
- Geography: India is forecast to grow at 8.2% CAGR through 2036, supported by pharmaceutical manufacturing and food testing expansion.
- Analyst Opinion at Fact.MR
- Shambhu Nath Jha, Senior Analyst at Fact.MR, notes, “Microbiology culture will remain essential even as rapid and molecular methods expand. Laboratories still need viable isolates, confirmatory workflows, and validated culture systems. Suppliers will gain where they support contamination control, documentation, and dependable media performance across regulated testing environments.”
- Strategic Implications
- Pharmaceutical QC heads must align culture media selection with validation and contamination-control requirements.
- Food safety laboratory managers should prioritize standardized media that support repeatable pathogen testing.
- Culture media suppliers need stronger documentation support to win regulated laboratory accounts.
- Methodology
- Fact.MR interviews laboratory directors, pharma QC managers, food testing heads, distributors, and culture media suppliers.
- Research reviews microbiology methods, antimicrobial resistance data, ISO standards, company reports, and lab quality documentation.
- Estimates use testing frequency, media usage, regulated QC needs, and regional laboratory growth.
- Forecasts are validated through supplier checks, buyer interviews, distributor inputs, and lab workflow analysis.
Laboratory directors are being pushed to decide between conventional culture capacity and more standardized culture systems that reduce variability. This shift is visible in pharmaceutical microbiology and food safety testing. FDA’s Bacteriological Analytical Manual remains a key reference for microbiological analysis of foods and cosmetics. [1] A practical point often missed is that molecular methods do not remove the need for culture. Many laboratories still need culture-based confirmation, isolate recovery, and antimicrobial susceptibility support.
The main inflection point arrives when laboratories connect culture media selection with accreditation, contamination control, and method validation. Testing laboratories trigger this shift by aligning media choice with documented procedures. Once this happens, microbiology culture moves from basic consumable use to a controlled quality-system input.
India is projected to record 8.2% CAGR through 2036 as pharma manufacturing and food testing expand. The USA is likely to grow at 6.7% through clinical diagnostics and antimicrobial resistance testing. Japan is forecast to post 6.6% CAGR as healthcare diagnostics and biopharma research support steady demand. China is expected to grow at 6.5%, Germany at 6.2%, the UK at 5.9%, and Brazil at 5.7%. Country variation depends on testing capacity, pharma output, and laboratory quality requirements.
Segmental Analysis
Microbiology Culture Market Analysis by Product Type
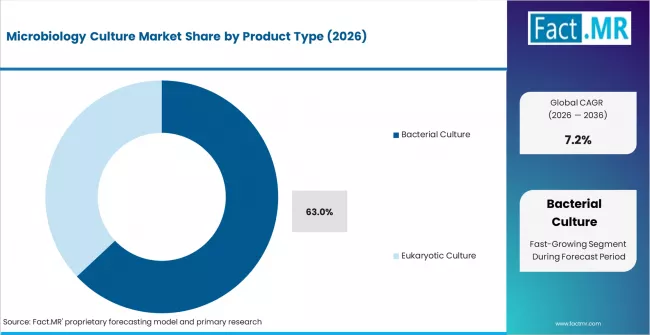
Bacterial culture is projected to hold 63.0% share in 2026 as it supports pathogen recovery across clinical diagnostics, food testing, and pharmaceutical QC. Clinical laboratories still need bacterial isolates for identification and susceptibility workflows. Fact.MR analysis suggests that bacterial culture leads because it remains difficult to replace in confirmatory testing. Eukaryotic culture is gaining interest through fungal studies and biopharmaceutical research. Mammalian and fungal culture needs are expanding in vaccine research and biologics work. Product choice depends on organism type and downstream testing needs. Laboratories that over-rely on rapid screening without culture confirmation can lose isolate-level evidence.
- Pathogen Recovery: Bacterial culture supports viable isolate recovery for confirmatory testing.
- Susceptibility Link: Culture remains important when laboratories need antimicrobial susceptibility data.
- Research Depth: Eukaryotic culture supports fungal and biopharma-related studies.
Microbiology Culture Market Analysis by Media Type
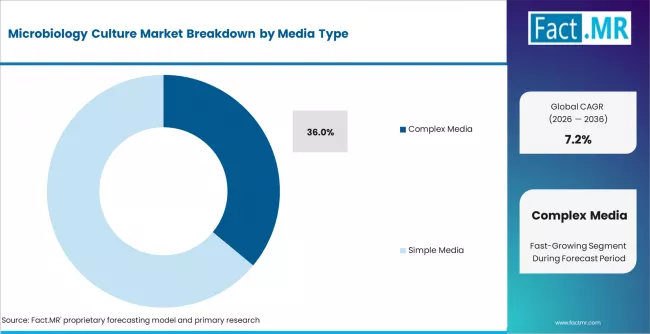
Routine laboratory work still depends on complex media because many organisms need nutrient-rich growth conditions. These media support broad recovery across clinical and industrial microbiology. Complex media are anticipated to account for 36.0% share in 2026 because routine labs need reliable growth support across varied samples. Simple media remain relevant in teaching and basic testing. Synthetic media are growing faster because defined composition supports reproducibility and controlled research. Special media serve selective and differential workflows. ISO/IEC 17025 supports the need for competent testing and valid results, which makes media consistency important for accredited laboratories. [2] Wrong media selection can affect recovery and test reliability.
- Growth Support: Complex media help laboratories recover organisms from mixed sample types.
- Reproducibility Need: Synthetic media support controlled research and regulated workflows.
- Selective Use: Special media help isolate target organisms from complex samples.
Microbiology Culture Market Analysis by Application
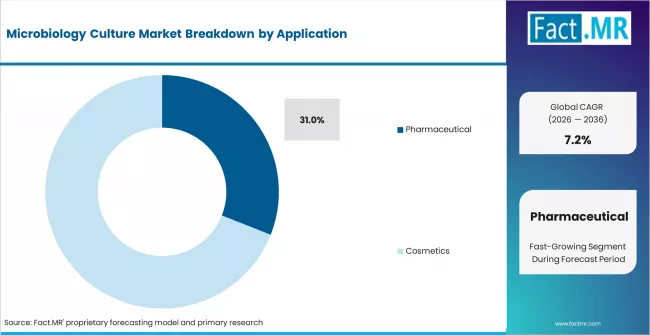
Pharmaceutical applications create recurring demand because microbial testing is built into production and quality-control workflows. Sterility testing, microbial limits, environmental monitoring, and contamination checks depend on dependable culture systems. Pharmaceutical applications are estimated to capture 31.0% share in 2026 as regulated production requires validated microbiology testing. Food and water testing remains a large application because contamination checks are routine. Bioenergy and agricultural research use cultures to study microbial activity. Cosmetics testing depends on microbial safety checks. Clinical diagnostics require culture for pathogen identification and susceptibility support. Weak culture workflows can delay release testing and investigations.
- Quality Control: Pharmaceutical testing needs validated media for release and monitoring.
- Food Safety: Food and water testing uses cultures for pathogen detection and verification.
- Clinical Evidence: Diagnostics laboratories use culture to recover organisms for treatment guidance.
Microbiology Culture Market Analysis by End User
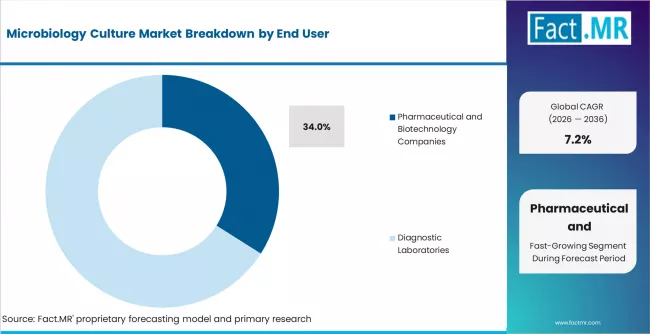
Pharmaceutical and biotechnology companies represent the strongest end-user base because microbial testing is tied to product quality and process control. These companies need reliable media for QC laboratories and research workflows. Fact.MR estimates pharmaceutical and biotechnology companies to hold 34.0% share in 2026 as biologics, vaccines, and sterile products require microbiology oversight. Diagnostic laboratories use culture media for infectious disease testing. Food and beverage companies rely on microbial analysis for safety and compliance. Academic institutes use culture systems in teaching and research. Environmental testing laboratories need media for water and soil analysis. End-user needs differ by validation burden and sample type.
- QC Dependence: Pharma labs need culture media for contamination checks and release testing.
- Diagnostic Need: Clinical labs require culture systems for organism recovery and follow-up testing.
- Food Control: Food companies use microbiology culture to verify hygiene and product safety.
Microbiology Culture Market Analysis by Distribution Channel
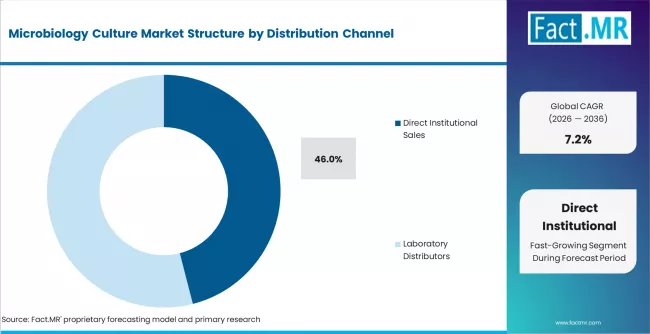
Large regulated laboratories prefer supply arrangements that reduce stockouts and batch variability. Direct institutional sales are projected to account for 46.0% share in 2026 because high-volume buyers need dependable supply and documentation. Laboratory distributors remain important for smaller labs and regional buyers. Online scientific supply channels support research labs with smaller orders. Tender-based sales serve public laboratories and hospital networks. Channel choice affects cold-chain needs, lot traceability, and technical support. Suppliers that cannot provide consistent documentation may lose regulated accounts. Distribution strength becomes more important when media demand rises during outbreak response or inspection cycles.
- Supply Assurance: Direct sales help large labs manage availability and lot consistency.
- Regional Reach: Distributors support smaller laboratories with varied product needs.
- Tender Access: Public laboratory demand often depends on approved vendor lists.
Microbiology Culture Market Drivers, Restraints, and Opportunities
Antimicrobial resistance is keeping culture-based testing central to clinical microbiology. CDC notes concern over new forms of resistance and rising resistant infections in community settings. [3] WHO’s 2025 antibiotic resistance surveillance report draws on bacteriologically confirmed cases, which reinforces the role of culture-supported surveillance. [4] Food safety testing also supports market demand because FDA’s BAM provides preferred laboratory procedures for microbiological analyses of foods and cosmetics. These conditions support demand for validated culture media and repeatable lab workflows.
Molecular diagnostics create a real restraint for conventional culture volume in selected workflows. Rapid molecular methods can reduce waiting time and shift some screening away from culture. Yet culture still holds value where isolate recovery and susceptibility testing are needed. Contamination risk is another restraint because poor handling can undermine results. Laboratories must manage method validation and quality systems. ISO/IEC 17025 expectations raise the importance of competent testing and valid results.
Opportunities in the Microbiology Culture Market
- AMR Workflows: Suppliers can support clinical laboratories with media designed for isolate recovery and susceptibility work.
- Food Testing Kits: Culture media suppliers can expand through ready-to-use formats for food and water testing.
- Defined Media: Synthetic media producers can gain in pharma and biotech labs that need reproducible growth conditions.
Regional Analysis
Based on the regional analysis, the microbiology culture market is segmented into North America, Latin America, Western Europe, Eastern Europe, East Asia, South Asia and Pacific, and Middle East and Africa across 40 plus countries.
.webp)
| Country | CAGR (2026 to 2036) |
|---|---|
| India | 8.2% |
| USA | 6.7% |
| Japan | 6.6% |
| China | 6.5% |
| Germany | 6.2% |
| UK | 5.9% |
| Brazil | 5.7% |
Source: Fact.MR analysis, based on proprietary forecasting model and primary research
South Asia and Pacific Microbiology Culture Market Analysis
South Asia and Pacific benefits from pharmaceutical manufacturing, food testing, and clinical laboratory expansion. Microbiology culture demand is strongest where regulated production and public health testing grow together. Buyers in this region value affordable media with reliable performance. India stands out because pharmaceutical QC and food safety testing create repeat demand. Distributor reach remains important because laboratories vary widely in scale and technical capability. Regional suppliers can gain when they support documentation and stable availability.
- India: India is projected to record 8.2% CAGR from 2026 to 2036 as pharma manufacturing and food testing expand. QC laboratories need culture media for microbial limits and contamination control. Clinical labs use bacterial culture for pathogen recovery. Food testing demand is supported by stronger safety expectations across packaged foods and exports. Suppliers that combine price discipline with dependable media quality can improve access.
North America Microbiology Culture Market Analysis
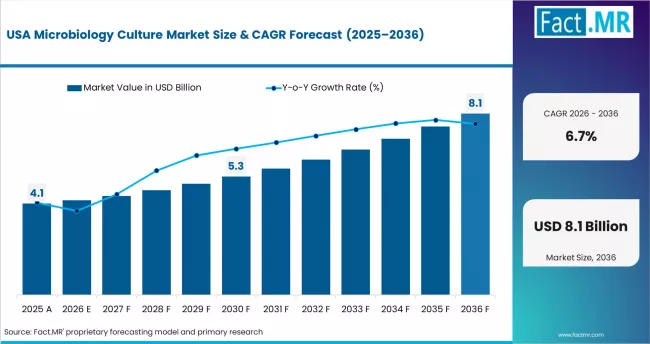
North America remains a major microbiology culture market due to clinical diagnostics, pharmaceutical QC, and food safety testing. Laboratories have strong quality-system expectations and require reliable media documentation. FDA food microbiology methods support ongoing culture use in food and cosmetic analysis. CDC antimicrobial resistance resources reinforce the need for laboratory capacity and surveillance. Buyers in this region value supply reliability and technical support. Culture media suppliers compete through documentation, automation compatibility, and prepared media availability.
- USA: Clinical laboratories and pharma QC units create strong baseline demand. The USA microbiology culture market is likely to grow at 6.7% CAGR through 2036. AMR testing and food safety workflows support repeated culture media use. Large laboratories prefer suppliers with lot traceability and technical support. Demand remains steady where culture-based confirmation is required after screening.
East Asia Microbiology Culture Market Analysis
East Asia combines biopharmaceutical production, clinical diagnostics, and food safety testing. China and Japan both support demand, but their buyer needs differ. China’s growth depends on expanding laboratory capacity and domestic biopharma output. Japan’s demand is more quality-driven and linked with advanced diagnostics. Suppliers need strong product consistency because regulated laboratories cannot easily switch validated media. East Asia also shows interest in automated culture and microbial identification workflows.
- Japan: Japan has advanced healthcare and pharmaceutical research capacity. Diagnostic laboratories need reliable culture workflows for infectious disease testing. Demand in Japan is forecast to post 6.6% CAGR by 2036. Aging demographics support diagnostic testing demand. Suppliers that provide high-quality media and technical documentation can protect institutional accounts.
- China: China’s biopharma and food testing sectors support expanding culture media use. Large urban laboratories need dependable media for clinical and industrial microbiology. Microbiology culture demand in China is expected to grow at 6.5% CAGR during 2026 to 2036. Domestic manufacturing can improve supply, but quality consistency remains central for regulated labs. Suppliers with validated products can gain in pharma and diagnostics.
Western Europe Microbiology Culture Market Analysis
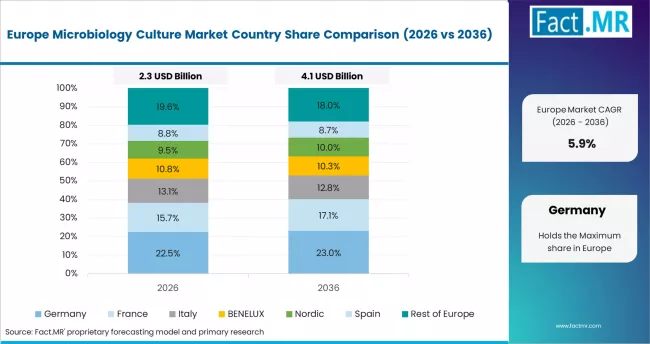
Western Europe has established pharmaceutical, food safety, and clinical microbiology laboratories. Buyers emphasize validated methods, traceable media, and laboratory competence. ISO/IEC 17025 supports confidence in testing laboratory operations, which strengthens demand for documented culture workflows. Pharmaceutical laboratories also require media consistency for release testing and environmental monitoring. Growth is steady because laboratory systems are mature. Suppliers compete through quality documentation and technical support.
- Germany: Germany is estimated to grow at 6.2% CAGR over the assessment period. Pharmaceutical QC, food testing, and clinical microbiology support recurring media demand. Laboratories value documented methods and consistent media performance. Suppliers with strong technical support can hold institutional relationships. Growth remains steady because testing capacity is already well developed.
- UK: The UK has a strong base of clinical and research laboratories. Public health testing and food safety work support culture media demand. Microbiology culture demand in the UK is forecast to expand at 5.9% CAGR during 2026 to 2036. Laboratories need media that fit validated methods and accreditation requirements. Suppliers gain when they offer reliable delivery and method support.
Latin America Microbiology Culture Market Analysis
Latin America demand is supported by food testing, clinical diagnostics, and pharmaceutical quality control. Brazil leads regional demand because it has a larger healthcare system and food industry base. Laboratories remain cost-sensitive, which keeps standard media important. Premium and synthetic media adoption is more concentrated in larger private laboratories and pharma facilities. Distributor reach plays a major role in availability outside large cities.
- Brazil: Brazil is projected to record 5.7% CAGR by 2036. Food safety testing and clinical diagnostics create recurring media use. Pharmaceutical QC supports demand in regulated facilities. Distributors remain important because laboratory access varies by region. Suppliers that provide dependable stock and technical documentation can improve adoption.
Competitive Aligners for Market Players
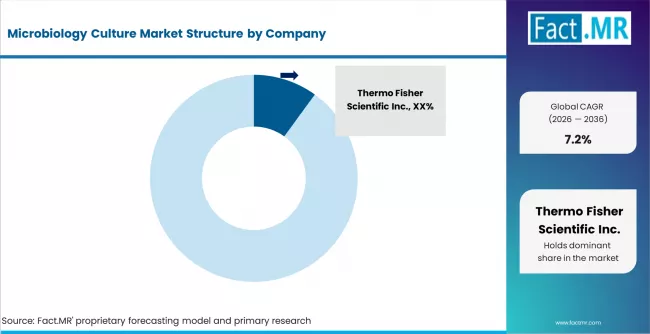
The microbiology culture market is concentrated around large life science suppliers, diagnostics companies, and specialized media manufacturers. Top suppliers benefit from established portfolios and global distribution. Competition through media reliability, documentation support, and workflow fit. Thermo Fisher’s annual report states that its microbiology offerings include dehydrated and prepared culture media, collection and transport systems, instrumentation, and consumables. [5]
Competitive advantage depends on product breadth and regulated laboratory trust. Merck KGaA’s Life Science segment operates through Science & Lab Solutions, Process Solutions, and Life Science Services, which supports its laboratory supply position. [6] bioMérieux reported growth in microbiology sales in 2024, supported by blood culture and automated ID/AST reagents. [7] These companies show why culture media and microbiology instruments are increasingly linked in laboratory workflows.
Food safety suppliers also influence competition. Neogen’s annual report states that it offers food safety analysis services in the United States and India through ISO-accredited laboratories. [8] Bio-Rad’s clinical diagnostics and life science portfolio supports its role in laboratory testing markets. Suppliers that combine media, quality-control organisms, and workflow support can defend share as laboratories demand stronger documentation.
Key Players in Microbiology Culture Market
- Thermo Fisher Scientific Inc.
- Merck KGaA
- bioMérieux SA
- Bio-Rad Laboratories, Inc.
- Neogen Corporation
- HiMedia Laboratories
- Becton, Dickinson and Company
- Eiken Chemical Co., Ltd.
- Scharlab, S.L.
- Sigma-Aldrich Corporation
- BrightGene Bio-Medical Technology Co., Ltd.
- Cathay Biotech Inc.
- Vland Biotech
- Cabio Biotech
Bibliography
- [1]. U.S. Food and Drug Administration. (2026, March 27). Bacteriological Analytical Manual. U.S. Food and Drug Administration.
- [2]. International Organization for Standardization. (2024). ISO/IEC 17025: Testing and calibration laboratories. International Organization for Standardization.
- [3]. Centers for Disease Control and Prevention. (2025, February 4). Antimicrobial resistance facts and stats. Centers for Disease Control and Prevention.
- [4]. World Health Organization. (2025, October 13). Global antibiotic resistance surveillance report 2025. World Health Organization.
- [5]. Thermo Fisher Scientific Inc. (2025, April 8). 2024 annual report. Thermo Fisher Scientific Inc.
- [6]. Merck KGaA. (2025, March 6). Life science: Merck annual report 2024. Merck KGaA.
- [7]. bioMérieux SA. (2025, March 7). 2024 financial results. bioMérieux SA.
- [8]. Neogen Corporation. (2024, July 30). 2024 annual report. Neogen Corporation.
This Report Addresses
- Strategic intelligence on microbiology culture demand across bacterial culture, eukaryotic culture, culture media, pharmaceutical QC, clinical diagnostics, and food safety testing globally.
- Market forecast from USD 8.7 billion in 2026 to USD 17.4 billion by 2036 at a CAGR of 7.2%.
- Growth opportunity mapping across India pharma QC demand, USA AMR testing, Japan clinical diagnostics, China biopharma expansion, and Germany accredited laboratory needs.
- Segment analysis by product type, media type, application, end user, and distribution channel.
- Regional outlook covering South Asia and Pacific laboratory expansion, North America AMR surveillance, East Asia biopharma demand, and Western Europe accreditation-driven testing.
- Competitive analysis of Thermo Fisher Scientific, Merck KGaA, bioMérieux, Bio-Rad Laboratories, Neogen Corporation, HiMedia Laboratories, and Becton, Dickinson and Company.
- Product assessment covering bacterial culture, eukaryotic culture, complex media, synthetic media, prepared media, and food testing workflows.
- Report delivered through PDF, Excel datasets, and presentation formats, supported by primary interviews, supplier reviews, laboratory purchasing checks, and method-based validation.
Microbiology Culture Market Definition
The microbiology culture market covers media, reagents, culture systems, and related laboratory products used to grow, isolate, identify, and study microorganisms. The market is defined by culture-based workflows used in clinical diagnostics, pharmaceutical quality control, food testing, water testing, biotechnology, and research. It differs from molecular diagnostics because culture methods support viable organism recovery and downstream susceptibility testing.
Microbiology Culture Market Inclusions
The scope includes bacterial culture, eukaryotic culture, simple media, complex media, synthetic media, special media, prepared plates, dehydrated media, enrichment broths, transport media, quality-control organisms, and related lab consumables. Products used in pharmaceutical testing, clinical microbiology, food safety, environmental monitoring, and biotechnology research are included when they support organism growth or culture-based analysis.
Microbiology Culture Market Exclusions
The scope excludes molecular-only assays, sequencing platforms, immunoassays, automated analyzers without culture media use, general laboratory glassware, and non-microbiology cell culture products. Diagnostic kits are excluded unless culture is a required step. General chemical reagents are outside scope unless they are formulated as microbiology media components.
Microbiology Culture Market Research Methodology
- Primary Research:Interviews with clinical microbiology managers, pharmaceutical quality-control heads, food safety laboratory directors, biotech research scientists, and laboratory distributors.
- Desk Research:Review of FDA microbiology methods, ISO laboratory competence standards, antimicrobial resistance surveillance, company filings, and product portfolio documentation.
- Market-Sizing and Forecasting:Forecasting uses testing volume, media consumption, laboratory accreditation needs, pharma QC intensity, and food testing demand.
- Data Validation and Update Cycle:Forecasts are validated through supplier interviews, distributor checks, lab purchasing inputs, and country-level testing capacity signals.
Scope of the Report

| Attribute | Details |
|---|---|
| Quantitative Units | USD 8.7 billion in 2026 to USD 17.4 billion by 2036, at a CAGR of 7.2% |
| Market Definition | Culture media, reagents, and related laboratory products used to grow, isolate, identify, and study microorganisms across clinical, food, pharmaceutical, and research workflows. |
| Product Type | Bacterial Culture, Eukaryotic Culture |
| Media Type | Simple Media, Complex Media, Synthetic Media, Special Media |
| Application | Food and Water Testing, Bioenergy and Agricultural Research, Cosmetics, Pharmaceuticals, Clinical Diagnostics |
| End User | Pharmaceutical and Biotechnology Companies, Diagnostic Laboratories, Food and Beverage Companies, Academic and Research Institutes, Environmental Testing Laboratories |
| Distribution Channel | Direct Institutional Sales, Laboratory Distributors, Online Scientific Supply Channels, Tender-based Sales |
| Regions Covered | North America, Latin America, Western Europe, Eastern Europe, East Asia, South Asia and Pacific, Middle East and Africa |
| Countries Covered | India, USA, Japan, China, Germany, UK, Brazil, and 40 plus countries |
| Key Companies Profiled | Thermo Fisher Scientific Inc., Merck KGaA, bioMérieux SA, Bio-Rad Laboratories, Inc., Neogen Corporation, HiMedia Laboratories, Becton, Dickinson and Company, Eiken Chemical Co., Ltd., Scharlab, S.L., Sigma-Aldrich Corporation, BrightGene, Cathay Biotech, Vland Biotech, Cabio Biotech |
| Forecast Period | 2026 to 2036 |
| Approach | Hybrid top-down and bottom-up model using laboratory testing volume, culture media consumption, pharma QC needs, food safety testing demand, and primary interviews with laboratory buyers. |
Microbiology Culture Market Analysis by Segments
-
By Product Type:
- Bacterial Culture
- Eukaryotic Culture
-
By Media Type:
- Simple Media
- Complex Media
- Synthetic Media
- Special Media
-
By Application:
- Food and Water Testing
- Bioenergy and Agricultural Research
- Cosmetics
- Pharmaceuticals
- Clinical Diagnostics
-
By End User:
- Pharmaceutical and Biotechnology Companies
- Diagnostic Laboratories
- Food and Beverage Companies
- Academic and Research Institutes
- Environmental Testing Laboratories
-
By Distribution Channel:
- Direct Institutional Sales
- Laboratory Distributors
- Online Scientific Supply Channels
- Tender-based Sales
-
By Region:
- North America
- USA
- Canada
- Latin America
- Brazil
- Mexico
- Western Europe
- Germany
- UK
- France
- Eastern Europe
- Poland
- Russia
- East Asia
- China
- Japan
- South Korea
- South Asia and Pacific
- India
- ASEAN
- Australia and New Zealand
- Middle East and Africa
- GCC
- South Africa
- North America
- Frequently Asked Questions -
How large is the microbiology culture market in 2025?
The microbiology culture market was valued at USD 8.1 billion in 2025.
What is the expected value in 2026?
Demand is estimated to reach USD 8.7 billion in 2026.
What is the forecast value by 2036?
The market is forecast to reach USD 17.4 billion by 2036.
What CAGR is projected for 2026 to 2036?
Fact.MR projects a CAGR of 7.2% for the 2026 to 2036 forecast period.
Which product type leads demand?
Bacterial culture leads with 63.0% share in 2026.
Which media type accounts for the highest share?
Complex media lead with 36.0% share in 2026.
Which application leads demand?
Pharmaceuticals lead with 31.0% share in 2026.
Which end user drives the largest demand?
Pharmaceutical and biotechnology companies lead with 34.0% share in 2026.
Which distribution channel leads sales?
Direct institutional sales lead with 46.0% share in 2026.
Which country shows the fastest growth?
India is projected to grow at 8.2% CAGR through 2036.
Why does bacterial culture lead?
Bacterial culture leads because laboratories still need viable isolates for confirmation and susceptibility testing.
Why are complex media widely used?
Complex media support broad organism recovery across routine clinical and industrial workflows.
Why is synthetic media growing?
Synthetic media grows because defined composition supports reproducibility in regulated research settings.
What is the main restraint in this market?
Molecular diagnostics and contamination risk restrain some conventional culture workflows.
How does AMR affect demand?
AMR increases the need for culture-supported surveillance and susceptibility workflows.
Why is food testing important?
Food testing uses culture methods for pathogen detection and safety verification.
What supports demand in India?
Pharmaceutical manufacturing and food testing expansion support demand in India.
What supports demand in the USA?
Clinical diagnostics, AMR testing, and food safety methods support demand in the USA.
What supports demand in Japan?
Advanced diagnostics and pharmaceutical research support demand in Japan.
Why do laboratories prefer documented media?
Documented media help laboratories support method validation and accreditation needs.
What defines competition in this market?
Competition depends on media reliability, documentation, distribution strength, and workflow support.
Who are the leading companies?
Leading companies include Thermo Fisher Scientific, Merck KGaA, bioMérieux, Bio-Rad Laboratories, Neogen Corporation, HiMedia Laboratories, and Becton, Dickinson and Company.
Table of Content
- Executive Summary
- Global Market Outlook
- Demand to side Trends
- Supply to side Trends
- Technology Roadmap Analysis
- Analysis and Recommendations
- Market Overview
- Market Coverage / Taxonomy
- Market Definition / Scope / Limitations
- Research Methodology
- Chapter Orientation
- Analytical Lens and Working Hypotheses
- Market Structure, Signals, and Trend Drivers
- Benchmarking and Cross-market Comparability
- Market Sizing, Forecasting, and Opportunity Mapping
- Research Design and Evidence Framework
- Desk Research Programme (Secondary Evidence)
- Company Annual and Sustainability Reports
- Peer-reviewed Journals and Academic Literature
- Corporate Websites, Product Literature, and Technical Notes
- Earnings Decks and Investor Briefings
- Statutory Filings and Regulatory Disclosures
- Technical White Papers and Standards Notes
- Trade Journals, Industry Magazines, and Analyst Briefs
- Conference Proceedings, Webinars, and Seminar Materials
- Government Statistics Portals and Public Data Releases
- Press Releases and Reputable Media Coverage
- Specialist Newsletters and Curated Briefings
- Sector Databases and Reference Repositories
- Fact.MR Internal Proprietary Databases and Historical Market Datasets
- Subscription Datasets and Paid Sources
- Social Channels, Communities, and Digital Listening Inputs
- Additional Desk Sources
- Expert Input and Fieldwork (Primary Evidence)
- Primary Modes
- Qualitative Interviews and Expert Elicitation
- Quantitative Surveys and Structured Data Capture
- Blended Approach
- Why Primary Evidence is Used
- Field Techniques
- Interviews
- Surveys
- Focus Groups
- Observational and In-context Research
- Social and Community Interactions
- Stakeholder Universe Engaged
- C-suite Leaders
- Board Members
- Presidents and Vice Presidents
- R&D and Innovation Heads
- Technical Specialists
- Domain Subject-matter Experts
- Scientists
- Physicians and Other Healthcare Professionals
- Governance, Ethics, and Data Stewardship
- Research Ethics
- Data Integrity and Handling
- Primary Modes
- Tooling, Models, and Reference Databases
- Desk Research Programme (Secondary Evidence)
- Data Engineering and Model Build
- Data Acquisition and Ingestion
- Cleaning, Normalisation, and Verification
- Synthesis, Triangulation, and Analysis
- Quality Assurance and Audit Trail
- Market Background
- Market Dynamics
- Drivers
- Restraints
- Opportunity
- Trends
- Scenario Forecast
- Demand in Optimistic Scenario
- Demand in Likely Scenario
- Demand in Conservative Scenario
- Opportunity Map Analysis
- Product Life Cycle Analysis
- Supply Chain Analysis
- Investment Feasibility Matrix
- Value Chain Analysis
- PESTLE and Porter’s Analysis
- Regulatory Landscape
- Regional Parent Market Outlook
- Production and Consumption Statistics
- Import and Export Statistics
- Market Dynamics
- Global Market Analysis 2021 to 2025 and Forecast, 2026 to 2036
- Historical Market Size Value (USD Million) Analysis, 2021 to 2025
- Current and Future Market Size Value (USD Million) Projections, 2026 to 2036
- Y to o to Y Growth Trend Analysis
- Absolute $ Opportunity Analysis
- Global Market Pricing Analysis 2021 to 2025 and Forecast 2026 to 2036
- Global Market Analysis 2021 to 2025 and Forecast 2026 to 2036, By Meter Type
- Introduction / Key Findings
- Historical Market Size Value (USD Million) Analysis By Meter Type , 2021 to 2025
- Current and Future Market Size Value (USD Million) Analysis and Forecast By Meter Type , 2026 to 2036
- Process Density Meters
- Laboratory Density Meters
- Portable Density Meters
- Process Density Meters
- Y to o to Y Growth Trend Analysis By Meter Type , 2021 to 2025
- Absolute $ Opportunity Analysis By Meter Type , 2026 to 2036
- Global Market Analysis 2021 to 2025 and Forecast 2026 to 2036, By Technology
- Introduction / Key Findings
- Historical Market Size Value (USD Million) Analysis By Technology, 2021 to 2025
- Current and Future Market Size Value (USD Million) Analysis and Forecast By Technology, 2026 to 2036
- Vibrating Tube Density Meters
- Coriolis Density Meters
- Ultrasonic Density Meters
- Vibrating Tube Density Meters
- Y to o to Y Growth Trend Analysis By Technology, 2021 to 2025
- Absolute $ Opportunity Analysis By Technology, 2026 to 2036
- Global Market Analysis 2021 to 2025 and Forecast 2026 to 2036, By Application
- Introduction / Key Findings
- Historical Market Size Value (USD Million) Analysis By Application, 2021 to 2025
- Current and Future Market Size Value (USD Million) Analysis and Forecast By Application, 2026 to 2036
- Concentration Measurement
- Quality Control
- Custody Transfer
- Concentration Measurement
- Y to o to Y Growth Trend Analysis By Application, 2021 to 2025
- Absolute $ Opportunity Analysis By Application, 2026 to 2036
- Global Market Analysis 2021 to 2025 and Forecast 2026 to 2036, By End-use Industry
- Introduction / Key Findings
- Historical Market Size Value (USD Million) Analysis By End-use Industry, 2021 to 2025
- Current and Future Market Size Value (USD Million) Analysis and Forecast By End-use Industry, 2026 to 2036
- Oil and Gas
- Chemicals and Petrochemicals
- Food and Beverages
- Oil and Gas
- Y to o to Y Growth Trend Analysis By End-use Industry, 2021 to 2025
- Absolute $ Opportunity Analysis By End-use Industry, 2026 to 2036
- Global Market Analysis 2021 to 2025 and Forecast 2026 to 2036, By Sales Channel
- Introduction / Key Findings
- Historical Market Size Value (USD Million) Analysis By Sales Channel, 2021 to 2025
- Current and Future Market Size Value (USD Million) Analysis and Forecast By Sales Channel, 2026 to 2036
- Direct Institutional Sales
- Instrument Distributors
- Online Scientific Supply Channels
- Direct Institutional Sales
- Y to o to Y Growth Trend Analysis By Sales Channel, 2021 to 2025
- Absolute $ Opportunity Analysis By Sales Channel, 2026 to 2036
- Global Market Analysis 2021 to 2025 and Forecast 2026 to 2036, By Region
- Introduction
- Historical Market Size Value (USD Million) Analysis By Region, 2021 to 2025
- Current Market Size Value (USD Million) Analysis and Forecast By Region, 2026 to 2036
- North America
- Latin America
- Western Europe
- Eastern Europe
- East Asia
- South Asia and Pacific
- Middle East & Africa
- Market Attractiveness Analysis By Region
- North America Market Analysis 2021 to 2025 and Forecast 2026 to 2036, By Country
- Historical Market Size Value (USD Million) Trend Analysis By Market Taxonomy, 2021 to 2025
- Market Size Value (USD Million) Forecast By Market Taxonomy, 2026 to 2036
- By Country
- USA
- Canada
- Mexico
- By Meter Type
- By Technology
- By Application
- By End-use Industry
- By Sales Channel
- By Country
- Market Attractiveness Analysis
- By Country
- By Meter Type
- By Technology
- By Application
- By End-use Industry
- By Sales Channel
- Key Takeaways
- Latin America Market Analysis 2021 to 2025 and Forecast 2026 to 2036, By Country
- Historical Market Size Value (USD Million) Trend Analysis By Market Taxonomy, 2021 to 2025
- Market Size Value (USD Million) Forecast By Market Taxonomy, 2026 to 2036
- By Country
- Brazil
- Chile
- Rest of Latin America
- By Meter Type
- By Technology
- By Application
- By End-use Industry
- By Sales Channel
- By Country
- Market Attractiveness Analysis
- By Country
- By Meter Type
- By Technology
- By Application
- By End-use Industry
- By Sales Channel
- Key Takeaways
- Western Europe Market Analysis 2021 to 2025 and Forecast 2026 to 2036, By Country
- Historical Market Size Value (USD Million) Trend Analysis By Market Taxonomy, 2021 to 2025
- Market Size Value (USD Million) Forecast By Market Taxonomy, 2026 to 2036
- By Country
- Germany
- UK
- Italy
- Spain
- France
- Nordic
- BENELUX
- Rest of Western Europe
- By Meter Type
- By Technology
- By Application
- By End-use Industry
- By Sales Channel
- By Country
- Market Attractiveness Analysis
- By Country
- By Meter Type
- By Technology
- By Application
- By End-use Industry
- By Sales Channel
- Key Takeaways
- Eastern Europe Market Analysis 2021 to 2025 and Forecast 2026 to 2036, By Country
- Historical Market Size Value (USD Million) Trend Analysis By Market Taxonomy, 2021 to 2025
- Market Size Value (USD Million) Forecast By Market Taxonomy, 2026 to 2036
- By Country
- Russia
- Poland
- Hungary
- Balkan & Baltic
- Rest of Eastern Europe
- By Meter Type
- By Technology
- By Application
- By End-use Industry
- By Sales Channel
- By Country
- Market Attractiveness Analysis
- By Country
- By Meter Type
- By Technology
- By Application
- By End-use Industry
- By Sales Channel
- Key Takeaways
- East Asia Market Analysis 2021 to 2025 and Forecast 2026 to 2036, By Country
- Historical Market Size Value (USD Million) Trend Analysis By Market Taxonomy, 2021 to 2025
- Market Size Value (USD Million) Forecast By Market Taxonomy, 2026 to 2036
- By Country
- China
- Japan
- South Korea
- By Meter Type
- By Technology
- By Application
- By End-use Industry
- By Sales Channel
- By Country
- Market Attractiveness Analysis
- By Country
- By Meter Type
- By Technology
- By Application
- By End-use Industry
- By Sales Channel
- Key Takeaways
- South Asia and Pacific Market Analysis 2021 to 2025 and Forecast 2026 to 2036, By Country
- Historical Market Size Value (USD Million) Trend Analysis By Market Taxonomy, 2021 to 2025
- Market Size Value (USD Million) Forecast By Market Taxonomy, 2026 to 2036
- By Country
- India
- ASEAN
- Australia & New Zealand
- Rest of South Asia and Pacific
- By Meter Type
- By Technology
- By Application
- By End-use Industry
- By Sales Channel
- By Country
- Market Attractiveness Analysis
- By Country
- By Meter Type
- By Technology
- By Application
- By End-use Industry
- By Sales Channel
- Key Takeaways
- Middle East & Africa Market Analysis 2021 to 2025 and Forecast 2026 to 2036, By Country
- Historical Market Size Value (USD Million) Trend Analysis By Market Taxonomy, 2021 to 2025
- Market Size Value (USD Million) Forecast By Market Taxonomy, 2026 to 2036
- By Country
- Kingdom of Saudi Arabia
- Other GCC Countries
- Turkiye
- South Africa
- Other African Union
- Rest of Middle East & Africa
- By Meter Type
- By Technology
- By Application
- By End-use Industry
- By Sales Channel
- By Country
- Market Attractiveness Analysis
- By Country
- By Meter Type
- By Technology
- By Application
- By End-use Industry
- By Sales Channel
- Key Takeaways
- Key Countries Market Analysis
- USA
- Pricing Analysis
- Market Share Analysis, 2025
- By Meter Type
- By Technology
- By Application
- By End-use Industry
- By Sales Channel
- Canada
- Pricing Analysis
- Market Share Analysis, 2025
- By Meter Type
- By Technology
- By Application
- By End-use Industry
- By Sales Channel
- Mexico
- Pricing Analysis
- Market Share Analysis, 2025
- By Meter Type
- By Technology
- By Application
- By End-use Industry
- By Sales Channel
- Brazil
- Pricing Analysis
- Market Share Analysis, 2025
- By Meter Type
- By Technology
- By Application
- By End-use Industry
- By Sales Channel
- Chile
- Pricing Analysis
- Market Share Analysis, 2025
- By Meter Type
- By Technology
- By Application
- By End-use Industry
- By Sales Channel
- Germany
- Pricing Analysis
- Market Share Analysis, 2025
- By Meter Type
- By Technology
- By Application
- By End-use Industry
- By Sales Channel
- UK
- Pricing Analysis
- Market Share Analysis, 2025
- By Meter Type
- By Technology
- By Application
- By End-use Industry
- By Sales Channel
- Italy
- Pricing Analysis
- Market Share Analysis, 2025
- By Meter Type
- By Technology
- By Application
- By End-use Industry
- By Sales Channel
- Spain
- Pricing Analysis
- Market Share Analysis, 2025
- By Meter Type
- By Technology
- By Application
- By End-use Industry
- By Sales Channel
- France
- Pricing Analysis
- Market Share Analysis, 2025
- By Meter Type
- By Technology
- By Application
- By End-use Industry
- By Sales Channel
- India
- Pricing Analysis
- Market Share Analysis, 2025
- By Meter Type
- By Technology
- By Application
- By End-use Industry
- By Sales Channel
- ASEAN
- Pricing Analysis
- Market Share Analysis, 2025
- By Meter Type
- By Technology
- By Application
- By End-use Industry
- By Sales Channel
- Australia & New Zealand
- Pricing Analysis
- Market Share Analysis, 2025
- By Meter Type
- By Technology
- By Application
- By End-use Industry
- By Sales Channel
- China
- Pricing Analysis
- Market Share Analysis, 2025
- By Meter Type
- By Technology
- By Application
- By End-use Industry
- By Sales Channel
- Japan
- Pricing Analysis
- Market Share Analysis, 2025
- By Meter Type
- By Technology
- By Application
- By End-use Industry
- By Sales Channel
- South Korea
- Pricing Analysis
- Market Share Analysis, 2025
- By Meter Type
- By Technology
- By Application
- By End-use Industry
- By Sales Channel
- Russia
- Pricing Analysis
- Market Share Analysis, 2025
- By Meter Type
- By Technology
- By Application
- By End-use Industry
- By Sales Channel
- Poland
- Pricing Analysis
- Market Share Analysis, 2025
- By Meter Type
- By Technology
- By Application
- By End-use Industry
- By Sales Channel
- Hungary
- Pricing Analysis
- Market Share Analysis, 2025
- By Meter Type
- By Technology
- By Application
- By End-use Industry
- By Sales Channel
- Kingdom of Saudi Arabia
- Pricing Analysis
- Market Share Analysis, 2025
- By Meter Type
- By Technology
- By Application
- By End-use Industry
- By Sales Channel
- Turkiye
- Pricing Analysis
- Market Share Analysis, 2025
- By Meter Type
- By Technology
- By Application
- By End-use Industry
- By Sales Channel
- South Africa
- Pricing Analysis
- Market Share Analysis, 2025
- By Meter Type
- By Technology
- By Application
- By End-use Industry
- By Sales Channel
- USA
- Market Structure Analysis
- Competition Dashboard
- Competition Benchmarking
- Market Share Analysis of Top Players
- By Regional
- By Meter Type
- By Technology
- By Application
- By End-use Industry
- By Sales Channel
- Competition Analysis
- Competition Deep Dive
- Anton Paar GmbH
- Overview
- Product Portfolio
- Profitability by Market Segments (Product/Age /Sales Channel/Region)
- Sales Footprint
- Strategy Overview
- Marketing Strategy
- Product Strategy
- Channel Strategy
- Mettler Toledo
- Emerson Electric Co.
- Endress+Hauser Group
- Thermo Fisher Scientific Inc.
- Toshiba Corporation
- Yokogawa Electric Corporation
- Anton Paar GmbH
- Competition Deep Dive
- Assumptions & Acronyms Used
List Of Table
- Table 1: Global Market Value (USD Million) Forecast by Region, 2021 to 2036
- Table 2: Global Market Value (USD Million) Forecast by Meter Type, 2021 to 2036
- Table 3: Global Market Value (USD Million) Forecast by Technology, 2021 to 2036
- Table 4: Global Market Value (USD Million) Forecast by Application, 2021 to 2036
- Table 5: Global Market Value (USD Million) Forecast by End-use Industry, 2021 to 2036
- Table 6: Global Market Value (USD Million) Forecast by Sales Channel, 2021 to 2036
- Table 7: North America Market Value (USD Million) Forecast by Country, 2021 to 2036
- Table 8: North America Market Value (USD Million) Forecast by Meter Type, 2021 to 2036
- Table 9: North America Market Value (USD Million) Forecast by Technology, 2021 to 2036
- Table 10: North America Market Value (USD Million) Forecast by Application, 2021 to 2036
- Table 11: North America Market Value (USD Million) Forecast by End-use Industry, 2021 to 2036
- Table 12: North America Market Value (USD Million) Forecast by Sales Channel, 2021 to 2036
- Table 13: Latin America Market Value (USD Million) Forecast by Country, 2021 to 2036
- Table 14: Latin America Market Value (USD Million) Forecast by Meter Type, 2021 to 2036
- Table 15: Latin America Market Value (USD Million) Forecast by Technology, 2021 to 2036
- Table 16: Latin America Market Value (USD Million) Forecast by Application, 2021 to 2036
- Table 17: Latin America Market Value (USD Million) Forecast by End-use Industry, 2021 to 2036
- Table 18: Latin America Market Value (USD Million) Forecast by Sales Channel, 2021 to 2036
- Table 19: Western Europe Market Value (USD Million) Forecast by Country, 2021 to 2036
- Table 20: Western Europe Market Value (USD Million) Forecast by Meter Type, 2021 to 2036
- Table 21: Western Europe Market Value (USD Million) Forecast by Technology, 2021 to 2036
- Table 22: Western Europe Market Value (USD Million) Forecast by Application, 2021 to 2036
- Table 23: Western Europe Market Value (USD Million) Forecast by End-use Industry, 2021 to 2036
- Table 24: Western Europe Market Value (USD Million) Forecast by Sales Channel, 2021 to 2036
- Table 25: Eastern Europe Market Value (USD Million) Forecast by Country, 2021 to 2036
- Table 26: Eastern Europe Market Value (USD Million) Forecast by Meter Type, 2021 to 2036
- Table 27: Eastern Europe Market Value (USD Million) Forecast by Technology, 2021 to 2036
- Table 28: Eastern Europe Market Value (USD Million) Forecast by Application, 2021 to 2036
- Table 29: Eastern Europe Market Value (USD Million) Forecast by End-use Industry, 2021 to 2036
- Table 30: Eastern Europe Market Value (USD Million) Forecast by Sales Channel, 2021 to 2036
- Table 31: East Asia Market Value (USD Million) Forecast by Country, 2021 to 2036
- Table 32: East Asia Market Value (USD Million) Forecast by Meter Type, 2021 to 2036
- Table 33: East Asia Market Value (USD Million) Forecast by Technology, 2021 to 2036
- Table 34: East Asia Market Value (USD Million) Forecast by Application, 2021 to 2036
- Table 35: East Asia Market Value (USD Million) Forecast by End-use Industry, 2021 to 2036
- Table 36: East Asia Market Value (USD Million) Forecast by Sales Channel, 2021 to 2036
- Table 37: South Asia and Pacific Market Value (USD Million) Forecast by Country, 2021 to 2036
- Table 38: South Asia and Pacific Market Value (USD Million) Forecast by Meter Type, 2021 to 2036
- Table 39: South Asia and Pacific Market Value (USD Million) Forecast by Technology, 2021 to 2036
- Table 40: South Asia and Pacific Market Value (USD Million) Forecast by Application, 2021 to 2036
- Table 41: South Asia and Pacific Market Value (USD Million) Forecast by End-use Industry, 2021 to 2036
- Table 42: South Asia and Pacific Market Value (USD Million) Forecast by Sales Channel, 2021 to 2036
- Table 43: Middle East & Africa Market Value (USD Million) Forecast by Country, 2021 to 2036
- Table 44: Middle East & Africa Market Value (USD Million) Forecast by Meter Type, 2021 to 2036
- Table 45: Middle East & Africa Market Value (USD Million) Forecast by Technology, 2021 to 2036
- Table 46: Middle East & Africa Market Value (USD Million) Forecast by Application, 2021 to 2036
- Table 47: Middle East & Africa Market Value (USD Million) Forecast by End-use Industry, 2021 to 2036
- Table 48: Middle East & Africa Market Value (USD Million) Forecast by Sales Channel, 2021 to 2036
List Of Figures
- Figure 1: Global Market Pricing Analysis
- Figure 2: Global Market Value (USD Million) Forecast 2021-2036
- Figure 3: Global Market Value Share and BPS Analysis by Meter Type, 2026 and 2036
- Figure 4: Global Market Y-o-Y Growth Comparison by Meter Type, 2026 to 2036
- Figure 5: Global Market Attractiveness Analysis by Meter Type
- Figure 6: Global Market Value Share and BPS Analysis by Technology, 2026 and 2036
- Figure 7: Global Market Y-o-Y Growth Comparison by Technology, 2026 to 2036
- Figure 8: Global Market Attractiveness Analysis by Technology
- Figure 9: Global Market Value Share and BPS Analysis by Application, 2026 and 2036
- Figure 10: Global Market Y-o-Y Growth Comparison by Application, 2026 to 2036
- Figure 11: Global Market Attractiveness Analysis by Application
- Figure 12: Global Market Value Share and BPS Analysis by End-use Industry, 2026 and 2036
- Figure 13: Global Market Y-o-Y Growth Comparison by End-use Industry, 2026 to 2036
- Figure 14: Global Market Attractiveness Analysis by End-use Industry
- Figure 15: Global Market Value Share and BPS Analysis by Sales Channel, 2026 and 2036
- Figure 16: Global Market Y-o-Y Growth Comparison by Sales Channel, 2026 to 2036
- Figure 17: Global Market Attractiveness Analysis by Sales Channel
- Figure 18: Global Market Value (USD Million) Share and BPS Analysis by Region, 2026 and 2036
- Figure 19: Global Market Y-o-Y Growth Comparison by Region, 2026 to 2036
- Figure 20: Global Market Attractiveness Analysis by Region
- Figure 21: North America Market Incremental Dollar Opportunity, 2026 to 2036
- Figure 22: Latin America Market Incremental Dollar Opportunity, 2026 to 2036
- Figure 23: Western Europe Market Incremental Dollar Opportunity, 2026 to 2036
- Figure 24: Eastern Europe Market Incremental Dollar Opportunity, 2026 to 2036
- Figure 25: East Asia Market Incremental Dollar Opportunity, 2026 to 2036
- Figure 26: South Asia and Pacific Market Incremental Dollar Opportunity, 2026 to 2036
- Figure 27: Middle East & Africa Market Incremental Dollar Opportunity, 2026 to 2036
- Figure 28: North America Market Value Share and BPS Analysis by Country, 2026 and 2036
- Figure 29: North America Market Value Share and BPS Analysis by Meter Type, 2026 and 2036
- Figure 30: North America Market Y-o-Y Growth Comparison by Meter Type, 2026 to 2036
- Figure 31: North America Market Attractiveness Analysis by Meter Type
- Figure 32: North America Market Value Share and BPS Analysis by Technology, 2026 and 2036
- Figure 33: North America Market Y-o-Y Growth Comparison by Technology, 2026 to 2036
- Figure 34: North America Market Attractiveness Analysis by Technology
- Figure 35: North America Market Value Share and BPS Analysis by Application, 2026 and 2036
- Figure 36: North America Market Y-o-Y Growth Comparison by Application, 2026 to 2036
- Figure 37: North America Market Attractiveness Analysis by Application
- Figure 38: North America Market Value Share and BPS Analysis by End-use Industry, 2026 and 2036
- Figure 39: North America Market Y-o-Y Growth Comparison by End-use Industry, 2026 to 2036
- Figure 40: North America Market Attractiveness Analysis by End-use Industry
- Figure 41: North America Market Value Share and BPS Analysis by Sales Channel, 2026 and 2036
- Figure 42: North America Market Y-o-Y Growth Comparison by Sales Channel, 2026 to 2036
- Figure 43: North America Market Attractiveness Analysis by Sales Channel
- Figure 44: Latin America Market Value Share and BPS Analysis by Country, 2026 and 2036
- Figure 45: Latin America Market Value Share and BPS Analysis by Meter Type, 2026 and 2036
- Figure 46: Latin America Market Y-o-Y Growth Comparison by Meter Type, 2026 to 2036
- Figure 47: Latin America Market Attractiveness Analysis by Meter Type
- Figure 48: Latin America Market Value Share and BPS Analysis by Technology, 2026 and 2036
- Figure 49: Latin America Market Y-o-Y Growth Comparison by Technology, 2026 to 2036
- Figure 50: Latin America Market Attractiveness Analysis by Technology
- Figure 51: Latin America Market Value Share and BPS Analysis by Application, 2026 and 2036
- Figure 52: Latin America Market Y-o-Y Growth Comparison by Application, 2026 to 2036
- Figure 53: Latin America Market Attractiveness Analysis by Application
- Figure 54: Latin America Market Value Share and BPS Analysis by End-use Industry, 2026 and 2036
- Figure 55: Latin America Market Y-o-Y Growth Comparison by End-use Industry, 2026 to 2036
- Figure 56: Latin America Market Attractiveness Analysis by End-use Industry
- Figure 57: Latin America Market Value Share and BPS Analysis by Sales Channel, 2026 and 2036
- Figure 58: Latin America Market Y-o-Y Growth Comparison by Sales Channel, 2026 to 2036
- Figure 59: Latin America Market Attractiveness Analysis by Sales Channel
- Figure 60: Western Europe Market Value Share and BPS Analysis by Country, 2026 and 2036
- Figure 61: Western Europe Market Value Share and BPS Analysis by Meter Type, 2026 and 2036
- Figure 62: Western Europe Market Y-o-Y Growth Comparison by Meter Type, 2026 to 2036
- Figure 63: Western Europe Market Attractiveness Analysis by Meter Type
- Figure 64: Western Europe Market Value Share and BPS Analysis by Technology, 2026 and 2036
- Figure 65: Western Europe Market Y-o-Y Growth Comparison by Technology, 2026 to 2036
- Figure 66: Western Europe Market Attractiveness Analysis by Technology
- Figure 67: Western Europe Market Value Share and BPS Analysis by Application, 2026 and 2036
- Figure 68: Western Europe Market Y-o-Y Growth Comparison by Application, 2026 to 2036
- Figure 69: Western Europe Market Attractiveness Analysis by Application
- Figure 70: Western Europe Market Value Share and BPS Analysis by End-use Industry, 2026 and 2036
- Figure 71: Western Europe Market Y-o-Y Growth Comparison by End-use Industry, 2026 to 2036
- Figure 72: Western Europe Market Attractiveness Analysis by End-use Industry
- Figure 73: Western Europe Market Value Share and BPS Analysis by Sales Channel, 2026 and 2036
- Figure 74: Western Europe Market Y-o-Y Growth Comparison by Sales Channel, 2026 to 2036
- Figure 75: Western Europe Market Attractiveness Analysis by Sales Channel
- Figure 76: Eastern Europe Market Value Share and BPS Analysis by Country, 2026 and 2036
- Figure 77: Eastern Europe Market Value Share and BPS Analysis by Meter Type, 2026 and 2036
- Figure 78: Eastern Europe Market Y-o-Y Growth Comparison by Meter Type, 2026 to 2036
- Figure 79: Eastern Europe Market Attractiveness Analysis by Meter Type
- Figure 80: Eastern Europe Market Value Share and BPS Analysis by Technology, 2026 and 2036
- Figure 81: Eastern Europe Market Y-o-Y Growth Comparison by Technology, 2026 to 2036
- Figure 82: Eastern Europe Market Attractiveness Analysis by Technology
- Figure 83: Eastern Europe Market Value Share and BPS Analysis by Application, 2026 and 2036
- Figure 84: Eastern Europe Market Y-o-Y Growth Comparison by Application, 2026 to 2036
- Figure 85: Eastern Europe Market Attractiveness Analysis by Application
- Figure 86: Eastern Europe Market Value Share and BPS Analysis by End-use Industry, 2026 and 2036
- Figure 87: Eastern Europe Market Y-o-Y Growth Comparison by End-use Industry, 2026 to 2036
- Figure 88: Eastern Europe Market Attractiveness Analysis by End-use Industry
- Figure 89: Eastern Europe Market Value Share and BPS Analysis by Sales Channel, 2026 and 2036
- Figure 90: Eastern Europe Market Y-o-Y Growth Comparison by Sales Channel, 2026 to 2036
- Figure 91: Eastern Europe Market Attractiveness Analysis by Sales Channel
- Figure 92: East Asia Market Value Share and BPS Analysis by Country, 2026 and 2036
- Figure 93: East Asia Market Value Share and BPS Analysis by Meter Type, 2026 and 2036
- Figure 94: East Asia Market Y-o-Y Growth Comparison by Meter Type, 2026 to 2036
- Figure 95: East Asia Market Attractiveness Analysis by Meter Type
- Figure 96: East Asia Market Value Share and BPS Analysis by Technology, 2026 and 2036
- Figure 97: East Asia Market Y-o-Y Growth Comparison by Technology, 2026 to 2036
- Figure 98: East Asia Market Attractiveness Analysis by Technology
- Figure 99: East Asia Market Value Share and BPS Analysis by Application, 2026 and 2036
- Figure 100: East Asia Market Y-o-Y Growth Comparison by Application, 2026 to 2036
- Figure 101: East Asia Market Attractiveness Analysis by Application
- Figure 102: East Asia Market Value Share and BPS Analysis by End-use Industry, 2026 and 2036
- Figure 103: East Asia Market Y-o-Y Growth Comparison by End-use Industry, 2026 to 2036
- Figure 104: East Asia Market Attractiveness Analysis by End-use Industry
- Figure 105: East Asia Market Value Share and BPS Analysis by Sales Channel, 2026 and 2036
- Figure 106: East Asia Market Y-o-Y Growth Comparison by Sales Channel, 2026 to 2036
- Figure 107: East Asia Market Attractiveness Analysis by Sales Channel
- Figure 108: South Asia and Pacific Market Value Share and BPS Analysis by Country, 2026 and 2036
- Figure 109: South Asia and Pacific Market Value Share and BPS Analysis by Meter Type, 2026 and 2036
- Figure 110: South Asia and Pacific Market Y-o-Y Growth Comparison by Meter Type, 2026 to 2036
- Figure 111: South Asia and Pacific Market Attractiveness Analysis by Meter Type
- Figure 112: South Asia and Pacific Market Value Share and BPS Analysis by Technology, 2026 and 2036
- Figure 113: South Asia and Pacific Market Y-o-Y Growth Comparison by Technology, 2026 to 2036
- Figure 114: South Asia and Pacific Market Attractiveness Analysis by Technology
- Figure 115: South Asia and Pacific Market Value Share and BPS Analysis by Application, 2026 and 2036
- Figure 116: South Asia and Pacific Market Y-o-Y Growth Comparison by Application, 2026 to 2036
- Figure 117: South Asia and Pacific Market Attractiveness Analysis by Application
- Figure 118: South Asia and Pacific Market Value Share and BPS Analysis by End-use Industry, 2026 and 2036
- Figure 119: South Asia and Pacific Market Y-o-Y Growth Comparison by End-use Industry, 2026 to 2036
- Figure 120: South Asia and Pacific Market Attractiveness Analysis by End-use Industry
- Figure 121: South Asia and Pacific Market Value Share and BPS Analysis by Sales Channel, 2026 and 2036
- Figure 122: South Asia and Pacific Market Y-o-Y Growth Comparison by Sales Channel, 2026 to 2036
- Figure 123: South Asia and Pacific Market Attractiveness Analysis by Sales Channel
- Figure 124: Middle East & Africa Market Value Share and BPS Analysis by Country, 2026 and 2036
- Figure 125: Middle East & Africa Market Value Share and BPS Analysis by Meter Type, 2026 and 2036
- Figure 126: Middle East & Africa Market Y-o-Y Growth Comparison by Meter Type, 2026 to 2036
- Figure 127: Middle East & Africa Market Attractiveness Analysis by Meter Type
- Figure 128: Middle East & Africa Market Value Share and BPS Analysis by Technology, 2026 and 2036
- Figure 129: Middle East & Africa Market Y-o-Y Growth Comparison by Technology, 2026 to 2036
- Figure 130: Middle East & Africa Market Attractiveness Analysis by Technology
- Figure 131: Middle East & Africa Market Value Share and BPS Analysis by Application, 2026 and 2036
- Figure 132: Middle East & Africa Market Y-o-Y Growth Comparison by Application, 2026 to 2036
- Figure 133: Middle East & Africa Market Attractiveness Analysis by Application
- Figure 134: Middle East & Africa Market Value Share and BPS Analysis by End-use Industry, 2026 and 2036
- Figure 135: Middle East & Africa Market Y-o-Y Growth Comparison by End-use Industry, 2026 to 2036
- Figure 136: Middle East & Africa Market Attractiveness Analysis by End-use Industry
- Figure 137: Middle East & Africa Market Value Share and BPS Analysis by Sales Channel, 2026 and 2036
- Figure 138: Middle East & Africa Market Y-o-Y Growth Comparison by Sales Channel, 2026 to 2036
- Figure 139: Middle East & Africa Market Attractiveness Analysis by Sales Channel
- Figure 140: Global Market - Tier Structure Analysis
- Figure 141: Global Market - Company Share Analysis