


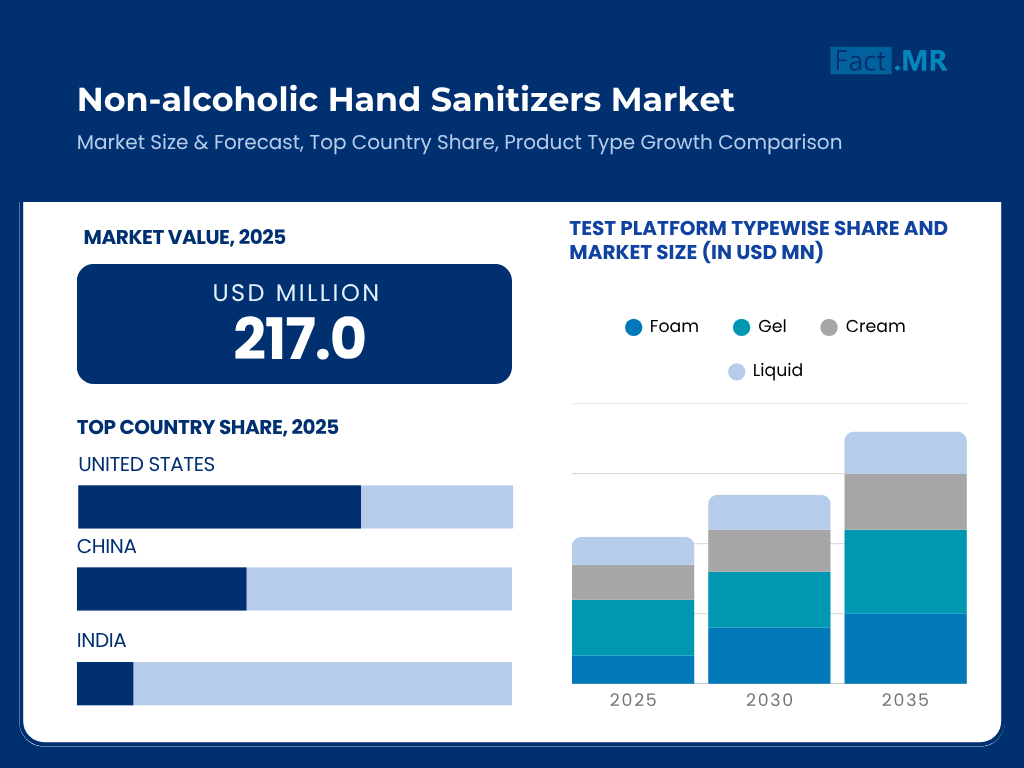
- Base Value(2025): 217 Mn
- Forecast Value (2035): 309 Mn
- CAGR (2035): 3.6%
Non-Alcoholic Hand Sanitizers Market Outlook (2025 to 2035)
The global non-alcoholic hand sanitizers market is expected to reach USD 309 million by 2035, up from USD 211 million in 2024. During the forecast period (2025-2035), the industry is projected to register a CAGR of 3.6%.
The rise in demand for mild and non-irritating sanitary products has led to the use of non-alcoholic hand sanitizers. The increased level of awareness among parents, schools, and healthcare providers about the availability of alcohol-free formulations is catalyzing their adoption in regular sanitization procedures.
What are the drivers of non-alcoholic hand sanitizers market?
The non-alcoholic hand sanitizer market is gaining momentum due to the growing trend towards more natural and skin-friendly hygiene products globally. Customers have been wary of the adverse effects of using alcohol-based preparations that entail drying of the skin and irritation. The use of a moisturized, non-alcohol formulation with naturally occurring moisturizing factors and plant-based substances is gaining popularity among children, the aging population, and even individuals with sensitive skin.
Extreme proprieties and certification by dermatological associations have further enhanced the general belief of consumers in nonalcoholic varieties. Innovations in antimicrobial agents, such as Benzalkonium Chloride and Hypochlorous Acid, are contributing to improved performance, placing the products on the same plateau as, or even surpassing, the efficacy of alcohol-based sanitizers while reducing safety risks.
The pandemic experience has firmly established the behavioral norm of hand hygiene. The use of mild and non-toxic hand sanitizers has expanded in workplaces, schools, colleges, universities, and at home. An increase in demand for sustainable and refillable packaging formats is also fueling the market's growth, driven by eco-conscious consumers.
What are the regional trends of non-alcoholic hand sanitizers market?
Non-alcoholic hand sanitizers are widely used by people in North America, as the level of awareness in this region is high and the product is more commonly used in institutional settings. The rigorous FDA rules, which facilitate the use of skin-safe sanitizers, are also present in the region, which explains the demand.
Skin health considerations and the impact of alcohol-based formulations on skin dehydration and aging are increasingly tilting European consumers toward preferring non-alcoholic sanitizers. An advanced agenda for health and wellness, coupled with widespread consumer education initiatives, has enabled the shift toward alternative skin sanitizers spearheaded by Germany, France, and other Nordic nations. These markets witnessed skyrocketing demand for plant-based skin-nurturing sanitizers that could actually kill germs while being gentle on the skin and the planet.
The Asia Pacific region is fast emerging as one of the high-growth regions, boasting a large population base, rising health consciousness, and an expanding middle class. More consciousness is being advanced at the stocking of the non-alcoholic version, being marketed by brands as the more safe brands to children and families in Japan, South Korea, and India.
Latin America, the Middle East, and Africa are slowly opening up their markets to these products through education and localized marketing as a temporary measure. However, overall, low levels of awareness and minimal budgets act as barriers to the widespread use of these products in the markets.
What are the challenges and restraining factors of non-alcoholic hand sanitizers market?
Although there is a great possibility of growth in non-alcoholic hand sanitizers, a few issues mar their extensive use. Among them is the belief about its lesser efficacy in comparison to alcohol-based.
In addition, many formulae to replace alcohol are slower in their effect, and some worry about the residue or stickiness. These sensorial handicaps have the potential to affect repeat use and satisfaction.
Another limitation is price sensitivity, particularly in developing markets. Non-alcoholic versions tend to contain special ingredients and greener packaging, and most of the time, they are more expensive than their traditional counterparts.
Different standards that governments apply to various markets worldwide further complicate a manufacturer's situation. Certain nonalcoholic agents are not accepted by some regions as effective equivalents, thereby hindering their approval and market entry.
Country-Wise Outlook
Innovation-First Approach Drives Sanitizer Preferences in the U.S.
-2025-2035.webp)
The non-alcoholic hand sanitizers market is led by the United States, driven by increased consumer demand for skin-friendly, non-toxic, and child-safe hygiene products. As the cause and effect of alcohol-based sanitizers, especially on people with sensitive skin and children, becomes more apparent, consumers and health institutions are resorting to using Benzalkonium Chloride or plant-based cleansing agents.
U.S. companies are developing foam-based, long-lasting sanitizers that contain moisturizers and probiotics. Clarity created by the FDA and CDC on regulations has also presented horizontal opportunities to allow hospital-strength non-alcoholic products in clinical and childhood care. The industry is also increasing its use by requiring retailers to signify the use of eco-friendly science solutions via the use of recyclable packaging and natural ingredients.
India Leverages Ayurveda and Public Health Drives for Market Expansion
Through the efforts of the government directed towards hygiene and increased utilization of Ayurvedic and herbal formulations, the country is rapidly emerging as the powerhouse of the non-alcoholic hand sanitizers market. The Indian consumers are also demanding non-alcoholic products, especially those in the Urban and semi-urban regions, which are drinkable and can be consumed daily, even by children and the aged.
Small entrepreneurial pharmaceutical companies and already established pharmaceutical companies have initiated the production of neem, tulsi, and aloe vera-based sanitizer gels, backed by scientific evidence to prove their antimicrobial effects. The major growth avenues comprise the infiltration of e-business and the acquisition of government schools and rural physicians. Additionally, certification by BIS and standardization by AYUSH are enhancing the credibility of the substitute sanitization methodology.
Japan Combines Dermal Safety with High-Tech Hygiene Protocols
Japan has a high market share, leveraging its cultural aspects in hygiene and sensitive-skin products, as well as non-alcoholic hand sanitizers. Consumers are buying non-alcoholic moisturizing and hypoallergenic versions that often contain ingredients such as green tea, hinoki oil, or silver Ions.
Advanced R&D is implementing Japs companies with spray and foam-based solutions that can greatly be utilized in homes, offices, and transportation systems on a regular basis. Robotic and touchless dispenser technologies are also gaining traction in elder care facilities and other community areas, and have been integrated with AI-based hygiene surveillance systems as a nod to the Japan Society 5.0 vision.
Category-Wise Analysis
Foam Formats Reinvent User Experience in Non-Alcoholic Hand Sanitization
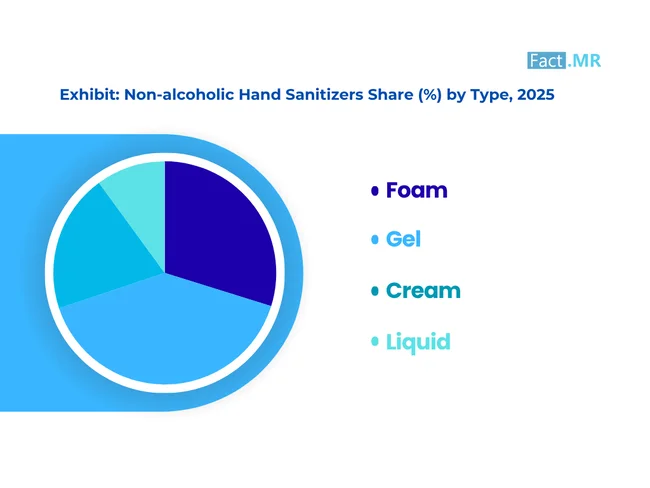
Hand sanitizers in the form of foam are becoming increasingly popular due to their feather-like texture, easy application, and reduced waste. Foams have longer stays on the skin than gels or liquids, and the contact time with the antimicrobial agents is a vital element in the efficacy of these products. They are dripless and thus very suitable for use in healthcare and childcare settings, where accuracy in application is a key factor. Acting as an enticing substitute in non-alcoholic form, where stability and skin friendliness of a formulation are key requisites, a foam can be used, blending both functionality and comfort.
Flip Flop Bottles Offer Practicality and Safety in On-the-Go Hygiene
The flip-flop bottles are becoming a widely used packaging solution for non-alcoholic hand sanitizers, particularly in travel-friendly and personal-use hand sanitizers. Their one-handed use and safe closure minimize the chances of leakage, making them suitable for day-to-day carry-around purses, pockets, and even backpacks. Flip flop bottles will suit the two aspects of portability, ease of use and reduced waste, which make flip flop bottles appeal more to consumers and be more compliant to the laws governing packaging hygiene in areas with stringent laws around the packaging hygiene (like North America and some parts of Europe) or regions where consumers favor convenience.
Below 100 ml Packs Support Travel, Trial, and Regulatory Compliance
The smaller packs, which are below 100 ml, serve multiple strategic purposes: as air travel provisions, samples to trigger marketing, and for individual carry. Such smaller bottles are also aligned with airline security standards (e.g., TSA regulations), thus making the consumer use hygiene solutions even in travel. They can also be used to conduct trial purchases that promote the sampling and widespread adoption of the products in markets that are beginning to adopt alcohol-free sanitization methods due to skin allergies or religious or cultural prohibitions.
Competitive Analysis
Fluid combination of innovation, regulatory compliance and an increasing customer interest in modifying the gentleness of the product, the non-alcoholic hand sanitizers market is formed. As opposed to their alcohol counterparts, the products depend on other antimicrobials like Benzalkonium Chloride, essential oils, and Hypochlorous Acid. This necessitates the formulation of strategies that are both effective and skin-friendly.
This competition is also intensifying with firms segmenting on the grounds of skin safety, eco-friendly wrappings and proclaimed longer germ shields. Entrants are in large numbers, as they exploit the market of pediatric, geriatric, and sensitive skin population segments by modifying their product range. The competitive forces are also exacerbated by clean label positioning, which often involves natural or organic ingredients.
Speaking of distribution, brands that leverage e-commerce and direct-to-consumer (DTC) distribution are gaining momentum, especially among younger consumers who are increasingly health-conscious. The long-term revenue is also generated after partnerships with other institutions, such as schools and workplaces. A lack of alcohol requires a significant increase in consumer education, and in this regard, branding and the creation of trust are key to success in the market.
Key players in the non-alcoholic hand sanitizers industry include Vi-Jon Laboratories, GOJO Industries, Inc., SC Johnson, Safe Hands, Klenza, Dubi Chem, Cleenol, Kutol, Dr. Batra, Fine Guard, Krauter Healthcare Limited, Dalrada Corporation (Glan Health), Gem Chemical (HealthGaurd), and other notable companies.
Recent Development
- In June 2025, Parul University (India) secured a patent for a herbal, alcohol‑free hand sanitizer made with cinchona and aloe vera extracts, effective against E. coli, Staphylococcus aureus, and Bacillus. It comes in four natural fragrances and is kinder to sensitive skin.
- In May 2024, SC Johnson Professional launched InstantFOAM™ Non‑Alcohol PURE, a dye‑ and perfume‑free foaming sanitizer with skin conditioners, ideal for settings where alcohol products are unsuitable.
Fact.MR has provided detailed information about the price points of key manufacturers in the non-alcoholic hand sanitizers market, positioned across regions, including sales growth, production capacity, and speculative technological expansion, in the recently published report.
Methodology and Industry Tracking Approach
Fact.MR has performed a worldwide market study of non-alcoholic hand sanitizers in 2025. They were based on the insights gathered through the responses of more than 5,100 qualified respondents from 18 countries, with a specific focus on regional hygiene habits and product availability.
All country-level segments included at least 130 professionals who were chosen based on their active involvement in areas related to healthcare, personal care production, and institutional sanitary purchasing.
The author conducted the research between June 2024 and May 2025 and took 12 months. The analytical parameters included seasonal changes in demand, innovations in alcohol-free antimicrobials (new formulations of BZK and Essential oils), regulatory transitions towards non-flammable disinfectants, and price sensitivity in institutional and retail settings.
Results were also supported by a comparative validation process involving over 110 individual resources, including global hygiene guidelines, reports on infection control, formulation chemistry, and antimicrobial applications product lifecycles.
Fact.MR has been monitoring this market and its proliferating range across alcohol alternatives, eco-label observances, and cost-wide-ranging analysis of quaternary ammonium compounds (QACs) and botanical sanitizing elements in comparison to ethanol- or isopropanol-based arrangements.
Segmentation of Non-alcoholic Hand Sanitizers Market
-
By Product Form :
- Foam
- Gel
- Cream
- Liquid
-
By Packaging Type :
- Flip Flop Bottles
- Pump Bottles
- Spray Bottles
- Others
-
By Pack Size :
- Below 100 ml
- 101 ml - 300 ml
- 301 ml - 500 ml
- 501 ml & Above
-
By End Use :
- Institutional
- Hospitals & Healthcare
- Offices/Commercial
- Horeca
- Manufacturing & Industrial
- Retail Grocery / Pharmacy Stores
- Others
- Household
- Institutional
-
By Sales Channel :
- Offline
- Pharmacy & Drug Stores
- Mom & Pop Stores
- Hypermarkets / Departmental Stores
- Others
- Online
- E-Commerce Website
- Company / Brand Websites
- Offline
-
By Region :
- North America
- Latin America
- Western Europe
- Eastern Europe
- East Asia
- South Asia & Pacific
- Middle East & Africa
- Frequently Asked Questions -
What was the global Non-alcoholic hand sanitizers market size reported by Fact.MR for 2025?
The Global Non-alcoholic hand sanitizers market was valued at USD 217 Million in 2025.
Who are the major players operating in the Non-alcoholic hand sanitizers market?
Prominent players in the market Vi-Jon Laboratories, GOJO Industries, Inc., SC Johnson, Safe Hands, Klenza, Dubi Chem, Cleenol, Kutol, Dr. Batra, Fine Guard, Krauter Healthcare Limited, Dalrada Corporation (Glan Health), and Gem Chemical (HealthGaurd).
What is the Estimated Valuation of the Non-alcoholic hand sanitizers market in 2035?
The market is expected to reach a valuation of USD 309 Million in 2035.
What Value CAGR did the Non-alcoholic hand sanitizers market exhibit over the last five years?
The historic growth rate of the Non-alcoholic hand sanitizers market was 2.8% from 2020 to 2024.