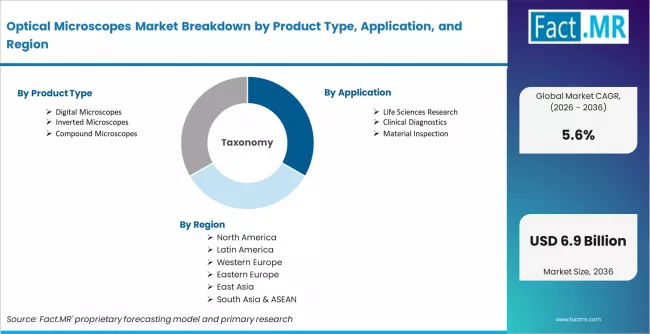
Optical Microscopes Market Size, Share, Growth and Forecast (2026 - 2036)
The Optical Microscopes Market is segmented by Product Type (Stereo Microscopes, Digital Microscopes, Inverted Microscopes, Compound Microscopes, and Fluorescence Microscopes), Application (Life Sciences Research, Clinical Diagnostics, Material Inspection, Education, and Industrial Quality Control), End User (Academic and Research Institutes, Hospitals and Diagnostic Laboratories, Pharmaceutical and Biotechnology Companies, Industrial Laboratories, and Educational Institutions), Configuration (Upright Microscopes, Inverted Microscopes, Portable Microscopes, Benchtop Microscopes, and Automated Microscopy Systems), Sales Channel (Direct Institutional Sales, Distributor Sales, Online Scientific Supply, Group Contract Sales, and Service-Linked Supply), and Region. Forecast for 2026 to 2036.
Fact.MR analysis indicates that the optical microscopes market is moving through a digital workflow and application-depth phase. Laboratories, hospitals, universities, and industrial inspection units are evaluating microscopes through image clarity, camera integration, software usability, and service support. Demand is gaining depth where biological research, pathology, materials testing, and education require visual inspection with repeatable documentation.
Optical Microscopes Market Forecast and Outlook By FactMR
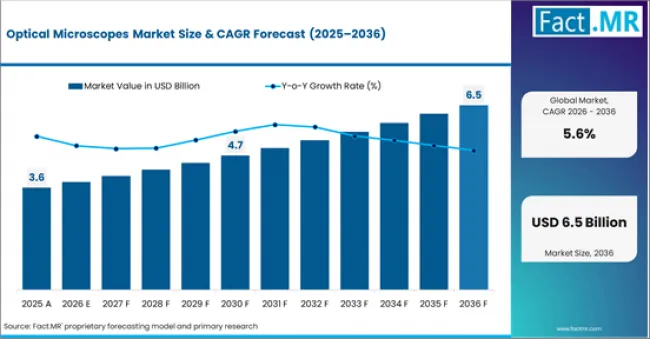
- In 2025, the optical microscopes market was valued at USD 3.6 billion.
- Based on revised Fact.MR analysis, demand for optical microscopes is estimated to grow to USD 3.8 billion in 2026 and USD 6.5 billion by 2036.
- Fact.MR projects a CAGR of 5.6% during the forecast period.
| Metric | Value |
|---|---|
| Estimated Value in 2026 | USD 3.8 billion |
| Forecast Value in 2036 | USD 6.5 billion |
| Forecast CAGR (2026 to 2036) | 5.6% |
Summary of Optical Microscopes Market
- Market Definition
- The market includes light-based microscopes used for biological research, clinical diagnostics, materials inspection, industrial quality control, and education.
- Demand Drivers
- Biomedical research laboratories are using optical imaging to study cells, tissues, and disease models with better documentation.
- Clinical laboratories need reliable microscopes for routine pathology, hematology, microbiology, and sample review workflows.
- Industrial quality managers use microscopy for surface inspection, defect review, and measurement in electronics and materials manufacturing.
- Key Segments Analyzed
- By Product Type: Digital microscopes are expected to hold approximately 31.0% share in 2026, supported by image capture, documentation, and training use.
- By Application: Life sciences research leads in 2026 with nearly 34.0% share, as cell biology and tissue analysis keep microscope use steady.
- By End User: Academic and research institutes account for around 36.0% share in 2026, driven by laboratory teaching and research workflows.
- By Configuration: Benchtop microscopes hold about 42.0% share in 2026, supported by routine lab use and durable installation.
- By Sales Channel: Distributor sales are projected to lead with 39.0% share in 2026, as laboratories rely on scientific equipment channels and service access.
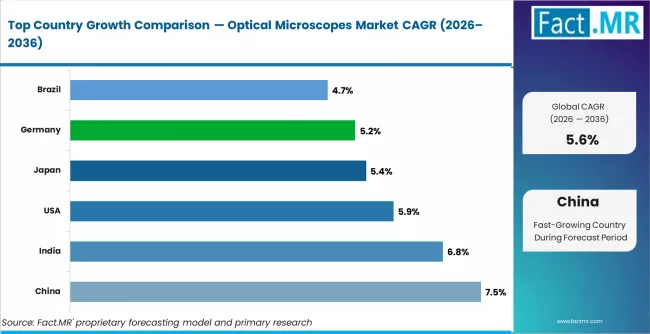
- By Geography: China leads growth through 2036 at 7.5% CAGR, supported by laboratory expansion and domestic instrument manufacturing.
- Analyst Opinion at Fact.MR
- Shambhu Nath Jha, Senior Analyst at Fact.MR, states, “Optical microscope demand is no longer measured only by magnification range. The stronger shift is toward imaging workflow, documentation quality, and application-specific service support. Suppliers that can support digital capture, user training, and long-term calibration reliability will hold a better position than companies competing only on instrument price.”
- Strategic Implications
- Manufacturers should improve camera integration and software usability because laboratories now evaluate microscopes through documentation workflow.
- Research institutes need service-ready suppliers to avoid downtime in shared microscopy facilities.
- Distributors should prioritize training and calibration support because microscope performance depends on correct setup and user familiarity.
- Methodology
- Market sizing uses laboratory equipment demand, installed base replacement, microscopy facility expansion, and application-level instrument use.
- Analysis includes NIH imaging resources, ISO laboratory standards, company product catalogues, distributor listings, and institutional research infrastructure.
- Forecasts account for life sciences research growth, diagnostic laboratory demand, industrial inspection needs, digital microscopy adoption, and regional education spending.
The market is projected to generate USD 2.7 billion in absolute opportunity between 2026 and 2036. Growth is supported by life sciences research, clinical diagnostics, semiconductor and materials inspection, and university laboratory upgrades. NIH resources describe optical imaging and advanced microscopy as important tools for biomedical research, which supports ongoing microscope demand in research laboratories [1]. ISO/IEC 17025 also reinforces the importance of competent testing and calibration laboratories, which supports inspection and quality-control microscopy use.
China leads with a projected CAGR of 7.5% through 2036, supported by laboratory expansion and domestic manufacturing scale. India follows at 6.8%, helped by university laboratory upgrades and biotechnology research growth. The United States records 5.9%, with demand anchored in biomedical research and clinical laboratory use. Japan grows at 5.4%, supported by established microscope manufacturing and materials inspection. Germany advances at 5.2%, backed by industrial quality control and life sciences research. Brazil posts 4.7%, supported by diagnostic laboratory growth and university research investment.
Segmental Analysis
Optical Microscopes Market Analysis by Product Type
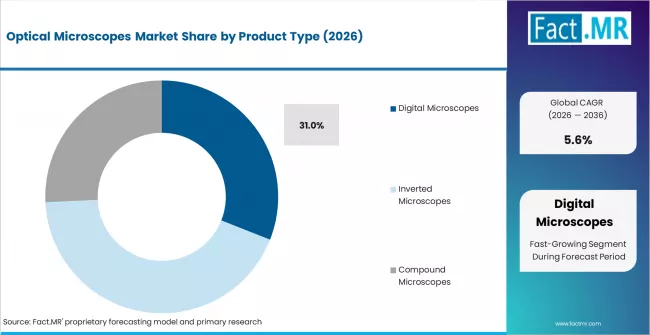
Digital microscopes are expected to hold 31.0% share in 2026 because users increasingly need image capture, screen viewing, and documentation within the same workflow. Laboratories and classrooms use digital systems to share images, record observations, and support collaborative review. Industrial users also prefer digital microscopes where defect inspection needs measurement, annotation, and repeatable reporting. Nikon’s microscope product information highlights optics, cameras, software, and supported imaging workflows, showing how microscope value now extends beyond lenses alone. Stereo and compound microscopes remain important for routine use, but digital models gain share where documentation matters. Facilities that rely only on older optical-only setups may face slower reporting and weaker training support.
- Image Capture: Digital microscopes help users record and share observations without separate camera setups.
- Training Use: Screen-based viewing supports classroom instruction and group review.
- Inspection Records: Industrial users can document defects, measurements, and repeat checks more easily.
Optical Microscopes Market Analysis by Application
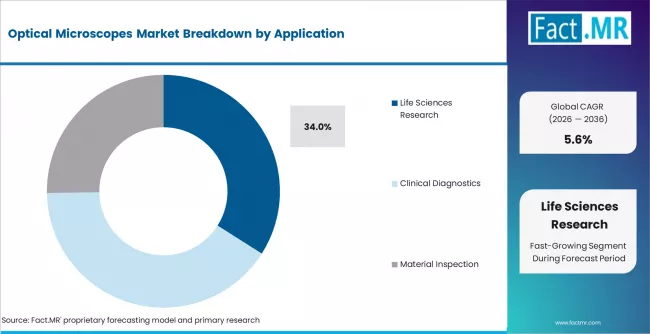
Life sciences research creates the largest application base because cell biology, tissue analysis, microbiology, and developmental studies depend on routine visual observation. This application is estimated to account for 34.0% share in 2026. Research laboratories need microscopes for sample preparation checks, live-cell observation, fluorescence work, and teaching support. NIH describes advanced imaging and microscopy resources as important for studying health and disease, which supports demand across biomedical research environments. Clinical diagnostics and industrial inspection remain important, but life sciences research keeps the broadest instrument use. Laboratories that lack dependable microscopes may face slower sample review and weaker experimental documentation.
- Cell Observation: Life sciences researchers use microscopes for routine analysis of cells, tissues, and microorganisms.
- Research Documentation: Image capture supports experiment records and peer review workflows.
- Facility Sharing: Core laboratories need reliable microscopes that support multiple users and applications.
Optical Microscopes Market Analysis by End User
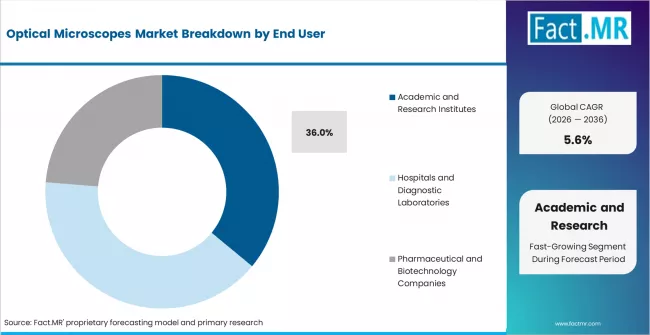
Academic and research institutes remain the largest users because microscopes are needed across teaching laboratories, shared research facilities, and grant-supported research programs. The end-user base is expected to be led by academic and research institutes with 36.0% share in 2026. Universities and research centers use microscopes across biology, materials science, chemistry, and engineering programs. NIH’s Advanced Imaging and Microscopy Resource shows how shared optical imaging facilities support scientific research across multiple disciplines. Hospitals and diagnostic laboratories use microscopes heavily, but academic institutes keep the largest installed base because teaching and research demand overlap. Weak service support can disrupt laboratory classes and shared research schedules.
- Teaching Base: Universities need microscopes for practical training across science programs.
- Shared Facilities: Research institutes use microscopy cores to support many projects.
- Grant-Linked Demand: Funded laboratory upgrades can drive replacement of older instruments.
Optical Microscopes Market Analysis by Configuration
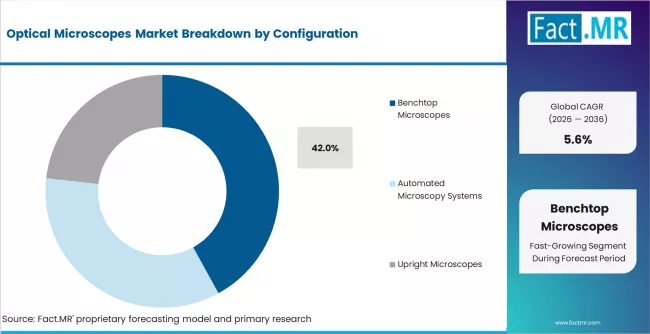
Benchtop microscopes lead because most laboratories prefer stable, durable systems for routine observation and repeat use. Benchtop systems are projected to account for 42.0% share in 2026. These configurations support compound, stereo, inverted, and digital models used across research, diagnostics, education, and quality control. ISO/IEC 17025 emphasizes reliable laboratory results and competence, which makes stable instrument setup important in testing and calibration environments. Portable microscopes serve field and classroom use, while automated systems gain adoption in higher-throughput labs. Benchtop systems retain leadership because they fit daily workflows and long service life. Poorly configured systems can reduce image quality and user confidence.
- Stable Setup: Benchtop systems support consistent focus, illumination, and sample handling.
- Routine Use: Laboratories rely on fixed microscope stations for repeated daily work.
- Service Fit: Durable configurations make calibration and maintenance easier for institutions.
Optical Microscopes Market Analysis by Sales Channel
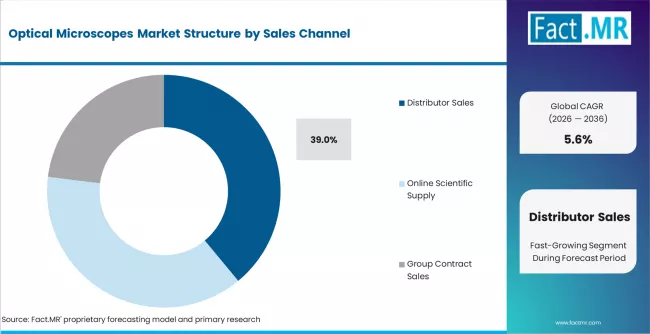
Distributor sales remain strong because laboratories need instrument selection, accessories, delivery, installation, and service support from scientific equipment channels. Distributor sales are expected to account for 39.0% share in 2026. This channel leads where universities, hospitals, and industrial labs buy microscopes alongside objectives, cameras, slides, reagents, and service contracts. Direct institutional sales remain important for large research centers and industrial accounts. Online scientific supply channels serve entry-level and educational purchases. ZEISS lists broad light microscope product lines for routine and research use, while distributor channels help translate product options into local purchasing support. Weak channel service can delay installation and reduce user confidence.
- Local Support: Distributors help laboratories choose instruments and accessories suited to workflow needs.
- Installation Help: Microscope setup often requires alignment, training, and basic service guidance.
- Accessory Supply: Objectives, cameras, bulbs, slides, and maintenance parts create recurring channel demand.
Drivers, Restraints, and Opportunities
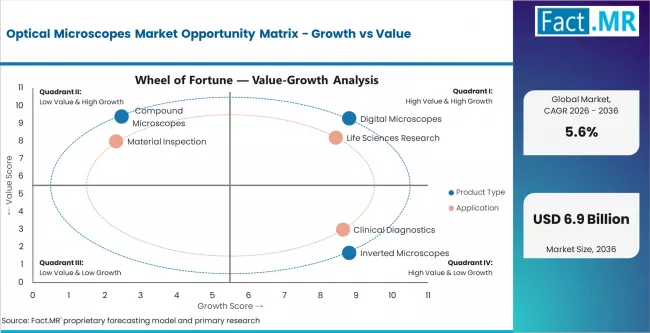
Life sciences research, diagnostic review, and industrial inspection are increasing the need for optical microscopes that support visual analysis and digital records. Research laboratories need dependable systems for cell and tissue observation. Industrial users need microscopes for surface inspection and quality checks. NIH resources show optical imaging remains important for studying biological structure and disease-related processes. Demand improves where users connect microscope selection with documentation quality, measurement accuracy, and training workflow. Digital cameras and software are turning routine microscopes into data capture tools.
Price pressure and equipment longevity restrain faster replacement. Many laboratories continue using older microscopes when optics remain functional. Advanced digital or fluorescence models require higher capital budgets and trained users. Smaller colleges and clinics may delay upgrades when service access is limited. Industrial users also require calibration and ruggedness before switching systems. Suppliers must prove workflow value, not only higher magnification, before buyers justify replacement.
- Digital Documentation: Camera-integrated microscopes can gain share where labs need image records and remote review.
- Industrial Inspection: Electronics, materials, and manufacturing labs create demand for measurement-ready optical systems.
- Education Upgrades: Universities and schools can expand demand through digital teaching microscopes and shared-viewing systems.
Regional Analysis
The optical microscopes market is assessed across North America, Europe, Asia Pacific, Latin America, and Middle East and Africa, covering 40+ countries with demand profiles shaped by research funding, laboratory infrastructure, diagnostic capacity, manufacturing inspection, education spending, and scientific instrument distribution.
.webp)
| Country | CAGR (2026 to 2036) |
|---|---|
| China | 7.5% |
| India | 6.8% |
| USA | 5.9% |
| Japan | 5.4% |
| Germany | 5.2% |
| Brazil | 4.7% |
Source: Fact.MR analysis, based on proprietary forecasting model and primary research
Asia Pacific Optical Microscopes Market Analysis
Asia Pacific records the strongest growth because research laboratories, manufacturing inspection, and education infrastructure are expanding together. China and India are adding university laboratories, diagnostic capacity, and local instrument distribution. Japan adds a stable demand base through established optical technology, life sciences research, and industrial inspection. Fact.MR identifies Asia Pacific as a high-growth region, supported by manufacturers in Japan and expanding local manufacturing in China and India. The region includes premium research laboratories and price-sensitive education buyers. Suppliers need portfolios that balance optical performance with affordability and service reach. Growth depends on trained users, local distributors, and upgrade spending.
- China: China leads the country outlook as laboratory expansion and domestic manufacturing strengthen optical microscope demand. The country is projected to grow at 7.5% CAGR by 2036. Research institutes, diagnostic laboratories, universities, and industrial inspection units support broad instrument use. Local suppliers compete in standard microscopes, while premium brands retain demand in advanced research and quality-control labs. Buyers weigh image quality, service response, and software support before selecting suppliers.
- India: University laboratory upgrades and biotechnology research growth support optical microscope demand in India. Educational institutions and diagnostic labs remain important buyers, while industrial inspection adds demand in electronics and materials work. India is forecast to grow at 6.8% CAGR through 2036. Price sensitivity remains important, but buyers still need reliable optics and service support. Suppliers that combine accessible pricing with training support can improve adoption.
- Japan: Established microscope manufacturing and materials inspection support steady demand in Japan. Research laboratories and industrial users value precision optics, stable illumination, and long-term service. Japan is projected to post 5.4% CAGR from 2026 to 2036. Growth is moderate because microscope access is already well developed. Suppliers with advanced digital and fluorescence systems can maintain demand through replacement cycles.
North America Optical Microscopes Market Analysis
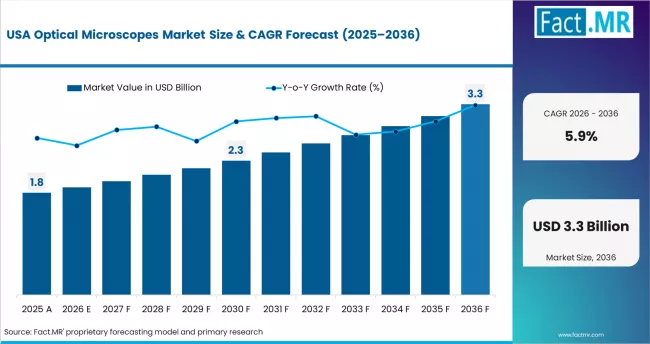
North America remains a high-value region because biomedical research, clinical laboratories, and industrial quality control support advanced microscope demand. The United States anchors regional use across academic research, pathology, pharmaceutical laboratories, semiconductor inspection, and teaching facilities. NIH advanced imaging resources reinforce the role of microscopy in health and disease research. Buyers often evaluate microscopes through imaging quality, camera integration, software workflow, and service support. The region has strong demand for digital and fluorescence systems, but long equipment life can slow replacement. Suppliers must defend value through workflow efficiency and application support.
- USA: The United States has a large base of biomedical research laboratories, universities, clinical laboratories, and industrial inspection users. Optical microscope demand is anchored in life sciences research, pathology, education, and materials testing. The country is projected to record 5.9% CAGR over the assessment period. Digital systems gain attention where labs need image documentation and remote sharing. Purchasers examine optics, software compatibility, service coverage, and total ownership cost before upgrades.
Europe Optical Microscopes Market Analysis
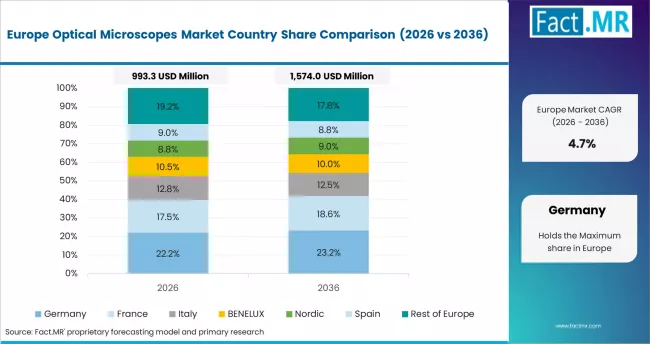
Europe shows steady demand because research laboratories, diagnostic facilities, and industrial quality systems are well established. Germany leads the region through strong manufacturing inspection, life sciences research, and scientific instrument adoption. ISO/IEC 17025 supports laboratory competence and reliable test results, which reinforces demand for maintained inspection instruments in accredited environments [2]. Hospitals and research institutes emphasize image quality, documentation, and calibration discipline. Demand growth is moderate because many users already have installed microscope bases. Suppliers compete through application support, software integration, and service reliability.
- Germany: Germany benefits from industrial quality control, life sciences research, and advanced laboratory infrastructure. Demand is linked to materials inspection, clinical diagnostics, education, and biotechnology research. Germany is forecast to grow at 5.2% CAGR through 2036. Laboratories tend to favor suppliers with strong optics, documentation tools, and reliable service. Industrial users evaluate systems through repeatable measurement and integration with quality workflows.
Latin America Optical Microscopes Market Analysis
Latin America shows selective growth where diagnostic laboratories, universities, and industrial inspection units are improving equipment access. Brazil leads regional demand because urban diagnostic networks, university laboratories, and materials testing facilities require reliable microscopes. Price sensitivity remains a key restraint, especially for advanced fluorescence and automated systems. Suppliers need strong distributor support and practical pricing models. Demand improves when laboratories can secure service, spare parts, and user training. Growth remains uneven because public education budgets and research funding vary across countries.
- Brazil: Diagnostic laboratory growth and university research investment support optical microscope demand in Brazil. Routine clinical review, teaching labs, and industrial inspection are important demand areas in urban centers. Brazil is projected to expand at 4.7% CAGR over the study period. Buyers often compare affordability with service reliability before selecting microscope systems. Distributors play a major role in installation, training, and accessory supply. Suppliers that offer dependable systems at accessible price points can strengthen adoption.
Fact.MR analysis of regional demand covers Asia Pacific, North America, Europe, Latin America, and Middle East and Africa. The study assesses research infrastructure, diagnostic laboratory capacity, education spending, industrial inspection needs, and supplier support across major markets.
Competitive Aligners for Market Players
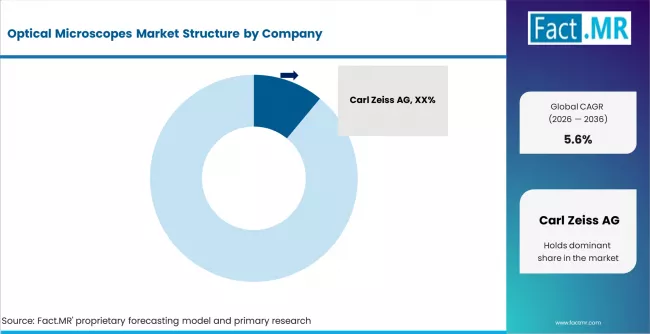
The optical microscopes market is moderately concentrated in advanced research and digital systems, but more fragmented in basic educational and routine laboratory microscopes. Large global suppliers hold advantages because optical precision, software integration, service networks, and application support create switching barriers. Regional suppliers often compete in basic compound, stereo, and classroom microscopes.
Competitive advantage depends on optical quality, camera integration, digital documentation, illumination stability, software usability, and service support. Carl Zeiss, Nikon, Olympus/Evident, Leica Microsystems, Meiji Techno, Motic, Keyence, Bruker, and Euromex represent supplier groups where product depth and user support matter. Laboratories are less likely to switch suppliers when staff are trained on specific systems and accessories are already standardized.
The market is divided between high-value research microscopes and volume-driven routine or educational systems. Suppliers that combine dependable optics with digital workflow and training support can protect institutional demand. Regional companies can gain ground where affordability and distributor reach matter most.
Key Players
- Carl Zeiss AG
- Nikon Instruments Inc.
- Leica Microsystems GmbH
- Olympus Corporation / Evident Corporation
- Meiji Techno Co., Ltd.
- Motic
- Keyence Corporation
- Bruker Corporation
- Euromex Microscopen BV
- Labomed, Inc.
- Celestron, LLC
- Accu-Scope Inc.
Bibliography
- [1] National Institute of Biomedical Imaging and Bioengineering. (2024). Optical Imaging. NIH.
- [2] International Organization for Standardization. (2024). ISO/IEC 17025 Testing and Calibration Laboratories. ISO.
- [3] National Institute of Biomedical Imaging and Bioengineering. (2024). Advanced Imaging and Microscopy Resource. NIH.
- [4] National Institute of Standards and Technology. (2024). National Voluntary Laboratory Accreditation Program. NIST.
This Report Addresses
- Strategic intelligence on optical microscope demand across life sciences research, clinical diagnostics, education, material inspection, and industrial quality control globally.
- Market forecast from USD 3.8 billion in 2026 to USD 6.5 billion by 2036 at a CAGR of 5.60%.
- Growth opportunity mapping across China laboratory expansion, India university upgrades, U.S. biomedical research, Japan microscope manufacturing strength, and Germany industrial quality control.
- Segment analysis by product type, application, end user, configuration, sales channel, and region.
- Regional outlook covering Asia Pacific laboratory expansion, North America advanced research microscopy, and Europe accreditation-driven laboratory practice.
- Competitive analysis of Carl Zeiss, Nikon Instruments, Leica Microsystems, Olympus/Evident, Meiji Techno, Motic, Keyence, Bruker, Euromex, and Labomed.
- Instrument adoption analysis covering image quality, digital documentation, service support, calibration, software usability, and application training.
- Report delivered with market sizing, segment outlook, regional analysis, company profiling, and forecast assumptions.
Optical Microscopes Market Definition
The market covers optical microscopes that use visible light and optical lenses to magnify biological, clinical, material, and industrial samples. It includes stereo, digital, inverted, compound, and fluorescence microscopes used for observation, documentation, measurement, and routine inspection. The scope covers instruments, optical systems, cameras, basic software, and microscope configurations supplied to laboratories, hospitals, universities, and industrial users.
Optical Microscopes Market Inclusions
The study includes global and regional forecasts from 2026 to 2036. It covers microscopes used in life sciences research, clinical diagnostics, pathology, materials testing, education, semiconductor inspection, and industrial quality control. It includes manual, digital, automated, upright, inverted, portable, and benchtop systems supplied through direct institutional, distributor, and online scientific supply channels.
Optical Microscopes Market Exclusions
The scope excludes electron microscopes, scanning probe microscopes, ophthalmic diagnostic systems, standalone camera modules, image analysis software sold without microscope systems, and laboratory consumables used during microscopy. It also excludes telescopes and optical inspection tools not designed for microscopic observation. The focus stays on light-based microscopes used for scientific, diagnostic, educational, and industrial sample analysis.
Optical Microscopes Market Research Methodology
- Primary Research
- Interviews with laboratory directors, microscopy facility managers, pathology laboratory heads, biomedical researchers, industrial quality managers, university lab administrators, and scientific instrument distributors across major consuming regions.
- Desk Research
- Uses research facility information, laboratory accreditation references, microscopy product catalogues, scientific imaging resources, and company product information from leading instrument suppliers.
- Market-Sizing and Forecasting
- Hybrid model using installed microscope base, laboratory replacement cycles, research facility expansion, clinical diagnostic demand, educational procurement, and average selling prices by product type.
- Data Validation and Update Cycle
- Forecasts were validated through distributor channel checks, institutional purchasing patterns, laboratory equipment references, product availability, and regional research infrastructure indicators.
Scope of Report

| Attribute | Details |
|---|---|
| Quantitative Units | USD 3.8 billion (2026) to USD 6.5 billion (2036), at a CAGR of 5.60% |
| Market Definition | Light-based microscopes used for biological, clinical, educational, materials, and industrial sample observation and documentation |
| Forecast Period | 2026 to 2036 |
| Historical Reference | 2025 |
| Product Type Covered | Stereo microscopes, digital microscopes, inverted microscopes, compound microscopes, fluorescence microscopes |
| Application Covered | Life sciences research, clinical diagnostics, material inspection, education, industrial quality control |
| End User Covered | Academic and research institutes, hospitals and diagnostic laboratories, pharmaceutical and biotechnology companies, industrial laboratories, educational institutions |
| Configuration Covered | Upright microscopes, inverted microscopes, portable microscopes, benchtop microscopes, automated microscopy systems |
| Sales Channel Covered | Direct institutional sales, distributor sales, online scientific supply, group contract sales, service-linked supply |
| Regions Covered | North America, Europe, Asia Pacific, Latin America, Middle East and Africa |
| Countries Covered | USA, Canada, Mexico, Germany, UK, France, Italy, Spain, Nordic, BENELUX, China, Japan, India, ASEAN, Australia and New Zealand, Brazil, Argentina, Chile, Saudi Arabia, GCC, Turkey, South Africa, and Rest of MEA |
| Key Companies Profiled | Carl Zeiss, Nikon Instruments, Leica Microsystems, Olympus/Evident, Meiji Techno, Motic, Keyence, Bruker, Euromex, Labomed, Celestron, Accu-Scope |
| Approach | Hybrid top-down and bottom-up model using installed base, laboratory replacement cycles, research facility expansion, diagnostic laboratory demand, education procurement, industrial inspection use, and primary interviews with laboratory and microscopy users |
Optical Microscopes Market by Segments
-
By Product Type:
- Stereo Microscopes
- Digital Microscopes
- Inverted Microscopes
- Compound Microscopes
- Fluorescence Microscopes
-
By Application:
- Life Sciences Research
- Clinical Diagnostics
- Material Inspection
- Education
- Industrial Quality Control
-
By End User:
- Academic and Research Institutes
- Hospitals and Diagnostic Laboratories
- Pharmaceutical and Biotechnology Companies
- Industrial Laboratories
- Educational Institutions
-
By Configuration:
- Upright Microscopes
- Inverted Microscopes
- Portable Microscopes
- Benchtop Microscopes
- Automated Microscopy Systems
-
By Sales Channel:
- Direct Institutional Sales
- Distributor Sales
- Online Scientific Supply
- Group Contract Sales
- Service-Linked Supply
-
By Region:
- North America
- United States
- Canada
- Mexico
- Latin America
- Brazil
- Argentina
- Chile
- Rest of Latin America
- Western Europe
- Germany
- France
- United Kingdom
- Italy
- Spain
- Nordic Countries
- BENELUX
- Rest of Western Europe
- Eastern Europe
- Russia
- Poland
- Hungary
- Balkan and Baltic
- Rest of Eastern Europe
- East Asia
- China
- Japan
- South Korea
- South Asia and Pacific
- India
- ASEAN
- Australia and New Zealand
- Rest of South Asia and Pacific
- Middle East and Africa
- Kingdom of Saudi Arabia
- Other GCC Countries
- Turkey
- South Africa
- Rest of Middle East and Africa
- North America
- Frequently Asked Questions -
How large is the global optical microscopes market in 2025?
The global optical microscopes market was valued at USD 3.6 billion in 2025.
What will the market size be in 2026?
Based on revised Fact.MR analysis, demand for optical microscopes is estimated to grow to USD 3.8 billion in 2026.
What is the projected market size by 2036?
The market is projected to reach USD 6.5 billion by 2036, generating USD 2.7 billion in absolute dollar opportunity.
What is the expected CAGR from 2026 to 2036?
Fact.MR projects a CAGR of 5.60% for the global optical microscopes market during the forecast period.
Which product type is poised to lead the market?
Digital microscopes lead with approximately 31.0% share in 2026 due to image capture, documentation, and training use.
Which application accounts for the largest demand?
Life sciences research accounts for nearly 34.0% share in 2026 due to cell biology, tissue analysis, and biomedical research workflows.
Which end user leads the market?
Academic and research institutes account for around 36.0% share in 2026 because teaching and research use overlap across laboratories.
Which configuration holds the highest share?
Benchtop microscopes hold about 42.0% share in 2026 due to routine laboratory use and durable installation.
Which sales channel leads demand?
Distributor sales hold around 39.0% share in 2026 because laboratories rely on scientific equipment channels and local service access.
Which country shows the fastest growth?
China leads at 7.5% CAGR through 2036, supported by laboratory expansion and domestic manufacturing scale.
What is driving demand for optical microscopes?
Demand is driven by life sciences research, clinical diagnostics, materials inspection, education upgrades, and digital documentation needs.
What is the key challenge in this market?
Long equipment replacement cycles, price pressure, and limited service access slow upgrades across smaller laboratories.
Table of Content
- Executive Summary
- Global Market Outlook
- Demand to side Trends
- Supply to side Trends
- Technology Roadmap Analysis
- Analysis and Recommendations
- Market Overview
- Market Coverage / Taxonomy
- Market Definition / Scope / Limitations
- Research Methodology
- Chapter Orientation
- Analytical Lens and Working Hypotheses
- Market Structure, Signals, and Trend Drivers
- Benchmarking and Cross-market Comparability
- Market Sizing, Forecasting, and Opportunity Mapping
- Research Design and Evidence Framework
- Desk Research Programme (Secondary Evidence)
- Company Annual and Sustainability Reports
- Peer-reviewed Journals and Academic Literature
- Corporate Websites, Product Literature, and Technical Notes
- Earnings Decks and Investor Briefings
- Statutory Filings and Regulatory Disclosures
- Technical White Papers and Standards Notes
- Trade Journals, Industry Magazines, and Analyst Briefs
- Conference Proceedings, Webinars, and Seminar Materials
- Government Statistics Portals and Public Data Releases
- Press Releases and Reputable Media Coverage
- Specialist Newsletters and Curated Briefings
- Sector Databases and Reference Repositories
- Fact.MR Internal Proprietary Databases and Historical Market Datasets
- Subscription Datasets and Paid Sources
- Social Channels, Communities, and Digital Listening Inputs
- Additional Desk Sources
- Expert Input and Fieldwork (Primary Evidence)
- Primary Modes
- Qualitative Interviews and Expert Elicitation
- Quantitative Surveys and Structured Data Capture
- Blended Approach
- Why Primary Evidence is Used
- Field Techniques
- Interviews
- Surveys
- Focus Groups
- Observational and In-context Research
- Social and Community Interactions
- Stakeholder Universe Engaged
- C-suite Leaders
- Board Members
- Presidents and Vice Presidents
- R&D and Innovation Heads
- Technical Specialists
- Domain Subject-matter Experts
- Scientists
- Physicians and Other Healthcare Professionals
- Governance, Ethics, and Data Stewardship
- Research Ethics
- Data Integrity and Handling
- Primary Modes
- Tooling, Models, and Reference Databases
- Desk Research Programme (Secondary Evidence)
- Data Engineering and Model Build
- Data Acquisition and Ingestion
- Cleaning, Normalisation, and Verification
- Synthesis, Triangulation, and Analysis
- Quality Assurance and Audit Trail
- Market Background
- Market Dynamics
- Drivers
- Restraints
- Opportunity
- Trends
- Scenario Forecast
- Demand in Optimistic Scenario
- Demand in Likely Scenario
- Demand in Conservative Scenario
- Opportunity Map Analysis
- Product Life Cycle Analysis
- Supply Chain Analysis
- Investment Feasibility Matrix
- Value Chain Analysis
- PESTLE and Porter’s Analysis
- Regulatory Landscape
- Regional Parent Market Outlook
- Production and Consumption Statistics
- Import and Export Statistics
- Market Dynamics
- Global Market Analysis 2021 to 2025 and Forecast, 2026 to 2036
- Historical Market Size Value (USD Million) Analysis, 2021 to 2025
- Current and Future Market Size Value (USD Million) Projections, 2026 to 2036
- Y to o to Y Growth Trend Analysis
- Absolute $ Opportunity Analysis
- Global Market Pricing Analysis 2021 to 2025 and Forecast 2026 to 2036
- Global Market Analysis 2021 to 2025 and Forecast 2026 to 2036, By Product Type
- Introduction / Key Findings
- Historical Market Size Value (USD Million) Analysis By Product Type , 2021 to 2025
- Current and Future Market Size Value (USD Million) Analysis and Forecast By Product Type , 2026 to 2036
- Instruments
- Accessories
- Reagents and Kits
- Instruments
- Y to o to Y Growth Trend Analysis By Product Type , 2021 to 2025
- Absolute $ Opportunity Analysis By Product Type , 2026 to 2036
- Global Market Analysis 2021 to 2025 and Forecast 2026 to 2036, By Management Area
- Introduction / Key Findings
- Historical Market Size Value (USD Million) Analysis By Management Area, 2021 to 2025
- Current and Future Market Size Value (USD Million) Analysis and Forecast By Management Area, 2026 to 2036
- Blood Transfusion Management
- Blood Loss Management
- Blood Storage and Inventory Management
- Blood Transfusion Management
- Y to o to Y Growth Trend Analysis By Management Area, 2021 to 2025
- Absolute $ Opportunity Analysis By Management Area, 2026 to 2036
- Global Market Analysis 2021 to 2025 and Forecast 2026 to 2036, By Application
- Introduction / Key Findings
- Historical Market Size Value (USD Million) Analysis By Application, 2021 to 2025
- Current and Future Market Size Value (USD Million) Analysis and Forecast By Application, 2026 to 2036
- Perioperative Care
- Trauma Care
- Oncology Care
- Perioperative Care
- Y to o to Y Growth Trend Analysis By Application, 2021 to 2025
- Absolute $ Opportunity Analysis By Application, 2026 to 2036
- Global Market Analysis 2021 to 2025 and Forecast 2026 to 2036, By End User
- Introduction / Key Findings
- Historical Market Size Value (USD Million) Analysis By End User, 2021 to 2025
- Current and Future Market Size Value (USD Million) Analysis and Forecast By End User, 2026 to 2036
- Hospitals
- Blood Banks
- Diagnostic Laboratories
- Hospitals
- Y to o to Y Growth Trend Analysis By End User, 2021 to 2025
- Absolute $ Opportunity Analysis By End User, 2026 to 2036
- Global Market Analysis 2021 to 2025 and Forecast 2026 to 2036, By Sales Channel
- Introduction / Key Findings
- Historical Market Size Value (USD Million) Analysis By Sales Channel, 2021 to 2025
- Current and Future Market Size Value (USD Million) Analysis and Forecast By Sales Channel, 2026 to 2036
- Direct Institutional Sales
- Medical Device Distributors
- Tender-based Sales
- Direct Institutional Sales
- Y to o to Y Growth Trend Analysis By Sales Channel, 2021 to 2025
- Absolute $ Opportunity Analysis By Sales Channel, 2026 to 2036
- Global Market Analysis 2021 to 2025 and Forecast 2026 to 2036, By Region
- Introduction
- Historical Market Size Value (USD Million) Analysis By Region, 2021 to 2025
- Current Market Size Value (USD Million) Analysis and Forecast By Region, 2026 to 2036
- North America
- Latin America
- Western Europe
- Eastern Europe
- East Asia
- South Asia and Pacific
- Middle East & Africa
- Market Attractiveness Analysis By Region
- North America Market Analysis 2021 to 2025 and Forecast 2026 to 2036, By Country
- Historical Market Size Value (USD Million) Trend Analysis By Market Taxonomy, 2021 to 2025
- Market Size Value (USD Million) Forecast By Market Taxonomy, 2026 to 2036
- By Country
- USA
- Canada
- Mexico
- By Product Type
- By Management Area
- By Application
- By End User
- By Sales Channel
- By Country
- Market Attractiveness Analysis
- By Country
- By Product Type
- By Management Area
- By Application
- By End User
- By Sales Channel
- Key Takeaways
- Latin America Market Analysis 2021 to 2025 and Forecast 2026 to 2036, By Country
- Historical Market Size Value (USD Million) Trend Analysis By Market Taxonomy, 2021 to 2025
- Market Size Value (USD Million) Forecast By Market Taxonomy, 2026 to 2036
- By Country
- Brazil
- Chile
- Rest of Latin America
- By Product Type
- By Management Area
- By Application
- By End User
- By Sales Channel
- By Country
- Market Attractiveness Analysis
- By Country
- By Product Type
- By Management Area
- By Application
- By End User
- By Sales Channel
- Key Takeaways
- Western Europe Market Analysis 2021 to 2025 and Forecast 2026 to 2036, By Country
- Historical Market Size Value (USD Million) Trend Analysis By Market Taxonomy, 2021 to 2025
- Market Size Value (USD Million) Forecast By Market Taxonomy, 2026 to 2036
- By Country
- Germany
- UK
- Italy
- Spain
- France
- Nordic
- BENELUX
- Rest of Western Europe
- By Product Type
- By Management Area
- By Application
- By End User
- By Sales Channel
- By Country
- Market Attractiveness Analysis
- By Country
- By Product Type
- By Management Area
- By Application
- By End User
- By Sales Channel
- Key Takeaways
- Eastern Europe Market Analysis 2021 to 2025 and Forecast 2026 to 2036, By Country
- Historical Market Size Value (USD Million) Trend Analysis By Market Taxonomy, 2021 to 2025
- Market Size Value (USD Million) Forecast By Market Taxonomy, 2026 to 2036
- By Country
- Russia
- Poland
- Hungary
- Balkan & Baltic
- Rest of Eastern Europe
- By Product Type
- By Management Area
- By Application
- By End User
- By Sales Channel
- By Country
- Market Attractiveness Analysis
- By Country
- By Product Type
- By Management Area
- By Application
- By End User
- By Sales Channel
- Key Takeaways
- East Asia Market Analysis 2021 to 2025 and Forecast 2026 to 2036, By Country
- Historical Market Size Value (USD Million) Trend Analysis By Market Taxonomy, 2021 to 2025
- Market Size Value (USD Million) Forecast By Market Taxonomy, 2026 to 2036
- By Country
- China
- Japan
- South Korea
- By Product Type
- By Management Area
- By Application
- By End User
- By Sales Channel
- By Country
- Market Attractiveness Analysis
- By Country
- By Product Type
- By Management Area
- By Application
- By End User
- By Sales Channel
- Key Takeaways
- South Asia and Pacific Market Analysis 2021 to 2025 and Forecast 2026 to 2036, By Country
- Historical Market Size Value (USD Million) Trend Analysis By Market Taxonomy, 2021 to 2025
- Market Size Value (USD Million) Forecast By Market Taxonomy, 2026 to 2036
- By Country
- India
- ASEAN
- Australia & New Zealand
- Rest of South Asia and Pacific
- By Product Type
- By Management Area
- By Application
- By End User
- By Sales Channel
- By Country
- Market Attractiveness Analysis
- By Country
- By Product Type
- By Management Area
- By Application
- By End User
- By Sales Channel
- Key Takeaways
- Middle East & Africa Market Analysis 2021 to 2025 and Forecast 2026 to 2036, By Country
- Historical Market Size Value (USD Million) Trend Analysis By Market Taxonomy, 2021 to 2025
- Market Size Value (USD Million) Forecast By Market Taxonomy, 2026 to 2036
- By Country
- Kingdom of Saudi Arabia
- Other GCC Countries
- Turkiye
- South Africa
- Other African Union
- Rest of Middle East & Africa
- By Product Type
- By Management Area
- By Application
- By End User
- By Sales Channel
- By Country
- Market Attractiveness Analysis
- By Country
- By Product Type
- By Management Area
- By Application
- By End User
- By Sales Channel
- Key Takeaways
- Key Countries Market Analysis
- USA
- Pricing Analysis
- Market Share Analysis, 2025
- By Product Type
- By Management Area
- By Application
- By End User
- By Sales Channel
- Canada
- Pricing Analysis
- Market Share Analysis, 2025
- By Product Type
- By Management Area
- By Application
- By End User
- By Sales Channel
- Mexico
- Pricing Analysis
- Market Share Analysis, 2025
- By Product Type
- By Management Area
- By Application
- By End User
- By Sales Channel
- Brazil
- Pricing Analysis
- Market Share Analysis, 2025
- By Product Type
- By Management Area
- By Application
- By End User
- By Sales Channel
- Chile
- Pricing Analysis
- Market Share Analysis, 2025
- By Product Type
- By Management Area
- By Application
- By End User
- By Sales Channel
- Germany
- Pricing Analysis
- Market Share Analysis, 2025
- By Product Type
- By Management Area
- By Application
- By End User
- By Sales Channel
- UK
- Pricing Analysis
- Market Share Analysis, 2025
- By Product Type
- By Management Area
- By Application
- By End User
- By Sales Channel
- Italy
- Pricing Analysis
- Market Share Analysis, 2025
- By Product Type
- By Management Area
- By Application
- By End User
- By Sales Channel
- Spain
- Pricing Analysis
- Market Share Analysis, 2025
- By Product Type
- By Management Area
- By Application
- By End User
- By Sales Channel
- France
- Pricing Analysis
- Market Share Analysis, 2025
- By Product Type
- By Management Area
- By Application
- By End User
- By Sales Channel
- India
- Pricing Analysis
- Market Share Analysis, 2025
- By Product Type
- By Management Area
- By Application
- By End User
- By Sales Channel
- ASEAN
- Pricing Analysis
- Market Share Analysis, 2025
- By Product Type
- By Management Area
- By Application
- By End User
- By Sales Channel
- Australia & New Zealand
- Pricing Analysis
- Market Share Analysis, 2025
- By Product Type
- By Management Area
- By Application
- By End User
- By Sales Channel
- China
- Pricing Analysis
- Market Share Analysis, 2025
- By Product Type
- By Management Area
- By Application
- By End User
- By Sales Channel
- Japan
- Pricing Analysis
- Market Share Analysis, 2025
- By Product Type
- By Management Area
- By Application
- By End User
- By Sales Channel
- South Korea
- Pricing Analysis
- Market Share Analysis, 2025
- By Product Type
- By Management Area
- By Application
- By End User
- By Sales Channel
- Russia
- Pricing Analysis
- Market Share Analysis, 2025
- By Product Type
- By Management Area
- By Application
- By End User
- By Sales Channel
- Poland
- Pricing Analysis
- Market Share Analysis, 2025
- By Product Type
- By Management Area
- By Application
- By End User
- By Sales Channel
- Hungary
- Pricing Analysis
- Market Share Analysis, 2025
- By Product Type
- By Management Area
- By Application
- By End User
- By Sales Channel
- Kingdom of Saudi Arabia
- Pricing Analysis
- Market Share Analysis, 2025
- By Product Type
- By Management Area
- By Application
- By End User
- By Sales Channel
- Turkiye
- Pricing Analysis
- Market Share Analysis, 2025
- By Product Type
- By Management Area
- By Application
- By End User
- By Sales Channel
- South Africa
- Pricing Analysis
- Market Share Analysis, 2025
- By Product Type
- By Management Area
- By Application
- By End User
- By Sales Channel
- USA
- Market Structure Analysis
- Competition Dashboard
- Competition Benchmarking
- Market Share Analysis of Top Players
- By Regional
- By Product Type
- By Management Area
- By Application
- By End User
- By Sales Channel
- Competition Analysis
- Competition Deep Dive
- Haemonetics Corporation
- Overview
- Product Portfolio
- Profitability by Market Segments (Product/Age /Sales Channel/Region)
- Sales Footprint
- Strategy Overview
- Marketing Strategy
- Product Strategy
- Channel Strategy
- Terumo Blood and Cell Technologies
- Fresenius Kabi
- Grifols S.A.
- Immucor, Inc.
- Macopharma
- Werfen
- Haemonetics Corporation
- Competition Deep Dive
- Assumptions & Acronyms Used
List Of Table
- Table 1: Global Market Value (USD Million) Forecast by Region, 2021 to 2036
- Table 2: Global Market Value (USD Million) Forecast by Product Type, 2021 to 2036
- Table 3: Global Market Value (USD Million) Forecast by Management Area, 2021 to 2036
- Table 4: Global Market Value (USD Million) Forecast by Application, 2021 to 2036
- Table 5: Global Market Value (USD Million) Forecast by End User, 2021 to 2036
- Table 6: Global Market Value (USD Million) Forecast by Sales Channel, 2021 to 2036
- Table 7: North America Market Value (USD Million) Forecast by Country, 2021 to 2036
- Table 8: North America Market Value (USD Million) Forecast by Product Type, 2021 to 2036
- Table 9: North America Market Value (USD Million) Forecast by Management Area, 2021 to 2036
- Table 10: North America Market Value (USD Million) Forecast by Application, 2021 to 2036
- Table 11: North America Market Value (USD Million) Forecast by End User, 2021 to 2036
- Table 12: North America Market Value (USD Million) Forecast by Sales Channel, 2021 to 2036
- Table 13: Latin America Market Value (USD Million) Forecast by Country, 2021 to 2036
- Table 14: Latin America Market Value (USD Million) Forecast by Product Type, 2021 to 2036
- Table 15: Latin America Market Value (USD Million) Forecast by Management Area, 2021 to 2036
- Table 16: Latin America Market Value (USD Million) Forecast by Application, 2021 to 2036
- Table 17: Latin America Market Value (USD Million) Forecast by End User, 2021 to 2036
- Table 18: Latin America Market Value (USD Million) Forecast by Sales Channel, 2021 to 2036
- Table 19: Western Europe Market Value (USD Million) Forecast by Country, 2021 to 2036
- Table 20: Western Europe Market Value (USD Million) Forecast by Product Type, 2021 to 2036
- Table 21: Western Europe Market Value (USD Million) Forecast by Management Area, 2021 to 2036
- Table 22: Western Europe Market Value (USD Million) Forecast by Application, 2021 to 2036
- Table 23: Western Europe Market Value (USD Million) Forecast by End User, 2021 to 2036
- Table 24: Western Europe Market Value (USD Million) Forecast by Sales Channel, 2021 to 2036
- Table 25: Eastern Europe Market Value (USD Million) Forecast by Country, 2021 to 2036
- Table 26: Eastern Europe Market Value (USD Million) Forecast by Product Type, 2021 to 2036
- Table 27: Eastern Europe Market Value (USD Million) Forecast by Management Area, 2021 to 2036
- Table 28: Eastern Europe Market Value (USD Million) Forecast by Application, 2021 to 2036
- Table 29: Eastern Europe Market Value (USD Million) Forecast by End User, 2021 to 2036
- Table 30: Eastern Europe Market Value (USD Million) Forecast by Sales Channel, 2021 to 2036
- Table 31: East Asia Market Value (USD Million) Forecast by Country, 2021 to 2036
- Table 32: East Asia Market Value (USD Million) Forecast by Product Type, 2021 to 2036
- Table 33: East Asia Market Value (USD Million) Forecast by Management Area, 2021 to 2036
- Table 34: East Asia Market Value (USD Million) Forecast by Application, 2021 to 2036
- Table 35: East Asia Market Value (USD Million) Forecast by End User, 2021 to 2036
- Table 36: East Asia Market Value (USD Million) Forecast by Sales Channel, 2021 to 2036
- Table 37: South Asia and Pacific Market Value (USD Million) Forecast by Country, 2021 to 2036
- Table 38: South Asia and Pacific Market Value (USD Million) Forecast by Product Type, 2021 to 2036
- Table 39: South Asia and Pacific Market Value (USD Million) Forecast by Management Area, 2021 to 2036
- Table 40: South Asia and Pacific Market Value (USD Million) Forecast by Application, 2021 to 2036
- Table 41: South Asia and Pacific Market Value (USD Million) Forecast by End User, 2021 to 2036
- Table 42: South Asia and Pacific Market Value (USD Million) Forecast by Sales Channel, 2021 to 2036
- Table 43: Middle East & Africa Market Value (USD Million) Forecast by Country, 2021 to 2036
- Table 44: Middle East & Africa Market Value (USD Million) Forecast by Product Type, 2021 to 2036
- Table 45: Middle East & Africa Market Value (USD Million) Forecast by Management Area, 2021 to 2036
- Table 46: Middle East & Africa Market Value (USD Million) Forecast by Application, 2021 to 2036
- Table 47: Middle East & Africa Market Value (USD Million) Forecast by End User, 2021 to 2036
- Table 48: Middle East & Africa Market Value (USD Million) Forecast by Sales Channel, 2021 to 2036
List Of Figures
- Figure 1: Global Market Pricing Analysis
- Figure 2: Global Market Value (USD Million) Forecast 2021-2036
- Figure 3: Global Market Value Share and BPS Analysis by Product Type,2026 and 2036
- Figure 4: Global Market Y-o-Y Growth Comparison by Product Type,2026 to 2036
- Figure 5: Global Market Attractiveness Analysis by Product Type
- Figure 6: Global Market Value Share and BPS Analysis by Management Area, 2026 and 2036
- Figure 7: Global Market Y-o-Y Growth Comparison by Management Area, 2026 to 2036
- Figure 8: Global Market Attractiveness Analysis by Management Area
- Figure 9: Global Market Value Share and BPS Analysis by Application, 2026 and 2036
- Figure 10: Global Market Y-o-Y Growth Comparison by Application, 2026 to 2036
- Figure 11: Global Market Attractiveness Analysis by Application
- Figure 12: Global Market Value Share and BPS Analysis by End User, 2026 and 2036
- Figure 13: Global Market Y-o-Y Growth Comparison by End User, 2026 to 2036
- Figure 14: Global Market Attractiveness Analysis by End User
- Figure 15: Global Market Value Share and BPS Analysis by Sales Channel, 2026 and 2036
- Figure 16: Global Market Y-o-Y Growth Comparison by Sales Channel, 2026 to 2036
- Figure 17: Global Market Attractiveness Analysis by Sales Channel
- Figure 18: Global Market Value (USD Million) Share and BPS Analysis by Region, 2026 and 2036
- Figure 19: Global Market Y-o-Y Growth Comparison by Region, 2026 to 2036
- Figure 20: Global Market Attractiveness Analysis by Region
- Figure 21: North America Market Incremental Dollar Opportunity, 2026 to 2036
- Figure 22: Latin America Market Incremental Dollar Opportunity, 2026 to 2036
- Figure 23: Western Europe Market Incremental Dollar Opportunity, 2026 to 2036
- Figure 24: Eastern Europe Market Incremental Dollar Opportunity, 2026 to 2036
- Figure 25: East Asia Market Incremental Dollar Opportunity, 2026 to 2036
- Figure 26: South Asia and Pacific Market Incremental Dollar Opportunity, 2026 to 2036
- Figure 27: Middle East & Africa Market Incremental Dollar Opportunity, 2026 to 2036
- Figure 28: North America Market Value Share and BPS Analysis by Country, 2026 and 2036
- Figure 29: North America Market Value Share and BPS Analysis by Product Type,2026 and 2036
- Figure 30: North America Market Y-o-Y Growth Comparison by Product Type,2026 to 2036
- Figure 31: North America Market Attractiveness Analysis by Product Type
- Figure 32: North America Market Value Share and BPS Analysis by Management Area, 2026 and 2036
- Figure 33: North America Market Y-o-Y Growth Comparison by Management Area, 2026 to 2036
- Figure 34: North America Market Attractiveness Analysis by Management Area
- Figure 35: North America Market Value Share and BPS Analysis by Application, 2026 and 2036
- Figure 36: North America Market Y-o-Y Growth Comparison by Application, 2026 to 2036
- Figure 37: North America Market Attractiveness Analysis by Application
- Figure 38: North America Market Value Share and BPS Analysis by End User, 2026 and 2036
- Figure 39: North America Market Y-o-Y Growth Comparison by End User, 2026 to 2036
- Figure 40: North America Market Attractiveness Analysis by End User
- Figure 41: North America Market Value Share and BPS Analysis by Sales Channel, 2026 and 2036
- Figure 42: North America Market Y-o-Y Growth Comparison by Sales Channel, 2026 to 2036
- Figure 43: North America Market Attractiveness Analysis by Sales Channel
- Figure 44: Latin America Market Value Share and BPS Analysis by Country, 2026 and 2036
- Figure 45: Latin America Market Value Share and BPS Analysis by Product Type,2026 and 2036
- Figure 46: Latin America Market Y-o-Y Growth Comparison by Product Type,2026 to 2036
- Figure 47: Latin America Market Attractiveness Analysis by Product Type
- Figure 48: Latin America Market Value Share and BPS Analysis by Management Area, 2026 and 2036
- Figure 49: Latin America Market Y-o-Y Growth Comparison by Management Area, 2026 to 2036
- Figure 50: Latin America Market Attractiveness Analysis by Management Area
- Figure 51: Latin America Market Value Share and BPS Analysis by Application, 2026 and 2036
- Figure 52: Latin America Market Y-o-Y Growth Comparison by Application, 2026 to 2036
- Figure 53: Latin America Market Attractiveness Analysis by Application
- Figure 54: Latin America Market Value Share and BPS Analysis by End User, 2026 and 2036
- Figure 55: Latin America Market Y-o-Y Growth Comparison by End User, 2026 to 2036
- Figure 56: Latin America Market Attractiveness Analysis by End User
- Figure 57: Latin America Market Value Share and BPS Analysis by Sales Channel, 2026 and 2036
- Figure 58: Latin America Market Y-o-Y Growth Comparison by Sales Channel, 2026 to 2036
- Figure 59: Latin America Market Attractiveness Analysis by Sales Channel
- Figure 60: Western Europe Market Value Share and BPS Analysis by Country, 2026 and 2036
- Figure 61: Western Europe Market Value Share and BPS Analysis by Product Type,2026 and 2036
- Figure 62: Western Europe Market Y-o-Y Growth Comparison by Product Type,2026 to 2036
- Figure 63: Western Europe Market Attractiveness Analysis by Product Type
- Figure 64: Western Europe Market Value Share and BPS Analysis by Management Area, 2026 and 2036
- Figure 65: Western Europe Market Y-o-Y Growth Comparison by Management Area, 2026 to 2036
- Figure 66: Western Europe Market Attractiveness Analysis by Management Area
- Figure 67: Western Europe Market Value Share and BPS Analysis by Application, 2026 and 2036
- Figure 68: Western Europe Market Y-o-Y Growth Comparison by Application, 2026 to 2036
- Figure 69: Western Europe Market Attractiveness Analysis by Application
- Figure 70: Western Europe Market Value Share and BPS Analysis by End User, 2026 and 2036
- Figure 71: Western Europe Market Y-o-Y Growth Comparison by End User, 2026 to 2036
- Figure 72: Western Europe Market Attractiveness Analysis by End User
- Figure 73: Western Europe Market Value Share and BPS Analysis by Sales Channel, 2026 and 2036
- Figure 74: Western Europe Market Y-o-Y Growth Comparison by Sales Channel, 2026 to 2036
- Figure 75: Western Europe Market Attractiveness Analysis by Sales Channel
- Figure 76: Eastern Europe Market Value Share and BPS Analysis by Country, 2026 and 2036
- Figure 77: Eastern Europe Market Value Share and BPS Analysis by Product Type,2026 and 2036
- Figure 78: Eastern Europe Market Y-o-Y Growth Comparison by Product Type,2026 to 2036
- Figure 79: Eastern Europe Market Attractiveness Analysis by Product Type
- Figure 80: Eastern Europe Market Value Share and BPS Analysis by Management Area, 2026 and 2036
- Figure 81: Eastern Europe Market Y-o-Y Growth Comparison by Management Area, 2026 to 2036
- Figure 82: Eastern Europe Market Attractiveness Analysis by Management Area
- Figure 83: Eastern Europe Market Value Share and BPS Analysis by Application, 2026 and 2036
- Figure 84: Eastern Europe Market Y-o-Y Growth Comparison by Application, 2026 to 2036
- Figure 85: Eastern Europe Market Attractiveness Analysis by Application
- Figure 86: Eastern Europe Market Value Share and BPS Analysis by End User, 2026 and 2036
- Figure 87: Eastern Europe Market Y-o-Y Growth Comparison by End User, 2026 to 2036
- Figure 88: Eastern Europe Market Attractiveness Analysis by End User
- Figure 89: Eastern Europe Market Value Share and BPS Analysis by Sales Channel, 2026 and 2036
- Figure 90: Eastern Europe Market Y-o-Y Growth Comparison by Sales Channel, 2026 to 2036
- Figure 91: Eastern Europe Market Attractiveness Analysis by Sales Channel
- Figure 92: East Asia Market Value Share and BPS Analysis by Country, 2026 and 2036
- Figure 93: East Asia Market Value Share and BPS Analysis by Product Type,2026 and 2036
- Figure 94: East Asia Market Y-o-Y Growth Comparison by Product Type,2026 to 2036
- Figure 95: East Asia Market Attractiveness Analysis by Product Type
- Figure 96: East Asia Market Value Share and BPS Analysis by Management Area, 2026 and 2036
- Figure 97: East Asia Market Y-o-Y Growth Comparison by Management Area, 2026 to 2036
- Figure 98: East Asia Market Attractiveness Analysis by Management Area
- Figure 99: East Asia Market Value Share and BPS Analysis by Application, 2026 and 2036
- Figure 100: East Asia Market Y-o-Y Growth Comparison by Application, 2026 to 2036
- Figure 101: East Asia Market Attractiveness Analysis by Application
- Figure 102: East Asia Market Value Share and BPS Analysis by End User, 2026 and 2036
- Figure 103: East Asia Market Y-o-Y Growth Comparison by End User, 2026 to 2036
- Figure 104: East Asia Market Attractiveness Analysis by End User
- Figure 105: East Asia Market Value Share and BPS Analysis by Sales Channel, 2026 and 2036
- Figure 106: East Asia Market Y-o-Y Growth Comparison by Sales Channel, 2026 to 2036
- Figure 107: East Asia Market Attractiveness Analysis by Sales Channel
- Figure 108: South Asia and Pacific Market Value Share and BPS Analysis by Country, 2026 and 2036
- Figure 109: South Asia and Pacific Market Value Share and BPS Analysis by Product Type,2026 and 2036
- Figure 110: South Asia and Pacific Market Y-o-Y Growth Comparison by Product Type,2026 to 2036
- Figure 111: South Asia and Pacific Market Attractiveness Analysis by Product Type
- Figure 112: South Asia and Pacific Market Value Share and BPS Analysis by Management Area, 2026 and 2036
- Figure 113: South Asia and Pacific Market Y-o-Y Growth Comparison by Management Area, 2026 to 2036
- Figure 114: South Asia and Pacific Market Attractiveness Analysis by Management Area
- Figure 115: South Asia and Pacific Market Value Share and BPS Analysis by Application, 2026 and 2036
- Figure 116: South Asia and Pacific Market Y-o-Y Growth Comparison by Application, 2026 to 2036
- Figure 117: South Asia and Pacific Market Attractiveness Analysis by Application
- Figure 118: South Asia and Pacific Market Value Share and BPS Analysis by End User, 2026 and 2036
- Figure 119: South Asia and Pacific Market Y-o-Y Growth Comparison by End User, 2026 to 2036
- Figure 120: South Asia and Pacific Market Attractiveness Analysis by End User
- Figure 121: South Asia and Pacific Market Value Share and BPS Analysis by Sales Channel, 2026 and 2036
- Figure 122: South Asia and Pacific Market Y-o-Y Growth Comparison by Sales Channel, 2026 to 2036
- Figure 123: South Asia and Pacific Market Attractiveness Analysis by Sales Channel
- Figure 124: Middle East & Africa Market Value Share and BPS Analysis by Country, 2026 and 2036
- Figure 125: Middle East & Africa Market Value Share and BPS Analysis by Product Type,2026 and 2036
- Figure 126: Middle East & Africa Market Y-o-Y Growth Comparison by Product Type,2026 to 2036
- Figure 127: Middle East & Africa Market Attractiveness Analysis by Product Type
- Figure 128: Middle East & Africa Market Value Share and BPS Analysis by Management Area, 2026 and 2036
- Figure 129: Middle East & Africa Market Y-o-Y Growth Comparison by Management Area, 2026 to 2036
- Figure 130: Middle East & Africa Market Attractiveness Analysis by Management Area
- Figure 131: Middle East & Africa Market Value Share and BPS Analysis by Application, 2026 and 2036
- Figure 132: Middle East & Africa Market Y-o-Y Growth Comparison by Application, 2026 to 2036
- Figure 133: Middle East & Africa Market Attractiveness Analysis by Application
- Figure 134: Middle East & Africa Market Value Share and BPS Analysis by End User, 2026 and 2036
- Figure 135: Middle East & Africa Market Y-o-Y Growth Comparison by End User, 2026 to 2036
- Figure 136: Middle East & Africa Market Attractiveness Analysis by End User
- Figure 137: Middle East & Africa Market Value Share and BPS Analysis by Sales Channel, 2026 and 2036
- Figure 138: Middle East & Africa Market Y-o-Y Growth Comparison by Sales Channel, 2026 to 2036
- Figure 139: Middle East & Africa Market Attractiveness Analysis by Sales Channel
- Figure 140: Global Market - Tier Structure Analysis
- Figure 141: Global Market - Company Share Analysis