- Market Value (2025): USD 286.3 Mn
- Estimated Value (2026): USD 302.0 Mn
- Forecast Value (2036): USD 515.0 Mn
- CAGR (2026-2036): 5.5%
What is the Phosphate Processing Aids Market forecast to be worth by 2036?
USD 302.0 million in 2026 to USD 515.0 million by 2036, at 5.5% CAGR.
- The market was approximately USD 286.3 million in 2025, supported by recurring reagent consumption across mining, beneficiation, acid production, granulation, and material handling.
- Revenue is forecast to increase from USD 302.0 million in 2026 to USD 515.0 million by 2036 as producers process more variable ore and expand phosphate and fertilizer capacity.
- The projected 5.5% CAGR from 2026 to 2036 reflects continuing flotation optimization, scale and foam control, and demand for better handling of finished and intermediate phosphate products.
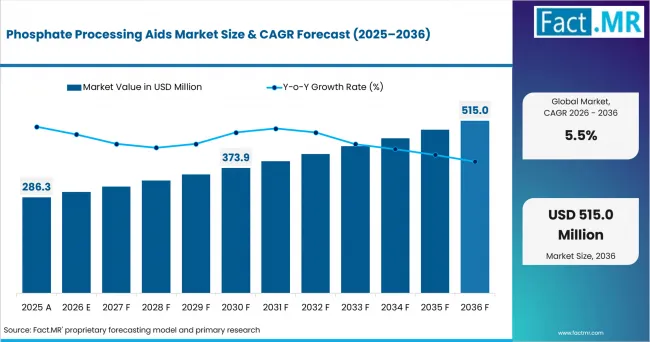
Phosphate Processing Aids Market Value Analysis | Source: Fact.MR
What are the defining numbers behind Phosphate Processing Aids Market growth?
USD 213.0 million absolute opportunity by 2036, led by Flotation aids and Beneficiation within their respective segments.
- Demand Drivers in the Market
- Declining or more variable ore quality makes flotation selectivity and recovery more valuable at the beneficiation stage.
- Fertilizer plants use anti-caking and dust-control aids to preserve product flow and reduce losses during cooling, storage, and transport.
- Wet-acid operations require defoamers and scale-control chemistries that can tolerate changing impurity loads.
- Large producers increasingly expect reagent vendors to combine laboratory testing, plant trials, dosing support, and ongoing optimization.
- Key Segments Analyzed
- By Aid Function: The 2026 Aid Function segment is led by Flotation aids. Small changes in separation performance can affect concentrate grade, recovery, and downstream plant loading.
- By Process Stage: Beneficiation secures the top 2026 Process Stage position because it is the first major opportunity to improve ore quality before acid or fertilizer conversion.
- By Chemical Base: Growth in 2026 pulls Chemical Base demand toward Fatty amine/fatty acid, the largest chemistry in the category. These chemistries are established building blocks for selective mineral flotation.
- By Customer Type: The top 2026 Customer Type position is held by Phosphate miners because they control beneficiation performance and bear the immediate cost of recovery losses.
- By Mineral Route: Sedimentary phosphate forms the largest processing base and often requires selective removal of carbonate and silica gangue. That advantage translates into the largest 2026 Mineral Route position for Sedimentary phosphate.
- Analyst Opinion at Fact.MR
- Fact.MR analyst view: "A reagent earns its place only when the plant can see the improvement in concentrate quality, recovery, throughput, or downstream reliability. The strongest suppliers speak in plant economics and mineralogy, then prove the chemistry through controlled trials rather than offering a standard dose for every deposit."
- Strategic Implications
- Phosphate miners should segment ore domains before setting a single flotation-aid program across the mine plan.
- Reagent suppliers can defend margin by tying technical service to measurable recovery, grade, moisture, dust, or availability outcomes.
- Fertilizer producers need to coordinate granulation, anti-caking, and dust control because a change that helps one stage can create a handling issue later.
- EPC contractors and process licensors should leave enough dosing flexibility for ore changes and commissioning conditions rather than fixing one chemistry too early.
The U.S. Geological Survey's 2026 phosphate-rock review identifies ongoing production-capacity expansions in Morocco and several other producing countries. As those projects progress, reagent suppliers gain additional opportunities to qualify flotation, scale-control, and handling packages during plant design and ramp-up.
How does the Phosphate Processing Aids Market break down by segment?
The leading segments are Flotation aids by Aid Function and Beneficiation by Process Stage.
Why do flotation aids account for the largest functional share?
In 2026, the leading position goes to Flotation aids because small changes in separation performance can affect concentrate grade, recovery, and downstream plant loading.
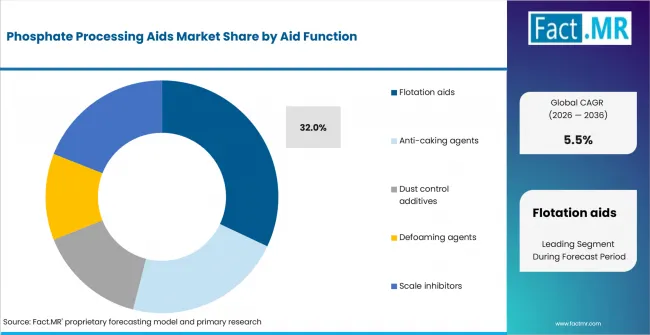
Phosphate Processing Aids Market Analysis By Aid Function | Source: Fact.MR
Flotation aids lead demand because beneficiation economics are closely tied to selective separation of phosphate from gangue. Anti-caking agents follow and protect the flow of finished or intermediate material after granulation and cooling. Scale inhibitors round out the mix, reflecting the cost of deposits in wet processing, water circuits, and heat-transfer surfaces.
Why is beneficiation the leading process stage for aid consumption?
The 2026 leader is Beneficiation because it is the first major opportunity to improve ore quality before acid or fertilizer conversion.
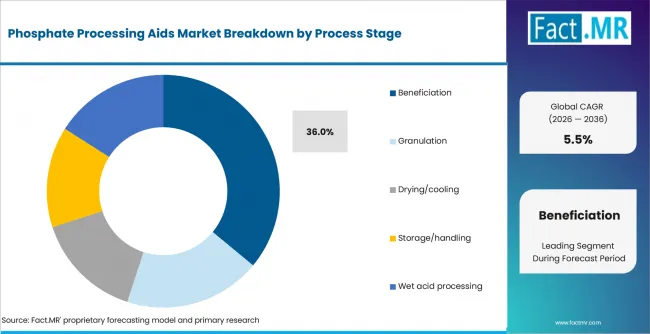
Phosphate Processing Aids Market Analysis By Process Stage | Source: Fact.MR
Beneficiation leads market demand as flotation, washing, and conditioning determine the concentrate sent downstream. Granulation follows, where additives influence particle formation and finished-product handling. Wet acid processing also contributes, with defoaming and scale control becoming more important as impurity profiles and operating rates change.
What keeps fatty amine and fatty acid chemistry in the leading position?
Fatty amine/fatty acid ranks first in 2026 because these chemistries are established building blocks for selective mineral flotation.
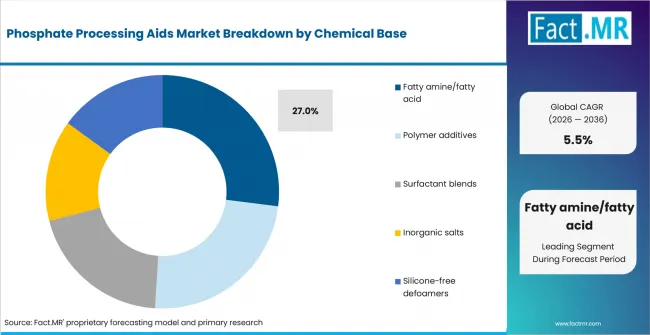
Phosphate Processing Aids Market Analysis By Chemical Base | Source: Fact.MR
Fatty amine and fatty acid products lead the category because they can be formulated as collectors for different phosphate and gangue systems. Polymer additives follow and span dispersing, scale-control, flocculation, and handling functions. Surfactant blends round out the mix, allowing suppliers to tune wetting, froth, and interfacial behavior beyond a single active ingredient.
Why do phosphate miners purchase the largest share of processing aids?
For Customer Type, the top 2026 position is Phosphate miners because they control beneficiation performance and bear the immediate cost of recovery losses.
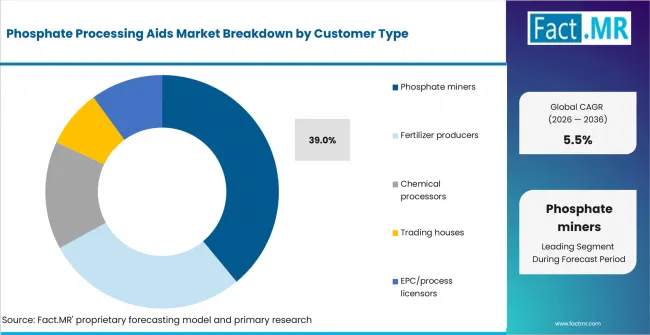
Phosphate Processing Aids Market Analysis By Customer Type | Source: Fact.MR
Phosphate miners lead demand, driven by recurring flotation and ore-conditioning requirements. Fertilizer producers follow and purchase across granulation, anti-caking, dust, foam, and scale applications. Chemical processors also contribute, while EPC firms and process licensors can influence formulation and dosing choices during new projects.
Why does sedimentary phosphate dominate the mineral route?
The leading 2026 position belongs to Sedimentary phosphate because it forms the largest processing base and often requires selective removal of carbonate and silica gangue.
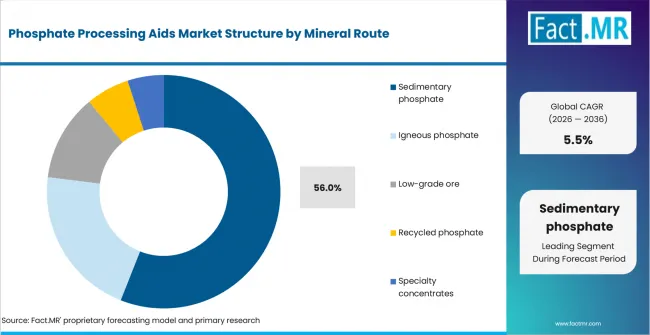
Phosphate Processing Aids Market Analysis By Mineral Route | Source: Fact.MR
Sedimentary phosphate leads demand, giving reagent vendors a broad base of mines and beneficiation circuits. Igneous phosphate follows and can require different collector and depressant strategies because mineral associations differ. Low-grade ore rounds out the mix, a strategically important segment where additional reagent cost is justified only if recovery and concentrate quality improve together.
What is accelerating Phosphate Processing Aids Market adoption, and what is holding it back?
The principal accelerator is the need to extract more consistent concentrate from variable or lower-grade feed. Adoption is restrained when plant teams cannot isolate the reagent's benefit from ore changes, equipment condition, water chemistry, and normal process variation.
Drivers Impact Analysis
| DRIVER | (~) % IMPACT ON CAGR | GEOGRAPHIC RELEVANCE | IMPACT TIMELINE |
|---|---|---|---|
| Ore-quality variability | +0.8% | United States, Morocco, and Europe | Short term (<= 2 years) |
| Phosphate capacity expansion | +0.7% | Morocco and Saudi Arabia | Medium term (2-4 years) |
| Fertilizer handling quality | +0.6% | Global export markets | Short term (<= 2 years) |
| Wet-process reliability | +0.5% | Integrated phosphate complexes | Medium term (2-4 years) |
| Water-circuit optimization | +0.4% | Water-stressed mining regions | Long term (>= 4 years) |
- Ore-quality variability: Changing gangue and feed grade make a fixed reagent program less reliable. Suppliers with mineralogical testing and rapid reformulation can protect recovery through mine-plan transitions.
- Phosphate capacity expansion: New mining and conversion assets create opportunities to qualify reagent packages before stable operating routines are established. Early plant trials can lead to long-duration supply if dosing and logistics prove reliable.
- Fertilizer handling quality: Granular fertilizers must survive cooling, storage, ship loading, and humid distribution conditions. Anti-caking and dust-control aids help protect flow and product presentation through that chain.
Opportunity Impact Analysis
| OPPORTUNITY | (~) % IMPACT ON CAGR | GEOGRAPHIC RELEVANCE | IMPACT TIMELINE |
|---|---|---|---|
| Ore-domain reagent programs | +0.4% | Global phosphate mines | Medium term (2-4 years) |
| Low-grade ore beneficiation | +0.4% | United States, Morocco, and Saudi Arabia | Long term (>= 4 years) |
| Integrated handling packages | +0.3% | Morocco and Saudi Arabia | Short term (<= 2 years) |
| Performance-linked service | +0.3% | Large integrated producers | Medium term (2-4 years) |
- Ore-domain reagent programs: Mine plans can link distinct ore domains to adjusted collectors, depressants, and conditioning. Automated dosage changes create value only when sampling and mineralogical classification are timely enough.
- Low-grade ore beneficiation: More selective flotation packages can bring marginal material into the economic feed envelope. The opportunity depends on net recovery value after reagent, water, tailings, and downstream processing costs.
- Integrated handling packages: Combining granulation support, anti-caking, and dust control gives suppliers a larger role in export-product quality. Plant testing must confirm that the package remains compatible through storage and application.
Restraints Impact Analysis
| RESTRAINT | (~) % IMPACT ON CAGR | GEOGRAPHIC RELEVANCE | IMPACT TIMELINE |
|---|---|---|---|
| Ore-specific response | -0.4% | Global | Short term (<= 2 years) |
| Trial attribution difficulty | -0.3% | Operating beneficiation plants | Short term (<= 2 years) |
| Raw-material volatility | -0.2% | Global chemical supply chains | Medium term (2-4 years) |
| Residual and water concerns | -0.2% | Water-stressed regions | Long term (>= 4 years) |
- Ore-specific response: A chemistry that performs well on one deposit may be ineffective on another with different gangue and surface properties. Each new mine or ore domain can require fresh laboratory and plant testing.
- Trial attribution difficulty: Feed grade, particle size, water chemistry, and equipment condition can change during a reagent trial. Weak experimental design makes it hard to defend a higher-cost formulation.
- Raw-material volatility: Fatty chemicals, polymers, surfactants, and specialty inputs can face cost and availability swings. Producers resist reformulation when it requires a new qualification on a critical circuit.
Which countries define phosphate processing aid demand?
Morocco 5.9% CAGR. United States 6.5% CAGR. China 6.0% CAGR. Saudi Arabia 5.7% CAGR. India 5.4% CAGR. Brazil 5.0% CAGR. Russia 4.7% CAGR.
Regional analysis covers country chapters on Morocco, United States, China, Saudi Arabia, India, Brazil, and Russia. Analysis on more than 30 countries is included in the full report.
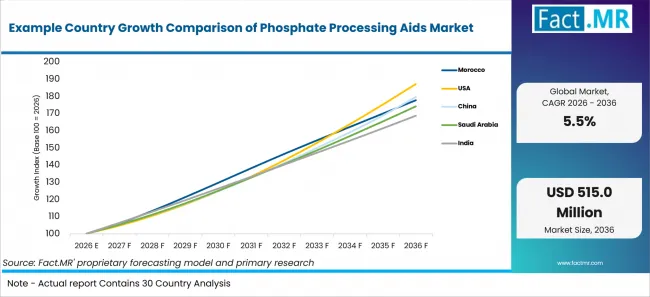
Example Country Growth Comparison Of Phosphate Processing Aids Market | Source: Fact.MR
| COUNTRY | CAGR |
|---|---|
| Morocco | 5.9% |
| United States | 6.5% |
| Saudi Arabia | 5.7% |
| Brazil | 5.0% |
| Russia | 4.7% |
How is the Morocco market likely to develop?
A 5.9% CAGR is projected for Morocco during 2026-2036.
Morocco's outlook is shaped by country-specific operating conditions. USGS mineral reporting places phosphate resources at the center of the country profile, while World Bank data provides public industrial context. Processing choices therefore turn on ore handling, beneficiation discipline, and reagent control rather than a generic chemical purchase. For phosphate processing aids, the practical test is reagent selectivity, dosage control, and recovery performance across changing ore and slurry conditions. That makes country-specific operating evidence more useful than a broad demand statement: suppliers need to match the offer to local qualification, channel, and service requirements.
How is the United States market likely to develop?
A 6.5% CAGR is projected for United States during 2026-2036.
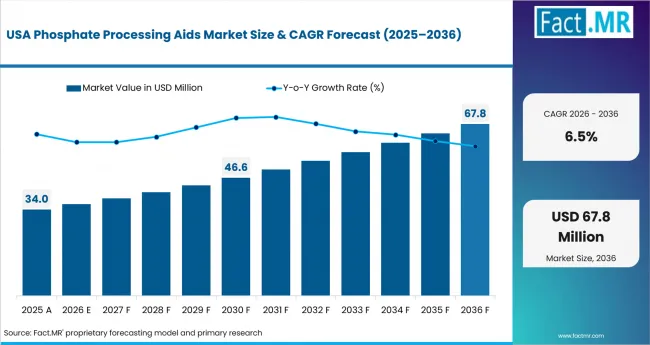
Phosphate Processing Aids Market Country Value Analysis | Source: Fact.MR
United States' market direction depends on local operating conditions. EPA chemical-management requirements sit alongside a broad and formally measured manufacturing base. Buyers therefore ask for documented application fit, repeatable specifications, and a defensible compliance file before changing a material or display program. For phosphate processing aids, the practical test is reagent selectivity, dosage control, and recovery performance across changing ore and slurry conditions.
How is the Saudi Arabia market likely to develop?
A 5.7% CAGR is projected for Saudi Arabia during 2026-2036.
Saudi Arabia’s outlook reflects country-specific operating conditions. Mineral-sector development policy and official industry statistics point to integrated capacity planning. Buyers place value on operating efficiency, reliable reagent or equipment support, and specifications that fit long-cycle fertilizer and mineral-processing assets. For phosphate processing aids, the practical test is reagent selectivity, dosage control, and recovery performance across changing ore and slurry conditions.
How is the Brazil market likely to develop?
A 5.0% CAGR is projected for Brazil during 2026-2036.
Brazil's outlook is shaped by country-specific operating conditions. mineral-resource governance and industrial statistics frame a market where regional supply conditions matter. Procurement teams focus on distributor coverage, import exposure, plant-level performance, and documentation that can travel across varied industrial locations. For phosphate processing aids, the practical test is reagent selectivity, dosage control, and recovery performance across changing ore and slurry conditions. That makes country-specific operating evidence more useful than a broad demand statement: suppliers need to match the offer to local qualification, channel, and service requirements.
How is the Russia market likely to develop?
A 4.7% CAGR is projected for Russia during 2026-2036.
Russia's market performance is guided by country-specific conditions. USGS mineral reporting and public country data underline the importance of large processing assets and supply continuity. Procurement decisions emphasize reagent reliability, maintenance planning, and performance under site-specific feed conditions and logistics constraints. For phosphate processing aids, the practical test is reagent selectivity, dosage control, and recovery performance across changing ore and slurry conditions.
Who leads the Phosphate Processing Aids Market?
Solenis, Arkema, Clariant, BASF, and Nouryon compete through mineral-processing chemistry, formulation depth, plant trials, and global supply support.
Solenis leads the company group, followed by Arkema and Clariant. Their advantage comes from combining reagent portfolios with mineral-processing expertise and field teams capable of tuning chemistry at an operating plant.
BASF and Nouryon are also active in the company group. Smaller specialists can win specific mines through fast ore testing and focused flotation knowledge, while larger suppliers are better placed to serve integrated beneficiation, acid, and fertilizer sites across several countries.
Which companies are the key providers?
The company set includes Solenis, Arkema, Clariant, BASF, and Nouryon.
- Solenis
- Arkema
- Clariant
- BASF
- Nouryon
These five suppliers open the analysis, and the full report tracks more than 30 companies in mining reagents and fertilizer process chemistry.
How is the market segmented?
-
By Aid Function
- Flotation aids
- Anti-caking agents
- Dust control additives
- Defoaming agents
- Scale inhibitors
-
By Process Stage
- Beneficiation
- Granulation
- Drying/cooling
- Storage/handling
- Wet acid processing
-
By Chemical Base
- Fatty amine/fatty acid
- Polymer additives
- Surfactant blends
- Inorganic salts
- Silicone-free defoamers
-
By Customer Type
- Phosphate miners
- Fertilizer producers
- Chemical processors
- Trading houses
- EPC/process licensors
-
By Mineral Route
- Sedimentary phosphate
- Igneous phosphate
- Low-grade ore
- Recycled phosphate
- Specialty concentrates
-
By Region
- North America
- United States
- Europe
- Germany
- Asia Pacific
- China
- Japan
- South Korea
- South Asia
- India
- Latin America
- Brazil
- Middle East and Africa
- Morocco
- Saudi Arabia
- Russia
- United Arab Emirates
- Italy
- United Kingdom
- North America
Bibliography
- U.S. Geological Survey. (2026). Phosphate Rock. In Mineral Commodity Summaries 2026. National Minerals Information Center, U.S. Department of the Interior.
- Arkema. (n.d.). Beneficiation of Phosphate Rock. Accessed July 20, 2026.
- Clariant. (n.d.). Industrial Minerals and Fertilizer Processing Chemicals. Accessed July 20, 2026.
- World Bank. (n.d.). Morocco | Data. World Development Indicators. Accessed July 20, 2026.
- U.S. Census Bureau. (n.d.). Annual Survey of Manufactures. Accessed July 20, 2026.
- State Council of the People’s Republic of China. (2021, March 9). Modern Industrial System Key to Quality Growth.
- General Authority for Statistics. (2025). Mineral Resources Statistics 2024. Kingdom of Saudi Arabia.
- Brazilian Institute of Geography and Statistics. (n.d.). Annual Survey of Industry—Enterprise. Accessed July 20, 2026.
This Report Addresses
- The report quantifies the 2025 baseline and forecasts processing-aid revenue through 2036.
- It reviews Morocco, United States, Saudi Arabia, Brazil, and Russia, within coverage that reaches more than 30 countries.
- It evaluates Solenis, Arkema, Clariant, BASF, and Nouryon.
- It analyzes flotation, anti-caking, dust-control, defoaming, and scale-inhibition functions.
- It separates beneficiation, granulation, drying, storage, and wet-acid process demand.
- It tests the forecast against ore quality, capacity additions, fertilizer handling, water reuse, and chemical supply.
What does the Phosphate Processing Aids Market cover?
The study follows recurring aid consumption from phosphate ore beneficiation through chemical conversion and finished-product handling.
Revenue is assigned to formulated chemicals consumed within a covered phosphate process. Dosage, ore route, plant utilization, aid function, and customer type are modeled separately to avoid treating all tonnes of phosphate alike.
Country estimates reflect mine output, beneficiation intensity, fertilizer and acid capacity, project pipelines, reagent access, and technical-service penetration. New projects and ongoing consumption at operating sites are both included.
What is included in the scope?
Included chemicals must perform a defined processing, reliability, or handling function within the phosphate value chain.
Collectors, depressants, frothers, modifiers, anti-caking coatings, dust suppressants, defoamers, and scale inhibitors are included when sold for phosphate service. Custom blends and performance-linked supply programs are counted at realized chemical revenue.
Sedimentary, igneous, low-grade, recycled, and specialty-concentrate routes are included according to the source taxonomy. Technical service is included only when inseparable from the reagent sale.
What is excluded from the scope?
Commodity inputs and capital equipment are outside the processing-aids boundary.
The study excludes bulk acids and bases used as primary reactants, fertilizer nutrients, mining explosives, grinding equipment, filters, pumps, and plant construction. Waste-disposal and environmental-remediation services are not counted as processing-aid revenue.
How Was the Analysis Built?
The analysis draws on 120+ sources, 35+ company portfolios, 25+ countries, and more than 20 industry interviews.
- Primary Research: Primary research includes discussions with manufacturers, service providers, technology developers, distributors, end users, procurement teams, and subject-matter experts. These conversations examine purchasing priorities, product adoption, operational challenges, approval requirements, competitive positioning, and the factors that influence wider market acceptance.
- Desk Research: Desk research covers government statistics, regulatory publications, company filings, trade data, technical studies, industry associations, standards, public policy, and other authoritative sources. Every source used in the analysis is documented in the bibliography.
- Market Sizing and Forecasting: Market estimates combine historical performance, demand indicators, pricing and volume trends, segment shares, company participation, country-level growth, adoption patterns, investment activity, and barriers to market expansion.
- Data Validation and Update Cycle: Findings are validated by comparing primary interviews with public data, company activity, regulatory changes, trade patterns, and industry developments. Regular updates review new product launches, capacity changes, partnerships, approvals, procurement trends, and shifts in commercial adoption.
What is the report's scope and coverage?
| ATTRIBUTE | DETAILS |
|---|---|
| Quantitative Units | USD 302.0 million in 2026 to USD 515.0 million by 2036 at 5.5% CAGR |
| Market Definition | The market covers specialty chemicals added during phosphate mining, beneficiation, acid processing, granulation, drying, cooling, storage, and handling to improve separation, flow, foam, dust, or scale performance. |
| Aid Function | Flotation aids; Anti-caking agents; Dust control additives; Defoaming agents; Scale inhibitors |
| Process Stage | Beneficiation; Granulation; Drying/cooling; Storage/handling; Wet acid processing |
| Chemical Base | Fatty amine/fatty acid; Polymer additives; Surfactant blends; Inorganic salts; Silicone-free defoamers |
| Customer Type | Phosphate miners; Fertilizer producers; Chemical processors; Trading houses; EPC/process licensors |
| Mineral Route | Sedimentary phosphate; Igneous phosphate; Low-grade ore; Recycled phosphate; Specialty concentrates |
| Regions Covered | North America; Europe; Middle East & Africa |
| Countries Covered | Morocco; United States; Saudi Arabia; Brazil; Russia (analysis extends to 30+ countries) |
| Key Companies Profiled | Solenis; Arkema; Clariant; BASF; Nouryon |
| Forecast Period | 2026 to 2036 |
| Approach | Sizing combines reagent consumption per tonne of ore processed with aid-function mix, process-stage intensity, and mineral-route composition, cross-checked against customer-type purchasing patterns and country-level capacity data. |

