Sewing Machine Market
Sewing Machine Market Analysis, By Product, By Mode of Operation, By Application, By End Use, By Distribution Channel, and Region - Market Insights 2025 to 2035
The Computerized segment is projected to grow at a CAGR of 6.0%, whereas another segment Automated is likely to grow at 7.2%. In terms of countries China is projected to grow at 6.3%, followed by India at 6.8% and japan to grow at 5.8%.
Sewing Machine Market Outlook (2025 to 2035)
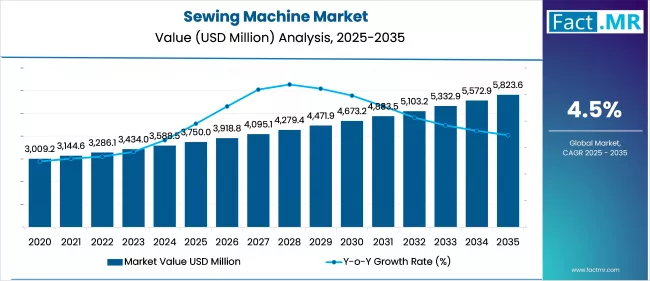
The global sewing machine market is expected to reach USD 5,824 million by 2035, up from USD 3,589.5 million in 2024. During the forecast period 2025 to 2035, the industry is projected to register at a CAGR of 4.5%.
The rising demand for automated machines in the apparel, footwear, and upholstery sectors, along with the booming DIY fashion, home sewing, and small tailoring businesses, is driving the growth of the sewing machine market. Innovations in programmable features, sustainability-driven repair trends, and government support for textile manufacturing further accelerate market expansion.
What are the drivers of Sewing Machine Market?
The global sewing machine market is driven by the rising demand for speed and automation in machines used by the garment, footwear, and upholstery industries. As the fashion and textile industries expand, particularly in fast fashion hubs such as China, Bangladesh, and Vietnam, manufacturers are purchasing industrial-grade machines to achieve bulk manufacturing timelines.
Consumers are also showing interest in home sewing, do-it-yourself fashion, and small-scale tailoring businesses, which are contributing to the demand for compact and computerized domestic sewing machines. Advancements in machine features, programmable stitching, LCD interfaces, and multi-functional attachments have changed usage patterns, making the machines more user-friendly and efficient.
Sales in the residential and hobbyist segments are further supported by growing interest in sustainable and locally made fashion, with a focus on repair and reuse. The use of industrial machines is further boosted by government incentives and projects aimed at stimulating the textile manufacturing industry in emerging economies. Overall, industrial automation, customer personalization, and sustainable practices are driving the market.
What are the regional trends of Sewing Machine Market?
Asia Pacific markets dominate the sewing machine market, with China, India, Bangladesh, and Vietnam leading the way in production and consumption. These countries serve as international hubs for the textile and garment industries, with a significant number of industrial sewing machine installations. Rapid industrialization, abundant labor supply, and supportive government policies in the textile sector continue to drive regional growth and strengthen market leadership.
There is an increasing demand for smart and computerized sewing machines in domestic and small businesses in North America and Europe. In countries such as the United States, Germany, and the United Kingdom, there is notable interest in hobby sewing and custom tailoring, influenced by growing support for sustainable practices. High-quality brands offering advanced technological features have found strong resonance in these markets.
Emerging markets include Latin America and Africa, where expansion is determined by the increasing middle-class base and the attempts to promote local textile sectors. Japan and South Korea continue to be key contributors to sewing technology innovation and remain exporters of high-end machines.
What are the challenges and restraining factors of Sewing Machine Market?
The sewing machine market has a number of challenges despite the constant upsurge. High initial investment and maintenance costs associated with industrial and computerized machines act as a barrier, particularly for small businesses and start-up firms. Additionally, a skills gap exists among workers operating complex machinery, creating a need for further training.
Market penetration is limited in emerging economies due to irregular power supply, limited financing sources, and inaccessible modern infrastructure. There is also a fluctuation in raw materials costs and the depletion of materials, mostly motors and electronic components, causing disruptions in manufacturing cycles and delays in deliveries.
Environmental concerns related to textile waste and resource-intensive mass production may result in stricter regulations, which could indirectly reduce demand for industrial sewing machines. In some established markets, saturation and a declining interest in traditional garment repair may also slow the domestic sewing machine industry.
Automated garment fabrication, which encompasses robotic sewing as well as automated sewing machines, may potentially threaten the applicability of the conventional sewing machine on a mass-scale production. Manufacturers need to overcome these challenges by focusing on innovation, cost, and after-sales service to remain competitive.
Country-Wise Outlook
Automation, Exports, and Domestic Demand Power the Sewing Machine Market in China
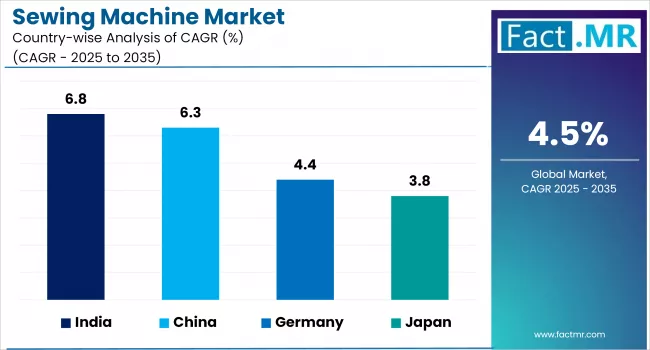
China remains a leading player in the global sewing machine industry, supported by its extensive textile and garment manufacturing base. Growth of computers and automated sewing systems in China promotes large-scale and high-precision production both locally and for exports.
The initiative of China Made in China 2025 puts an emphasis on the area of smart manufacturing and encourages investment in servo-motor technology and systems integrated with the Internet of Things. Labor costs have increased, but Tier 2 and Tier 3 cities are still deeply engaged in traditional garments production and require cost-effective, technologically equipped machinery.
Simultaneously, advancements in embroidery and high-speed lockstitch machines designed for mass production are being supported by government subsidies and research and development tax incentives.
India’s Domestic Garment Surge Fuels Mid-Range and Household Machine Growth
India is emerging as a growing center for the sewing machine market owing to surge in domestic clothing demand, as well as growth in home based tailoring and MSMEs. High volume garment infrastructure is being boosted by the Production Linked Incentive (PLI) scheme of the government and the PM MITRA parks which have increased demand for both industrial and semi-industrial sewing machines.
Meanwhile, self-employment schemes such as the Skill India Mission aid the penetration of household sewing machines, particularly manual and simple electrical ones, into the rural spaces. Smart and compact, zig zag and chain-stitch models that fit smaller working places and boutique setups are also being introduced by brands to meet this demand.
Technology, Fashion Exports, and Eco-Friendly Solutions Propel Japan’s Precision Market
Japan also has a premium presence in the sewing machine environment, with high precision computer-aided models developed through domestic engineering expertise and a focus on quality exports.
Brands such as JUKI and Brother are recognized for innovation, offering AI-compatible systems, real-time tracking features, and automated threading technology. The manufacturers are developing energy-efficient and low-noise machines driven by the eco-conscious trend, aligning with Japan’s broader sustainability objectives beyond the Society 5.0 initiative.
Category-Wise Analysis
Computerized Controls Revolutionize Precision and Productivity in Sewing Machines
Digitized sewing machines are transforming productivity in the garment industry by enabling automated stitching, computerized error detection, and simplified programmability. They are valued for their ability to minimize human errors while maximizing customization, consistency, and speed, especially in mass textile production.
Aligned with efforts to make factories more advanced and connected, computerized models can be used to integrate with wider Industry 4.0 systems, enabling predictive maintenance and quality assurance.
Industrial-Grade Machines Anchor High-Volume Apparel Manufacturing
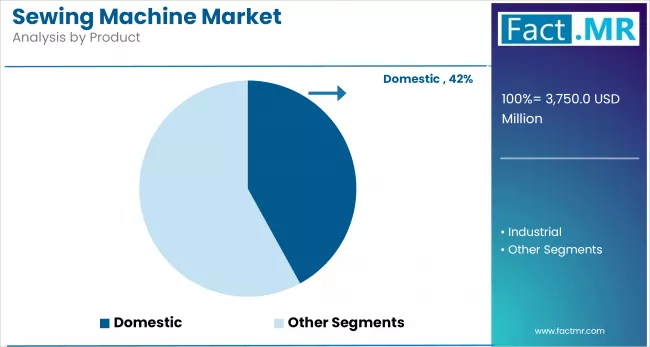
Industrial sewing machines form the foundation of garment production lines and are designed to handle heavy fabrics while operating for extended hours on a regular basis. They are strong and compact in structure, with unique features such as a high-speed lockstitch or overlock facility, which are essential for large-scale manufacturers seeking throughput and durability.
The increased demand for fast production and reshoring operations in the textile industry keeps up investment in high-performance industrial units that guarantee optimal performance while maintaining low operational costs.
Sewing Machines for Apparel Manufacturing Meet Rising Global Fashion Demands
Fashion and textile industries rely on sewing machines that are adapted for various stages of garment production, from basic stitching to intricate embroidery. The pressure of manufacturing customized goods and offering rapid turnaround challenges manufacturers to use machines capable of both precision and scalability.
In this application segment, changes in the geographic distribution of garment manufacturing, particularly in Southeast Asia and Latin America, are also influencing market dynamics. Increased production capacity in these regions is closely associated with shifts in compliance requirements and labor standards.
Competitive Analysis
The sewing machine industry remains moderately competitive, influenced by innovation and evolving user expectations. The companies have competed on the basis of automation, multi-functionality, and price to suit both domestic users and industrial requirements. The connectivity to digital technologies and IoT is a growing trend in industrial settings in a bid to enhance efficiency and make production scalable.
In the Asia Pacific market, established brands are facing competition from regional producers who offer lower-cost alternatives. E-commerce has also led to the emergence of new market participants entering global markets with lower entry barriers compared to traditional retail models.
The ability to offer reliable after-sales support, user-friendly designs, robust distribution networks, and ongoing investment in research and development remains essential for success in this market, with adaptability emerging as a key competitive factor.
Key players in the sewing machine industry are Bernina, Brother, JACK Co. Ltd., Janome Co., Ltd., JUKI Corporation, MSISM Co. Ltd., PEGASUS Mfg Co. Ltd., PFAFF Industriesysteme und Maschinen GmbH, Seiko Co., Ltd., Singer Corporation, and other players.
Recent Development
- In July 2025, JUKI launched the DX-01 single-needle lockstitch machine, the first of its kind in the world to feature a six-belt feed assist system, which reduces slippage and operator burden.
- In June 2024, BERNINA unveiled the B 990, a revolutionary sewing, quilting, and embroidery machine with a built-in projector, auto-hoop recognition, and stitch precision technology.
Fact.MR has provided detailed information about the price points of key manufacturers in the sewing machine market, positioned across regions, including sales growth, production capacity, and speculative technological expansion, in the recently published report.
Methodology and Industry Tracking Approach
Fact.MR has scrutinized the sewing machine market in 2025, which includes the participation of 3,800 stakeholders within 18 countries. Sealed in October 2020, the questionnaire involved consultation with a minimum of 80 specialists across two countries, including textile engineers, digital design experts, and sustainable appliance designers. The project was based on the integration of precision automation, smart control, and environmentally friendly materials in a next-generation sewing solution.
The prevailing trends from June 2024 to May 2025 included the customization of stitches with the aid of AI, the use of mobile applications to program multi-mode sewing machines, and voice-assisted guide systems. Green-friendly innovations, such as efficient motors, reusable enclosures, and swappable, repairable frames, have become increasingly popular. Accessory kits that could be subscribed to, reusable bobbin cartridges, and collapsible designs for saving space also gained popularity in metropolitan areas.
High-end app-syncing and Wi-Fi-enabled smart sewing machines were adopted primarily in North America and Western Europe, whereas East Asia dominated with servo motor and LCD-integrated interface improvements. Fact.MR reports on such a motion to smart, durable, and multi-purpose sewing machines since 2018.
Segmentation of Sewing machine market
-
By Product :
- Domestic
- Industrial
- Flatbed Sewing Machines
- Cylinder Bed Machines
- Post Bed Sewing Machines
- Others
-
By Mode of Operation :
- Manual
- Mechanical
- Electronic
- Computerized
- Automated
- Overlock
-
By Application :
- Sewing Machines for Apparel Manufacturing
- Embroidery Sewing Machines
- Sewing Machines for Non-apparel Manufacturing
- Bags
- Car Upholstery
- Furniture Clothing
- Others
-
By End Use :
- Residential
- Commercial
- Industrial
-
By Distribution Channel :
- Online Channels
- E-commerce Websites
- Company-owned Websites
- Offline Channels
- Specialty Stores
- Hypermarkets & Departmental Stores
- Others
- Online Channels
-
By Region :
- North America
- Latin America
- Western Europe
- Eastern Europe
- East Asia
- South Asia & Pacific
- Middle East & Africa
Table of Content
- Executive Summary
- Global Market Outlook
- Demand-side Trends
- Supply-side Trends
- Technology Roadmap Analysis
- Analysis and Recommendations
- Market Overview
- Market Coverage / Taxonomy
- Market Definition / Scope / Limitations
- Market Background
- Market Dynamics
- Drivers
- Restraints
- Opportunity
- Trends
- Scenario Forecast
- Demand in Optimistic Scenario
- Demand in Likely Scenario
- Demand in Conservative Scenario
- Opportunity Map Analysis
- Product Life Cycle Analysis
- Supply Chain Analysis
- Supply Side Participants and their Roles
- Producers
- Mid-Level Participants (Traders/ Agents/ Brokers)
- Wholesalers and Distributors
- Value Added and Value Created at Node in the Supply Chain
- List of Component Suppliers
- List of Existing and Potential Buyers
- Supply Side Participants and their Roles
- Investment Feasibility Matrix
- Value Chain Analysis
- Profit Margin Analysis
- Wholesalers and Distributors
- Retailers
- PESTLE and Porter’s Analysis
- Regulatory Landscape
- By Key Regions
- By Key Countries
- Production and Consumption Statistics
- Import and Export Statistics
- Market Dynamics
- Global Market Analysis 2020 to 2024 and Forecast, 2025 to 2035
- Historical Market Size Value (USD Mn) & Volume (Units) Analysis, 2020 to 2024
- Current and Future Market Size Value (USD Mn) & Volume (Units) Projections, 2025 to 2035
- Y-o-Y Growth Trend Analysis
- Absolute $ Opportunity Analysis
- Global Market Pricing Analysis 2020 to 2024 and Forecast 2025 to 2035
- Global Market Analysis 2020 to 2024 and Forecast 2025 to 2035, By Product
- Introduction / Key Findings
- Historical Market Size Value (USD Mn) & Volume (Units) Analysis By Product, 2020 to 2024
- Current and Future Market Size Value (USD Mn) & Volume (Units) Analysis and Forecast By Product, 2025 to 2035
- Domestic
- Industrial
- Flatbed Sewing Machines
- Cylinder Bed Machines
- Post Bed Sewing Machines
- Others
- Y-o-Y Growth Trend Analysis By Product, 2020 to 2024
- Absolute $ Opportunity Analysis By Product, 2025 to 2035
- Global Market Analysis 2020 to 2024 and Forecast 2025 to 2035, By Mode of Operation
- Introduction / Key Findings
- Historical Market Size Value (USD Mn) & Volume (Units) Analysis By Mode of Operation, 2020 to 2024
- Current and Future Market Size Value (USD Mn) & Volume (Units) Analysis and Forecast By Mode of Operation, 2025 to 2035
- Manual
- Mechanical
- Electronic
- Computerized
- Automated
- Overlock
- Y-o-Y Growth Trend Analysis By Mode of Operation, 2020 to 2024
- Absolute $ Opportunity Analysis By Mode of Operation, 2025 to 2035
- Global Market Analysis 2020 to 2024 and Forecast 2025 to 2035, By Application
- Introduction / Key Findings
- Historical Market Size Value (USD Mn) & Volume (Units) Analysis By Application, 2020 to 2024
- Current and Future Market Size Value (USD Mn) & Volume (Units) Analysis and Forecast By Application, 2025 to 2035
- Sewing Machines for Apparel Manufacturing
- Embroidery Sewing Machines
- Sewing Machines for Non-apparel Manufacturing
- Bags
- Car Upholstery
- Furniture Clothing
- Others
- Y-o-Y Growth Trend Analysis By Application, 2020 to 2024
- Absolute $ Opportunity Analysis By Application, 2025 to 2035
- Global Market Analysis 2020 to 2024 and Forecast 2025 to 2035, By End Use
- Introduction / Key Findings
- Historical Market Size Value (USD Mn) & Volume (Units) Analysis By End Use, 2020 to 2024
- Current and Future Market Size Value (USD Mn) & Volume (Units) Analysis and Forecast By End Use, 2025 to 2035
- Residential
- Commercial
- Industrial
- Y-o-Y Growth Trend Analysis By End Use, 2020 to 2024
- Absolute $ Opportunity Analysis By End Use, 2025 to 2035
- Global Market Analysis 2020 to 2024 and Forecast 2025 to 2035, By Distribution Channel
- Introduction / Key Findings
- Historical Market Size Value (USD Mn) & Volume (Units) Analysis By Distribution Channel, 2020 to 2024
- Current and Future Market Size Value (USD Mn) & Volume (Units) Analysis and Forecast By Distribution Channel, 2025 to 2035
- Online Channels
- E-commerce Websites
- Company-owned Websites
- Offline Channels
- Specialty Stores
- Hypermarkets & Departmental Stores
- Others
- Online Channels
- Y-o-Y Growth Trend Analysis By Distribution Channel, 2020 to 2024
- Absolute $ Opportunity Analysis By Distribution Channel, 2025 to 2035
- Global Market Analysis 2020 to 2024 and Forecast 2025 to 2035, By Region
- Introduction
- Historical Market Size Value (USD Mn) & Volume (Units) Analysis By Region, 2020 to 2024
- Current Market Size Value (USD Mn) & Volume (Units) Analysis and Forecast By Region, 2025 to 2035
- North America
- Latin America
- Western Europe
- East Asia
- South Asia Pacific
- Eastern Europe
- Middle East & Africa
- Market Attractiveness Analysis By Region
- North America Market Analysis 2020 to 2024 and Forecast 2025 to 2035, By Country
- Historical Market Size Value (USD Mn) & Volume (Units) Trend Analysis By Market Taxonomy, 2020 to 2024
- Market Size Value (USD Mn) & Volume (Units) Forecast By Market Taxonomy, 2025 to 2035
- By Country
- U.S.
- Canada
- Mexico
- By Product
- By Mode of Operation
- By Application
- By End Use
- By Distribution Channel
- By Country
- Market Attractiveness Analysis
- By Country
- By Product
- By Mode of Operation
- By Application
- By End Use
- By Distribution Channel
- Key Takeaways
- Latin America Market Analysis 2020 to 2024 and Forecast 2025 to 2035, By Country
- Historical Market Size Value (USD Mn) & Volume (Units) Trend Analysis By Market Taxonomy, 2020 to 2024
- Market Size Value (USD Mn) & Volume (Units) Forecast By Market Taxonomy, 2025 to 2035
- By Country
- Brazil
- Chile
- Rest of Latin America
- By Product
- By Mode of Operation
- By Application
- By End Use
- By Distribution Channel
- By Country
- Market Attractiveness Analysis
- By Country
- By Product
- By Mode of Operation
- By Application
- By End Use
- By Distribution Channel
- Key Takeaways
- Western Europe Market Analysis 2020 to 2024 and Forecast 2025 to 2035, By Country
- Historical Market Size Value (USD Mn) & Volume (Units) Trend Analysis By Market Taxonomy, 2020 to 2024
- Market Size Value (USD Mn) & Volume (Units) Forecast By Market Taxonomy, 2025 to 2035
- By Country
- Germany
- Italy
- France
- U.K.
- Spain
- Russia
- BENELUX
- Rest of Europe
- By Product
- By Mode of Operation
- By Application
- By End Use
- By Distribution Channel
- By Country
- Market Attractiveness Analysis
- By Country
- By Product
- By Mode of Operation
- By Application
- By End Use
- By Distribution Channel
- Key Takeaways
- East Asia Market Analysis 2020 to 2024 and Forecast 2025 to 2035, By Country
- Historical Market Size Value (USD Mn) & Volume (Units) Trend Analysis By Market Taxonomy, 2020 to 2024
- Market Size Value (USD Mn) & Volume (Units) Forecast By Market Taxonomy, 2025 to 2035
- By Country
- China
- Japan
- South Korea
- By Product
- By Mode of Operation
- By Application
- By End Use
- By Distribution Channel
- By Country
- Market Attractiveness Analysis
- By Country
- By Product
- By Mode of Operation
- By Application
- By End Use
- By Distribution Channel
- Key Takeaways
- South Asia Pacific Market Analysis 2020 to 2024 and Forecast 2025 to 2035, By Country
- Historical Market Size Value (USD Mn) & Volume (Units) Trend Analysis By Market Taxonomy, 2020 to 2024
- Market Size Value (USD Mn) & Volume (Units) Forecast By Market Taxonomy, 2025 to 2035
- By Country
- India
- ASEAN Countries
- Australia & New Zealand
- Rest of South Asia Pacific
- By Product
- By Mode of Operation
- By Application
- By End Use
- By Distribution Channel
- By Country
- Market Attractiveness Analysis
- By Country
- By Product
- By Mode of Operation
- By Application
- By End Use
- By Distribution Channel
- Key Takeaways
- Eastern Europe Market Analysis 2020 to 2024 and Forecast 2025 to 2035, By Country
- Historical Market Size Value (USD Mn) & Volume (Units) Trend Analysis By Market Taxonomy, 2020 to 2024
- Market Size Value (USD Mn) & Volume (Units) Forecast By Market Taxonomy, 2025 to 2035
- By Country
- Russia
- Poland
- Hungary
- Balkan & Baltics
- Rest of Eastern Europe
- By Product
- By Mode of Operation
- By Application
- By End Use
- By Distribution Channel
- By Country
- Market Attractiveness Analysis
- By Country
- By Product
- By Mode of Operation
- By Application
- By End Use
- By Distribution Channel
- Key Takeaways
- Middle East & Africa Market Analysis 2020 to 2024 and Forecast 2025 to 2035, By Country
- Historical Market Size Value (USD Mn) & Volume (Units) Trend Analysis By Market Taxonomy, 2020 to 2024
- Market Size Value (USD Mn) & Volume (Units) Forecast By Market Taxonomy, 2025 to 2035
- By Country
- KSA
- Other GCC Countries
- Turkiye
- South Africa
- Rest of MEA
- By Product
- By Mode of Operation
- By Application
- By End Use
- By Distribution Channel
- By Country
- Market Attractiveness Analysis
- By Country
- By Product
- By Mode of Operation
- By Application
- By End Use
- By Distribution Channel
- Key Takeaways
- Key Countries Market Analysis
- China
- Pricing Analysis
- Market Share Analysis, 2024
- By Product
- By Mode of Operation
- By Application
- By End Use
- By Distribution Channel
- India
- Pricing Analysis
- Market Share Analysis, 2024
- By Product
- By Mode of Operation
- By Application
- By End Use
- By Distribution Channel
- Japan
- Pricing Analysis
- Market Share Analysis, 2024
- By Product
- By Mode of Operation
- By Application
- By End Use
- By Distribution Channel
- Germany
- Pricing Analysis
- Market Share Analysis, 2024
- By Product
- By Mode of Operation
- By Application
- By End Use
- By Distribution Channel
- Value (USD Mn) & Volume (Units)ed States
- Pricing Analysis
- Market Share Analysis, 2024
- By Product
- By Mode of Operation
- By Application
- By End Use
- By Distribution Channel
- China
- Market Structure Analysis
- Competition Dashboard
- Competition Benchmarking
- Market Share Analysis of Top Players
- By Regional
- By Product
- By Mode of Operation
- By Application
- By End Use
- By Distribution Channel
- Competition Analysis
- Competition Deep Dive
- Bernina
- Overview
- Product Portfolio
- Profitability by Market Segments (Product/Age /Sales Channel/Region)
- Sales Footprint
- Strategy Overview
- Marketing Strategy
- Product Strategy
- Channel Strategy
- Brother
- Overview
- Product Portfolio
- Profitability by Market Segments (Product/Age /Sales Channel/Region)
- Sales Footprint
- Strategy Overview
- Marketing Strategy
- Product Strategy
- Channel Strategy
- JACK Co. Ltd.
- Overview
- Product Portfolio
- Profitability by Market Segments (Product/Age /Sales Channel/Region)
- Sales Footprint
- Strategy Overview
- Marketing Strategy
- Product Strategy
- Channel Strategy
- Janome Co., Ltd.
- Overview
- Product Portfolio
- Profitability by Market Segments (Product/Age /Sales Channel/Region)
- Sales Footprint
- Strategy Overview
- Marketing Strategy
- Product Strategy
- Channel Strategy
- JUKI Corporation
- Overview
- Product Portfolio
- Profitability by Market Segments (Product/Age /Sales Channel/Region)
- Sales Footprint
- Strategy Overview
- Marketing Strategy
- Product Strategy
- Channel Strategy
- MSISM Co. Ltd.
- Overview
- Product Portfolio
- Profitability by Market Segments (Product/Age /Sales Channel/Region)
- Sales Footprint
- Strategy Overview
- Marketing Strategy
- Product Strategy
- Channel Strategy
- PEGASUS Mfg Co. Ltd.
- Overview
- Product Portfolio
- Profitability by Market Segments (Product/Age /Sales Channel/Region)
- Sales Footprint
- Strategy Overview
- Marketing Strategy
- Product Strategy
- Channel Strategy
- PFAFF Industriesysteme und Maschinen GmbH
- Overview
- Product Portfolio
- Profitability by Market Segments (Product/Age /Sales Channel/Region)
- Sales Footprint
- Strategy Overview
- Marketing Strategy
- Product Strategy
- Channel Strategy
- Seiko Co., Ltd.
- Overview
- Product Portfolio
- Profitability by Market Segments (Product/Age /Sales Channel/Region)
- Sales Footprint
- Strategy Overview
- Marketing Strategy
- Product Strategy
- Channel Strategy
- Singer Corporation
- Overview
- Product Portfolio
- Profitability by Market Segments (Product/Age /Sales Channel/Region)
- Sales Footprint
- Strategy Overview
- Marketing Strategy
- Product Strategy
- Channel Strategy
- Bernina
- Competition Deep Dive
- Assumptions & Acronyms Used
- Research Methodology
List Of Table
- Table 1: Global Market Value (USD Mn) Forecast by Region, 2020 to 2035
- Table 2: Global Market Volume (Units) Forecast by Region, 2020 to 2035
- Table 3: Global Market Value (USD Mn) Forecast by Product, 2020 to 2035
- Table 4: Global Market Volume (Units) Forecast by Product, 2020 to 2035
- Table 5: Global Market Value (USD Mn) Forecast by Mode of Operation, 2020 to 2035
- Table 6: Global Market Volume (Units) Forecast by Mode of Operation, 2020 to 2035
- Table 7: Global Market Value (USD Mn) Forecast by Application, 2020 to 2035
- Table 8: Global Market Volume (Units) Forecast by Application, 2020 to 2035
- Table 9: Global Market Value (USD Mn) Forecast by End Use, 2020 to 2035
- Table 10: Global Market Volume (Units) Forecast by End Use, 2020 to 2035
- Table 11: Global Market Value (USD Mn) Forecast by Distribution Channel, 2020 to 2035
- Table 12: Global Market Volume (Units) Forecast by Distribution Channel, 2020 to 2035
- Table 13: North America Market Value (USD Mn) Forecast by Country, 2020 to 2035
- Table 14: North America Market Volume (Units) Forecast by Country, 2020 to 2035
- Table 15: North America Market Value (USD Mn) Forecast by Product, 2020 to 2035
- Table 16: North America Market Volume (Units) Forecast by Product, 2020 to 2035
- Table 17: North America Market Value (USD Mn) Forecast by Mode of Operation, 2020 to 2035
- Table 18: North America Market Volume (Units) Forecast by Mode of Operation, 2020 to 2035
- Table 19: North America Market Value (USD Mn) Forecast by Application, 2020 to 2035
- Table 20: North America Market Volume (Units) Forecast by Application, 2020 to 2035
- Table 21: North America Market Value (USD Mn) Forecast by End Use, 2020 to 2035
- Table 22: North America Market Volume (Units) Forecast by End Use, 2020 to 2035
- Table 23: North America Market Value (USD Mn) Forecast by Distribution Channel, 2020 to 2035
- Table 24: North America Market Volume (Units) Forecast by Distribution Channel, 2020 to 2035
- Table 25: Latin America Market Value (USD Mn) Forecast by Country, 2020 to 2035
- Table 26: Latin America Market Volume (Units) Forecast by Country, 2020 to 2035
- Table 27: Latin America Market Value (USD Mn) Forecast by Product, 2020 to 2035
- Table 28: Latin America Market Volume (Units) Forecast by Product, 2020 to 2035
- Table 29: Latin America Market Value (USD Mn) Forecast by Mode of Operation, 2020 to 2035
- Table 30: Latin America Market Volume (Units) Forecast by Mode of Operation, 2020 to 2035
- Table 31: Latin America Market Value (USD Mn) Forecast by Application, 2020 to 2035
- Table 32: Latin America Market Volume (Units) Forecast by Application, 2020 to 2035
- Table 33: Latin America Market Value (USD Mn) Forecast by End Use, 2020 to 2035
- Table 34: Latin America Market Volume (Units) Forecast by End Use, 2020 to 2035
- Table 35: Latin America Market Value (USD Mn) Forecast by Distribution Channel, 2020 to 2035
- Table 36: Latin America Market Volume (Units) Forecast by Distribution Channel, 2020 to 2035
- Table 37: Western Europe Market Value (USD Mn) Forecast by Country, 2020 to 2035
- Table 38: Western Europe Market Volume (Units) Forecast by Country, 2020 to 2035
- Table 39: Western Europe Market Value (USD Mn) Forecast by Product, 2020 to 2035
- Table 40: Western Europe Market Volume (Units) Forecast by Product, 2020 to 2035
- Table 41: Western Europe Market Value (USD Mn) Forecast by Mode of Operation, 2020 to 2035
- Table 42: Western Europe Market Volume (Units) Forecast by Mode of Operation, 2020 to 2035
- Table 43: Western Europe Market Value (USD Mn) Forecast by Application, 2020 to 2035
- Table 44: Western Europe Market Volume (Units) Forecast by Application, 2020 to 2035
- Table 45: Western Europe Market Value (USD Mn) Forecast by End Use, 2020 to 2035
- Table 46: Western Europe Market Volume (Units) Forecast by End Use, 2020 to 2035
- Table 47: Western Europe Market Value (USD Mn) Forecast by Distribution Channel, 2020 to 2035
- Table 48: Western Europe Market Volume (Units) Forecast by Distribution Channel, 2020 to 2035
- Table 49: East Asia Market Value (USD Mn) Forecast by Country, 2020 to 2035
- Table 50: East Asia Market Volume (Units) Forecast by Country, 2020 to 2035
- Table 51: East Asia Market Value (USD Mn) Forecast by Product, 2020 to 2035
- Table 52: East Asia Market Volume (Units) Forecast by Product, 2020 to 2035
- Table 53: East Asia Market Value (USD Mn) Forecast by Mode of Operation, 2020 to 2035
- Table 54: East Asia Market Volume (Units) Forecast by Mode of Operation, 2020 to 2035
- Table 55: East Asia Market Value (USD Mn) Forecast by Application, 2020 to 2035
- Table 56: East Asia Market Volume (Units) Forecast by Application, 2020 to 2035
- Table 57: East Asia Market Value (USD Mn) Forecast by End Use, 2020 to 2035
- Table 58: East Asia Market Volume (Units) Forecast by End Use, 2020 to 2035
- Table 59: East Asia Market Value (USD Mn) Forecast by Distribution Channel, 2020 to 2035
- Table 60: East Asia Market Volume (Units) Forecast by Distribution Channel, 2020 to 2035
- Table 61: South Asia Pacific Market Value (USD Mn) Forecast by Country, 2020 to 2035
- Table 62: South Asia Pacific Market Volume (Units) Forecast by Country, 2020 to 2035
- Table 63: South Asia Pacific Market Value (USD Mn) Forecast by Product, 2020 to 2035
- Table 64: South Asia Pacific Market Volume (Units) Forecast by Product, 2020 to 2035
- Table 65: South Asia Pacific Market Value (USD Mn) Forecast by Mode of Operation, 2020 to 2035
- Table 66: South Asia Pacific Market Volume (Units) Forecast by Mode of Operation, 2020 to 2035
- Table 67: South Asia Pacific Market Value (USD Mn) Forecast by Application, 2020 to 2035
- Table 68: South Asia Pacific Market Volume (Units) Forecast by Application, 2020 to 2035
- Table 69: South Asia Pacific Market Value (USD Mn) Forecast by End Use, 2020 to 2035
- Table 70: South Asia Pacific Market Volume (Units) Forecast by End Use, 2020 to 2035
- Table 71: South Asia Pacific Market Value (USD Mn) Forecast by Distribution Channel, 2020 to 2035
- Table 72: South Asia Pacific Market Volume (Units) Forecast by Distribution Channel, 2020 to 2035
- Table 73: Eastern Europe Market Value (USD Mn) Forecast by Country, 2020 to 2035
- Table 74: Eastern Europe Market Volume (Units) Forecast by Country, 2020 to 2035
- Table 75: Eastern Europe Market Value (USD Mn) Forecast by Product, 2020 to 2035
- Table 76: Eastern Europe Market Volume (Units) Forecast by Product, 2020 to 2035
- Table 77: Eastern Europe Market Value (USD Mn) Forecast by Mode of Operation, 2020 to 2035
- Table 78: Eastern Europe Market Volume (Units) Forecast by Mode of Operation, 2020 to 2035
- Table 79: Eastern Europe Market Value (USD Mn) Forecast by Application, 2020 to 2035
- Table 80: Eastern Europe Market Volume (Units) Forecast by Application, 2020 to 2035
- Table 81: Eastern Europe Market Value (USD Mn) Forecast by End Use, 2020 to 2035
- Table 82: Eastern Europe Market Volume (Units) Forecast by End Use, 2020 to 2035
- Table 83: Eastern Europe Market Value (USD Mn) Forecast by Distribution Channel, 2020 to 2035
- Table 84: Eastern Europe Market Volume (Units) Forecast by Distribution Channel, 2020 to 2035
- Table 85: Middle East & Africa Market Value (USD Mn) Forecast by Country, 2020 to 2035
- Table 86: Middle East & Africa Market Volume (Units) Forecast by Country, 2020 to 2035
- Table 87: Middle East & Africa Market Value (USD Mn) Forecast by Product, 2020 to 2035
- Table 88: Middle East & Africa Market Volume (Units) Forecast by Product, 2020 to 2035
- Table 89: Middle East & Africa Market Value (USD Mn) Forecast by Mode of Operation, 2020 to 2035
- Table 90: Middle East & Africa Market Volume (Units) Forecast by Mode of Operation, 2020 to 2035
- Table 91: Middle East & Africa Market Value (USD Mn) Forecast by Application, 2020 to 2035
- Table 92: Middle East & Africa Market Volume (Units) Forecast by Application, 2020 to 2035
- Table 93: Middle East & Africa Market Value (USD Mn) Forecast by End Use, 2020 to 2035
- Table 94: Middle East & Africa Market Volume (Units) Forecast by End Use, 2020 to 2035
- Table 95: Middle East & Africa Market Value (USD Mn) Forecast by Distribution Channel, 2020 to 2035
- Table 96: Middle East & Africa Market Volume (Units) Forecast by Distribution Channel, 2020 to 2035
List Of Figures
- Figure 1: Global Market Volume (Units) Forecast 2020 to 2035
- Figure 2: Global Market Pricing Analysis
- Figure 3: Global Market Value (USD Mn) Forecast 2020 to 2035
- Figure 4: Global Market Value Share and BPS Analysis by Product, 2025 and 2035
- Figure 5: Global Market Y-o-Y Growth Comparison by Product, 2025 to 2035
- Figure 6: Global Market Attractiveness Analysis by Product
- Figure 7: Global Market Value Share and BPS Analysis by Mode of Operation, 2025 and 2035
- Figure 8: Global Market Y-o-Y Growth Comparison by Mode of Operation, 2025 to 2035
- Figure 9: Global Market Attractiveness Analysis by Mode of Operation
- Figure 10: Global Market Value Share and BPS Analysis by Application, 2025 and 2035
- Figure 11: Global Market Y-o-Y Growth Comparison by Application, 2025 to 2035
- Figure 12: Global Market Attractiveness Analysis by Application
- Figure 13: Global Market Value Share and BPS Analysis by End Use, 2025 and 2035
- Figure 14: Global Market Y-o-Y Growth Comparison by End Use, 2025 to 2035
- Figure 15: Global Market Attractiveness Analysis by End Use
- Figure 16: Global Market Value Share and BPS Analysis by Distribution Channel, 2025 and 2035
- Figure 17: Global Market Y-o-Y Growth Comparison by Distribution Channel, 2025 to 2035
- Figure 18: Global Market Attractiveness Analysis by Distribution Channel
- Figure 19: Global Market Value (USD Mn) Share and BPS Analysis by Region, 2025 and 2035
- Figure 20: Global Market Y-o-Y Growth Comparison by Region, 2025 to 2035
- Figure 21: Global Market Attractiveness Analysis by Region
- Figure 22: North America Market Incremental $ Opportunity, 2025 to 2035
- Figure 23: Latin America Market Incremental $ Opportunity, 2025 to 2035
- Figure 24: Western Europe Market Incremental $ Opportunity, 2025 to 2035
- Figure 25: East Asia Market Incremental $ Opportunity, 2025 to 2035
- Figure 26: South Asia Pacific Market Incremental $ Opportunity, 2025 to 2035
- Figure 27: Eastern Europe Market Incremental $ Opportunity, 2025 to 2035
- Figure 28: Middle East & Africa Market Incremental $ Opportunity, 2025 to 2035
- Figure 29: North America Market Value Share and BPS Analysis by Country, 2025 and 2035
- Figure 30: North America Market Value Share and BPS Analysis by Product, 2025 and 2035
- Figure 31: North America Market Y-o-Y Growth Comparison by Product, 2025 to 2035
- Figure 32: North America Market Attractiveness Analysis by Product
- Figure 33: North America Market Value Share and BPS Analysis by Mode of Operation, 2025 and 2035
- Figure 34: North America Market Y-o-Y Growth Comparison by Mode of Operation, 2025 to 2035
- Figure 35: North America Market Attractiveness Analysis by Mode of Operation
- Figure 36: North America Market Value Share and BPS Analysis by Application, 2025 and 2035
- Figure 37: North America Market Y-o-Y Growth Comparison by Application, 2025 to 2035
- Figure 38: North America Market Attractiveness Analysis by Application
- Figure 39: North America Market Value Share and BPS Analysis by End Use, 2025 and 2035
- Figure 40: North America Market Y-o-Y Growth Comparison by End Use, 2025 to 2035
- Figure 41: North America Market Attractiveness Analysis by End Use
- Figure 42: North America Market Value Share and BPS Analysis by Distribution Channel, 2025 and 2035
- Figure 43: North America Market Y-o-Y Growth Comparison by Distribution Channel, 2025 to 2035
- Figure 44: North America Market Attractiveness Analysis by Distribution Channel
- Figure 45: Latin America Market Value Share and BPS Analysis by Country, 2025 and 2035
- Figure 46: Latin America Market Value Share and BPS Analysis by Product, 2025 and 2035
- Figure 47: Latin America Market Y-o-Y Growth Comparison by Product, 2025 to 2035
- Figure 48: Latin America Market Attractiveness Analysis by Product
- Figure 49: Latin America Market Value Share and BPS Analysis by Mode of Operation, 2025 and 2035
- Figure 50: Latin America Market Y-o-Y Growth Comparison by Mode of Operation, 2025 to 2035
- Figure 51: Latin America Market Attractiveness Analysis by Mode of Operation
- Figure 52: Latin America Market Value Share and BPS Analysis by Application, 2025 and 2035
- Figure 53: Latin America Market Y-o-Y Growth Comparison by Application, 2025 to 2035
- Figure 54: Latin America Market Attractiveness Analysis by Application
- Figure 55: Latin America Market Value Share and BPS Analysis by End Use, 2025 and 2035
- Figure 56: Latin America Market Y-o-Y Growth Comparison by End Use, 2025 to 2035
- Figure 57: Latin America Market Attractiveness Analysis by End Use
- Figure 58: Latin America Market Value Share and BPS Analysis by Distribution Channel, 2025 and 2035
- Figure 59: Latin America Market Y-o-Y Growth Comparison by Distribution Channel, 2025 to 2035
- Figure 60: Latin America Market Attractiveness Analysis by Distribution Channel
- Figure 61: Western Europe Market Value Share and BPS Analysis by Country, 2025 and 2035
- Figure 62: Western Europe Market Value Share and BPS Analysis by Product, 2025 and 2035
- Figure 63: Western Europe Market Y-o-Y Growth Comparison by Product, 2025 to 2035
- Figure 64: Western Europe Market Attractiveness Analysis by Product
- Figure 65: Western Europe Market Value Share and BPS Analysis by Mode of Operation, 2025 and 2035
- Figure 66: Western Europe Market Y-o-Y Growth Comparison by Mode of Operation, 2025 to 2035
- Figure 67: Western Europe Market Attractiveness Analysis by Mode of Operation
- Figure 68: Western Europe Market Value Share and BPS Analysis by Application, 2025 and 2035
- Figure 69: Western Europe Market Y-o-Y Growth Comparison by Application, 2025 to 2035
- Figure 70: Western Europe Market Attractiveness Analysis by Application
- Figure 71: Western Europe Market Value Share and BPS Analysis by End Use, 2025 and 2035
- Figure 72: Western Europe Market Y-o-Y Growth Comparison by End Use, 2025 to 2035
- Figure 73: Western Europe Market Attractiveness Analysis by End Use
- Figure 74: Western Europe Market Value Share and BPS Analysis by Distribution Channel, 2025 and 2035
- Figure 75: Western Europe Market Y-o-Y Growth Comparison by Distribution Channel, 2025 to 2035
- Figure 76: Western Europe Market Attractiveness Analysis by Distribution Channel
- Figure 77: East Asia Market Value Share and BPS Analysis by Country, 2025 and 2035
- Figure 78: East Asia Market Value Share and BPS Analysis by Product, 2025 and 2035
- Figure 79: East Asia Market Y-o-Y Growth Comparison by Product, 2025 to 2035
- Figure 80: East Asia Market Attractiveness Analysis by Product
- Figure 81: East Asia Market Value Share and BPS Analysis by Mode of Operation, 2025 and 2035
- Figure 82: East Asia Market Y-o-Y Growth Comparison by Mode of Operation, 2025 to 2035
- Figure 83: East Asia Market Attractiveness Analysis by Mode of Operation
- Figure 84: East Asia Market Value Share and BPS Analysis by Application, 2025 and 2035
- Figure 85: East Asia Market Y-o-Y Growth Comparison by Application, 2025 to 2035
- Figure 86: East Asia Market Attractiveness Analysis by Application
- Figure 87: East Asia Market Value Share and BPS Analysis by End Use, 2025 and 2035
- Figure 88: East Asia Market Y-o-Y Growth Comparison by End Use, 2025 to 2035
- Figure 89: East Asia Market Attractiveness Analysis by End Use
- Figure 90: East Asia Market Value Share and BPS Analysis by Distribution Channel, 2025 and 2035
- Figure 91: East Asia Market Y-o-Y Growth Comparison by Distribution Channel, 2025 to 2035
- Figure 92: East Asia Market Attractiveness Analysis by Distribution Channel
- Figure 93: South Asia Pacific Market Value Share and BPS Analysis by Country, 2025 and 2035
- Figure 94: South Asia Pacific Market Value Share and BPS Analysis by Product, 2025 and 2035
- Figure 95: South Asia Pacific Market Y-o-Y Growth Comparison by Product, 2025 to 2035
- Figure 96: South Asia Pacific Market Attractiveness Analysis by Product
- Figure 97: South Asia Pacific Market Value Share and BPS Analysis by Mode of Operation, 2025 and 2035
- Figure 98: South Asia Pacific Market Y-o-Y Growth Comparison by Mode of Operation, 2025 to 2035
- Figure 99: South Asia Pacific Market Attractiveness Analysis by Mode of Operation
- Figure 100: South Asia Pacific Market Value Share and BPS Analysis by Application, 2025 and 2035
- Figure 101: South Asia Pacific Market Y-o-Y Growth Comparison by Application, 2025 to 2035
- Figure 102: South Asia Pacific Market Attractiveness Analysis by Application
- Figure 103: South Asia Pacific Market Value Share and BPS Analysis by End Use, 2025 and 2035
- Figure 104: South Asia Pacific Market Y-o-Y Growth Comparison by End Use, 2025 to 2035
- Figure 105: South Asia Pacific Market Attractiveness Analysis by End Use
- Figure 106: South Asia Pacific Market Value Share and BPS Analysis by Distribution Channel, 2025 and 2035
- Figure 107: South Asia Pacific Market Y-o-Y Growth Comparison by Distribution Channel, 2025 to 2035
- Figure 108: South Asia Pacific Market Attractiveness Analysis by Distribution Channel
- Figure 109: Eastern Europe Market Value Share and BPS Analysis by Country, 2025 and 2035
- Figure 110: Eastern Europe Market Value Share and BPS Analysis by Product, 2025 and 2035
- Figure 111: Eastern Europe Market Y-o-Y Growth Comparison by Product, 2025 to 2035
- Figure 112: Eastern Europe Market Attractiveness Analysis by Product
- Figure 113: Eastern Europe Market Value Share and BPS Analysis by Mode of Operation, 2025 and 2035
- Figure 114: Eastern Europe Market Y-o-Y Growth Comparison by Mode of Operation, 2025 to 2035
- Figure 115: Eastern Europe Market Attractiveness Analysis by Mode of Operation
- Figure 116: Eastern Europe Market Value Share and BPS Analysis by Application, 2025 and 2035
- Figure 117: Eastern Europe Market Y-o-Y Growth Comparison by Application, 2025 to 2035
- Figure 118: Eastern Europe Market Attractiveness Analysis by Application
- Figure 119: Eastern Europe Market Value Share and BPS Analysis by End Use, 2025 and 2035
- Figure 120: Eastern Europe Market Y-o-Y Growth Comparison by End Use, 2025 to 2035
- Figure 121: Eastern Europe Market Attractiveness Analysis by End Use
- Figure 122: Eastern Europe Market Value Share and BPS Analysis by Distribution Channel, 2025 and 2035
- Figure 123: Eastern Europe Market Y-o-Y Growth Comparison by Distribution Channel, 2025 to 2035
- Figure 124: Eastern Europe Market Attractiveness Analysis by Distribution Channel
- Figure 125: Middle East & Africa Market Value Share and BPS Analysis by Country, 2025 and 2035
- Figure 126: Middle East & Africa Market Value Share and BPS Analysis by Product, 2025 and 2035
- Figure 127: Middle East & Africa Market Y-o-Y Growth Comparison by Product, 2025 to 2035
- Figure 128: Middle East & Africa Market Attractiveness Analysis by Product
- Figure 129: Middle East & Africa Market Value Share and BPS Analysis by Mode of Operation, 2025 and 2035
- Figure 130: Middle East & Africa Market Y-o-Y Growth Comparison by Mode of Operation, 2025 to 2035
- Figure 131: Middle East & Africa Market Attractiveness Analysis by Mode of Operation
- Figure 132: Middle East & Africa Market Value Share and BPS Analysis by Application, 2025 and 2035
- Figure 133: Middle East & Africa Market Y-o-Y Growth Comparison by Application, 2025 to 2035
- Figure 134: Middle East & Africa Market Attractiveness Analysis by Application
- Figure 135: Middle East & Africa Market Value Share and BPS Analysis by End Use, 2025 and 2035
- Figure 136: Middle East & Africa Market Y-o-Y Growth Comparison by End Use, 2025 to 2035
- Figure 137: Middle East & Africa Market Attractiveness Analysis by End Use
- Figure 138: Middle East & Africa Market Value Share and BPS Analysis by Distribution Channel, 2025 and 2035
- Figure 139: Middle East & Africa Market Y-o-Y Growth Comparison by Distribution Channel, 2025 to 2035
- Figure 140: Middle East & Africa Market Attractiveness Analysis by Distribution Channel
- Figure 141: Global Market - Tier Structure Analysis
- Figure 142: Global Market - Company Share Analysis
- FAQs -
What was the global sewing machine market size reported by Fact.MR for 2025?
The global sewing machine market was valued at USD 3,750 million in 2025.
Who are the major players operating in the sewing machine market?
Prominent players in the market are Bernina, Brother, JACK Co. Ltd., Janome Co., Ltd., JUKI Corporation, MSISM Co. Ltd., PEGASUS Mfg Co. Ltd., among others.
What is the Estimated Valuation of the sewing machine market in 2035?
The market is expected to reach a valuation of USD 5,824 million in 2035.
What value CAGR did the Sewing machine market exhibit over the last five years?
The historic growth rate of the sewing machine market was 3.7% from 2020 to 2024.