


- Base Value(2024): 29.2 Bn
- Forecast Value (2035): 94.3 Bn
- CAGR (2035): 11.5%
Zero PCF Intermediates Market Outlook (2025 to 2035)
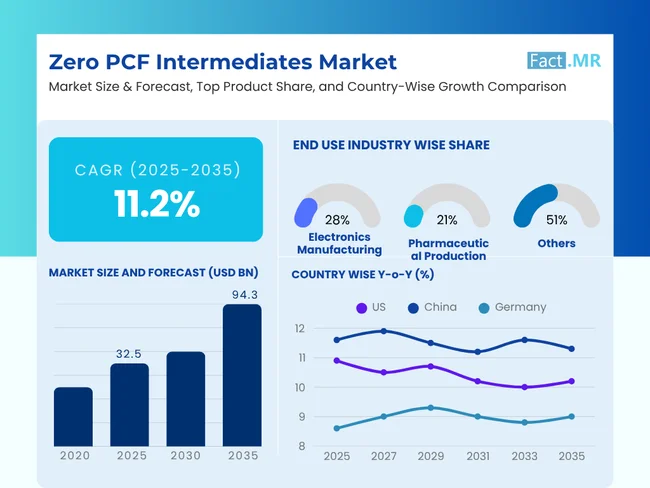
The global Zero PCF Intermediates Market was valued at USD 29.2 billion in 2024 and is expected to expand at a CAGR of 11.2% to reach USD 94.3 billion by 2035.
Zero-product carbon footprint (PCF) intermediates represent a game-changing move in the chemical industry. They are one of the responses to industry's desperate efforts to answer pressing climate change demands. These new carbon-neutral process-based intermediates come from renewable energy, bio-based feedstocks, and circular economy approaches.
The marketplace arose from growing corporate commitments to net-zero and rigorous environmental requirements for global supply chains. In the electronics, pharmaceutical, and automotive sectors, downstream industries are increasingly demanding more sustainable raw materials as these sectors expand. Through such investments, manufacturers are going to great lengths to develop new production methods that eliminate or offset carbon emissions throughout a product's entire lifecycle.
The market is marked by high research and development activity, with large chemical companies reformulating traditional intermediates to reach a zero carbon footprint. Advancements in green chemistry, biotechnology, and process optimization further facilitate this. Achieving carbon neutrality will require collaboration throughout the entire value chain, from raw material suppliers to end-users. The sector is inextricably linked with the overall sustainability trend and global decarbonization efforts.
- Between 2025 and 2035, the carbon-neutral chemical is expected to produce an absolute dollar opportunity of USD 24.7 billion.
- In 2025, the electronics manufacturing sector of the end-use industry holds a global market share of 28.4% in zero PCF Intermediates.
| Report Attributes | Details |
|---|---|
| Market Size (2024A) | USD 29.2 billion |
| Estimated Market Value (2025E) | USD 32.5 billion |
| Forecasted Market Value (2035F) | USD 94.3 billion |
| Global Market Growth Rate (2025 to 2035) | 11.2% CAGR |
| North America Market Share (2025E) | 32.7% |
| East Asia Market Growth Rate (2025 to 2035) | 11.4% CAGR |
| U.S. Market Growth Rate | 10.9% CAGR |
| Key Companies Profiled |
BASF SE; Arkema Group; Clariant AG; Dow Chemical Company; Evonik Industries; Lanxess AG; LyondellBasell Industries; Nouryon; Solvay SA; Wacker Chemie AG; Other market players |
Sales Analysis of Zero PCF Intermediates (2020 to 2024) vs. Market Forecasts (2025 to 2035)
The market for Zero PCF Intermediates is projected to grow at a rate of 10.5% from 2020 to 2024. By the end of 2024, it is expected to be valued at USD 29.2 billion, responding to increasing environmental regulations and growing corporate sustainability commitments. During the forecast period, market growth is expected to accelerate further as more industries transition toward carbon-neutral supply chains.
| Historical Report Attributes | Details |
|---|---|
| Market Size (2020A) | USD 18.8 billion |
| Market Size (2024A) | USD 29.2 billion |
| Historical CAGR (2019-2023) | 10.5% |
| Forecasted CAGR (2025-2035) | 11.2% |
- Short Term (2025-2028): The short-term landscape will be characterized by intense competition in process optimization and cost reduction. Market leaders will continue to focus on expanding their zero-carbon product portfolios while maintaining price competitiveness. Strategic partnerships with renewable energy providers and technology companies will become crucial.
- Medium Term (2028-2032): The medium-term outlook is expected to be a phase of market consolidation, during which successful technologies and processes will be standardized. Competition will shift toward value-added services and comprehensive carbon-neutral solutions. Companies will probably expand their vertical integration to ensure complete control over their carbon footprint.
- Long Term (2032-2035): The long-term competitive landscape is likely to be dominated by companies that successfully scale up their zero-carbon technologies. Advanced circular economy integration and total supply chain transparency will be the source of market differentiation. Breakthrough new entrants will threaten established companies with their revolutionary technology. Complete sustainability solutions, rather than products alone, will compete on these grounds.
According to Fact.MR, the Zero PCF Intermediates market size is valued at USD 32.5 billion in 2025. Demand is projected to rise at a CAGR of 11.2% through 2035 to reach USD 94.3 billion by the end of the forecast period (2025 to 2035).
Market Dynamics
What driving forces influence the demand for Zero PCF Intermediates?
Global Sustainability Regulations Drive Industries towards Zero-Carbon Chemical Intermediates Solutions
Environmental regulations implemented by major economies are a new mainstream driver for the Zero PCF intermediates market. Global governments have now initiated carbon pricing mechanisms, mandated emissions reporting, and requirements for sustainability disclosures. As a result, industries have begun to seek out carbon-neutral alternatives.
Companies will be required to demonstrate tangible evidence of reducing their carbon footprint; hence, zero PCF intermediates have become an effective solution for conformity and risk mitigation. The legal framework is becoming increasingly dynamic, with new obligations being introduced on a frequent basis; therefore, the market for these intermediaries is expected to be long-term. This regulatory push is complemented by voluntary corporate commitments to carbon neutrality, creating a robust market foundation.
The North America Zero PCF Intermediates Market in 2025 is estimated to be around USD 10.6 billion with a CAGR of 11.5%.
How does consumer demand for sustainability influence manufacturers' choices of zero-carbon materials and supply chains?
Consumer Demand for Sustainable Products Pushes Manufacturers to Adopt Zero-Carbon Materials
Increasing environmental awareness among consumers has created a significant market pull for products with a verified zero carbon footprint. Increasingly, end consumers are making purchasing decisions based on environmental impact, compelling manufacturers to re-evaluate their supply chain and material selection choices.
Companies find that sustainable products command premium prices and stronger brand loyalty, making the investment in zero-carbon materials a worthwhile endeavor. The trend is strongest among younger generations, who value environmental responsibility in their purchasing decisions. This consumer-driven demand has created a competitive advantage for companies that can demonstrate a genuine commitment to carbon neutrality through their material choices.
What are the primary constraints faced by the market competitors for Zero PCF Intermediates?
Challenges of Market Integration Are Obstacles to Widespread Adoption of Zero Carbon Footprint Solutions
Zero PCF Intermediates pose significant technological and operational integration challenges to current production systems. The production of these intermediates presents challenges for maintaining consistency in the quality of the final products, as the production process must be modified to accommodate these new materials. Changes in equipment, processes, and quality control systems necessitate significant shifts, which can lead to operational disruptions and implementation delays.
Global supply chains are highly complex, and achieving end-to-end carbon neutrality is very challenging, particularly when multiple suppliers are involved and different regional standards exist. This often results in longer implementation periods and higher upfront costs, leading some companies to forego the transition even when they are committed to sustainability.
Country-wise Insights
Country-wise Forecast CAGRs for the Zero PCF Intermediates Market
| Countries | CAGR |
|---|---|
| United States | 10.9% |
| Canada | 12.0% |
| China | 11.6% |
| Japan | 9.3% |
How is advanced manufacturing influencing the demand for Zero PCF Intermediates in the United States market?
U.S. Manufacturing Renaissance Drives Demand for Sustainable Chemical Intermediates Solutions
From 2025 to 2035, United States Zero PCF Intermediates is projected to expand at growth rate of 10.9%.
The United States is the largest market opportunity for Zero PCF Intermediates, driven by a combination of regulatory pressure, corporate sustainability commitments, and manufacturing reshoring trends. The Biden administration, with its attention to climate change and sustainable manufacturing, has produced a supportive policy environment.
Advanced research institutions and advanced manufacturing capabilities easily assimilate innovative zero-carbon technologies. Investments in renewable energy infrastructure can provide a solid foundation for the development of carbon-neutral production processes. Strong industry player collaboration between research institutions and government agencies can support the market and create an ecosystem that supports innovation and the adoption of zero-carbon solutions.
The United States market is projected to be valued at USD 6.7 billion by 2025, with a total absolute dollar opportunity worth USD 12.3 billion between 2025 and 2035.
-2025-to-2035.webp)
Why is China potentially a profitable market for manufacturers of Zero PCF Intermediates?
Industrial transformation in China provides a tremendous opportunity for Zero-Carbon chemical solutions.
The China market is expected to grow at a CAGR of 11.6%, during the projected period of 2025 to 2035.
China's policies for carbon neutrality and aggressive industrial modernization, the market potential of Zero PCF Intermediates in China is huge. This country boasts a massive manufacturing base, accompanied by a growing environmental consciousness, which offers high demand for green chemical intermediates. Supportive government policies, including preferential treatments and subsidies for green technologies, form an excellent market environment.
The scale of China's chemical industry offers tremendous opportunities for cost savings through economies of scale. Besides, investments in renewable energy and circular economy infrastructure support the development of zero-carbon production capabilities. Strong domestic innovation capabilities and a growing emphasis on environmental protection in industrial policy are also supportive of the market.
By 2035, the market for China Zero PCF Intermediates is projected to be worth USD 12.2 billion.
Category-wise Insights
How are carbon-neutral chemical intermediates transforming the Zero PCF Intermediates Market in advanced manufacturing?
Carbon-neutral Chemical Intermediate Market Through Sustainable Advanced Manufacturing
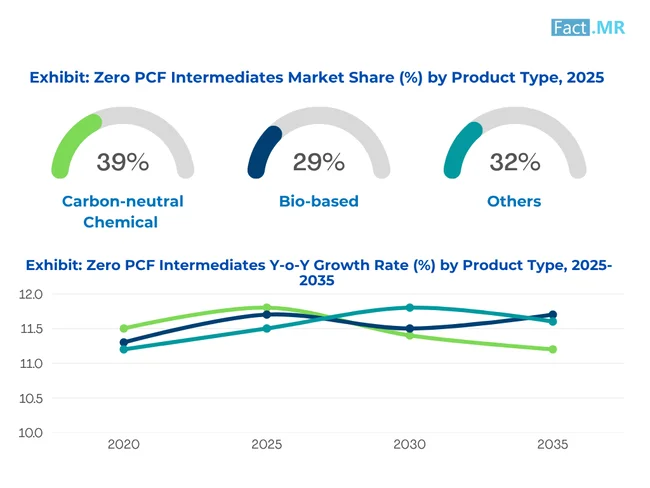
The market is driven by the use of the carbon-neutral chemical product segment, enabling a growth rate of 11.5% in 2035
Carbon-neutral chemical intermediates transform the chemical market, bringing both performance and environmental conscience closer together. Dominating the zero PCF market through advanced manufacturing methods, they do not leave any carbon residue while preserving product quality. Renewable energy sources are being put into high-cost investments for renewable energy integration.
Manufacturers are focusing heavily on carbon capture technologies and are also improving process optimization to realize true carbon neutrality. Growth in the segment is driven by increasing demand from downstream industries looking to decarbonize their supply chains. Advanced catalysis and green chemistry principles are enabling the production of these intermediates at commercially viable scales, making them increasingly attractive to industries transitioning toward sustainable practices.
According to projections, the worldwide Carbon-neutral chemical product category is expected to generate a value of USD 12.6 billion by 2025.
How are electronics manufacturers achieving Zero PCF Intermediates through sustainable component production goals?
Electronics Manufacturing Drives Zero PCF Intermediates Adoption Through Sustainable Component Production Goals
The electronics manufacturing end-use industry segment is expected to hold a market share of 28.4% by the end of 2025.
The adoption of Zero PCF Intermediates is being led by the electronics manufacturing sector, driven by increasing consumer demand for environmentally responsible devices. Manufacturers are integrating these materials into their production processes to achieve carbon neutrality while maintaining the high-performance standards required in electronics.
Stringent environmental regulations and corporate sustainability commitments across the electronics industry support the segment's growth. Advanced manufacturing processes enable the accurate integration of zero-carbon intermediates into complex electronic components. Miniaturization and energy efficiency, which the industry focuses on, align with the innovative properties of these materials.
In 2025, the global Zero PCF intermediates market for the electronics manufacturing end-use industry segment is expected to generate a net worth of USD 9.2 billion.
Competitive Landscape
Key players in the Zero PCF intermediates industry are BASF SE, Arkema Group, Clariant AG, Dow Chemical Company, Evonik Industries, Lanxess AG, LyondellBasell Industries, Nouryon, Solvay SA, and Wacker Chemie AG.
Companies allocate a significant portion of their revenue to R&D to address problems and develop innovative solutions to attract new customers and remain competitive. Companies are developing customized offerings that address industry-specific needs to compete with other players.
- In March 2024, BASF SE launched a new zero-carbon chemical intermediates production line at its Ludwigshafen site, utilizing renewable energy and bio-based feedstocks. The facility incorporates advanced carbon capture technology and principles of the circular economy to achieve complete carbon neutrality.
- In November 2023, Evonik Industries completed the acquisition of a green technology startup specializing in carbon-neutral chemical processing, thereby enhancing its portfolio of zero PCF intermediates.
Methodology and Industry Tracking Approach
In 2025, Fact.MR conducted a comprehensive global analysis of the Zero PCF (Product Carbon Footprint) Intermediates Market, sourcing insights from over 2,500 industry-validated professionals across 22 countries. Participants represented sectors such as green chemistry intermediates, net-zero specialty chemical manufacturing, bio-based industrial feedstocks, and global sustainability certification and compliance. Each country in the study incorporated contributions from a minimum of 75 experts involved in modeling Scope 1 and Scope 3 emissions, designing carbon-neutral processes, and integrating mass balance and blockchain tracking protocols.
Between June 2024 and May 2025, the research captured critical global transitions: commercialization of drop-in zero-PCF aromatic intermediates, the debut of electro-catalyzed olefin systems for fine chemicals, and widespread implementation of cradle-to-gate carbon accounting standards across Europe, Asia, and the Americas. Accelerated demand was noted for decarbonized surfactant precursors, PCF-neutral solvents used in pharma and agrochemical formulations, and carbon-negative polymer building blocks for packaging, textiles, and automotive coatings.
Historically, until 2018, Fact.MR monitored the low-carbon intermediates landscape through analysis of energy intensity, GHG equivalence metrics, and adoption of waste valorization techniques. The latest research highlights the sector’s definitive shift toward net-zero validation frameworks, audit-ready supply chains, and material innovations built on CO₂ sequestration strategies. The category’s current definition now reflects a high-performance identity anchored in carbon-neutral lifecycle documentation, digital emissions traceability, and scalability of fossil-free intermediate pathways.
Fact.MR has provided detailed information about the price points of key manufacturers of Zero PCF Intermediates, positioned across various regions, including sales growth, production capacity, and speculative technological expansion, in the recently published report.
Segmentation of Zero PCF Intermediates Market
-
By Product Type :
- Carbon-neutral Chemical
- Bio-based
- Recycled Content Intermediates
- Green Process Intermediates
-
By End-Use Industry :
- Electronics Manufacturing
- Pharmaceutical Production
- Agrochemicals
- Automotive Components
- Construction Materials
- Packaging Industry
- Textile Processing
-
By Region :
- North America
- Latin America
- Western Europe
- Eastern Europe
- East Asia
- South Asia & Pacific
- Middle East & Africa
- Frequently Asked Questions -
Which product type holds a leading share of the Zero PCF Intermediates in 2025?
In 2025, the Carbon-neutral chemical product type segment holds 38.7% market share.
What will be the sales value of Zero PCF Intermediates in 2035?
The global Zero PCF Intermediates Market is estimated to be valued at USD 94.3 billion in 2035.
Which region accounts for a leading market share?
North America is accounts for 32.7% share of the global market in 2025.
Who are the Major Players Operating in the Zero PCF Intermediates Market?
Prominent players in the market are BASF SE, Arkema Group and Clariant AG among others.
What will be the market size of the Zero PCF Intermediates Market for electronics manufacturing in end-use industry by 2035?
The electronics manufacturing end-use industry type sector in the global Zero PCF Intermediates Market is expected to reach a value of USD 27.8 billion by the end of 2035.
What is the Zero PCF Intermediates sales forecast for the wood preservation within the segment through 2035?
Sales of Wood Preservation in the Zero PCF Intermediates application segment is expected to rise at a notable CAGR of 11.2% through 2035.