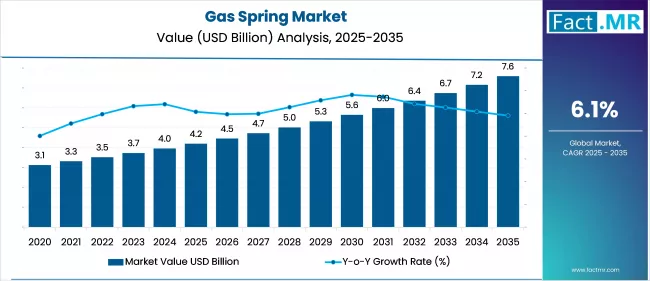
Gas Spring Market

Gas Spring Market Analysis, By Product, By Maximum Force, By Mounting Orientation, By Sales Channel, By Application, and Region - Market Insights 2025 to 2035

Analysis of Gas Spring Market Covering 30+ Countries Including Analysis of US, Canada, UK, Germany, France, Nordics, GCC countries, Japan, Korea and many more.

Gas Spring Market Outlook (2025 to 2035)

The global gas spring market is projected to increase from USD 4.2 billion in 2025 to USD 7.6 billion by 2035, with a CAGR of 6.1%, driven by rising demand for enhanced comfort and automation in automotive and ergonomic furniture applications. Their growth makes them ideal for use in vehicles, office chairs, and adjustable home furniture, where controlled motion and user convenience are essential.

Gas Spring Market

What are the Drivers of Gas Spring Market?

The growth of the gas spring market is driven by its expanding applications in the automotive industry, where these components are used for enhancing the convenience and safety of various vehicle operations. Gas springs are commonly integrated into car hoods, tailgates, trunk lids, and seats to provide controlled motion and ease of handling.

As global vehicle production continues to rise, particularly in emerging economies such as China, India, and Brazil, the demand for gas springs is increasing in proportion. Moreover, the growing preference for luxury and premium vehicles equipped with automated components and comfort-driven features is further fueling the market’s expansion.

Another major factor contributing to market growth is the rising demand for ergonomic and adjustable furniture in both commercial and residential sectors. The post-pandemic shift toward remote work has significantly accelerated the adoption of ergonomic office chairs, height-adjustable desks, and recliner systems that utilize gas springs for smooth and user-friendly operation. These springs allow precise motion control, making furniture more adaptable and efficient. Moreover, urbanization and the increasing need for space-saving, multifunctional furniture solutions in compact homes are reinforcing this trend.

The healthcare and medical equipment sector also plays a vital role in driving the gas spring market. Gas springs are widely used in hospital beds, stretchers, examination tables, wheelchairs, and dental chairs, offering essential support for controlled movement and safety. With the global aging population on the rise and increased healthcare spending in both developed and developing nations, there is a growing need for medical equipment that provides comfort and mobility to patients and caregivers alike. This trend is expected to sustain the demand for gas springs in the healthcare domain.

The market is being supported by advancements in material technology and industrial automation. Manufacturers are developing lightweight, corrosion-resistant gas springs with customizable force ratings to meet the specific needs of various industries. In industrial settings, gas springs are used in machinery, control panels, and safety enclosures to improve operator safety and machine efficiency.

As automation and smart manufacturing become more widespread, the integration of gas springs into industrial design is increasing. These technological improvements, along with the versatility and customization options of gas springs, are expanding their applications across various sectors, including aerospace, marine, and renewable energy, thereby driving market growth.

What are the Regional Trends of Gas Spring Market?

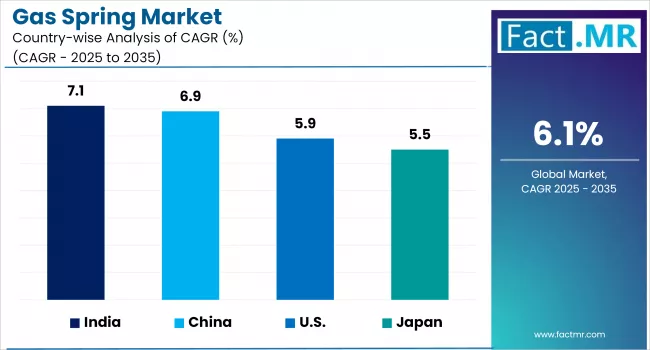
Asia Pacific holds the largest share of the global gas spring market and is also expected to grow at the fastest rate. This dominance is driven by rapid industrialization, booming automotive production, and increased manufacturing activities in countries like China, India, Japan, and South Korea. China, in particular, is a major contributor due to its extensive automotive and furniture manufacturing base.

Furthermore, rising urbanization, increasing demand for ergonomic office setups, and expanding healthcare infrastructure in the region are all contributing factors to the growing demand for gas springs.

The U.S. and Canada represent a significant portion of the gas spring market, characterized by consistent demand across automotive, industrial machinery, medical devices, and furniture sectors. The region benefits from high consumer awareness of ergonomics, robust manufacturing capabilities, and a focus on automation and worker safety.

Furthermore, the increasing adoption of adjustable and space-saving furniture in home and office settings is supporting the market. The presence of leading gas spring manufacturers and technology-driven customization further boosts North America’s competitive edge.

Europe is a well-established market for gas springs, supported by a strong presence of automotive OEMs in countries like Germany, France, Italy, and the U.K. The region emphasizes high-quality engineering, safety standards, and innovation, driving the demand for advanced gas spring systems, especially in vehicles and industrial equipment.

Moreover, the growing trend toward smart furniture and automation in office spaces further supports market growth in the region. Europe's mature healthcare sector also contributes to demand for gas springs in hospital beds, dental chairs, and related equipment.

The Middle East region is showing growing potential due to urbanization, improving economic conditions, and rising investments in healthcare and infrastructure. Increasing construction activities and healthcare reforms, particularly in the Gulf countries, are driving incremental demand for gas springs in furniture, medical applications, and industrial equipment.

What are the Challenges and Restraining Factors of Gas Spring Market?

One of the most significant challenges is the volatility in raw material prices, particularly for steel, aluminum, and nitrogen gas, which are core components in gas spring production. Price fluctuations in these materials directly impact manufacturing costs, particularly for small and mid-sized enterprises that operate on tight margins. This cost instability makes pricing strategies complex and can reduce overall profitability, discouraging market entry for new players and expansion for existing ones.

Another restraint is the presence of alternative technologies. In certain applications, hydraulic actuators, mechanical springs, or electric motion systems can offer more precision, force, or durability compared to gas springs.

These alternatives are often favored in industries that require heavy-duty performance or enhanced control, such as industrial automation and aerospace. The availability of such substitutes creates strong competition and limits the adoption of gas springs in more demanding or specialized applications.

Durability and maintenance concerns also pose a challenge. Despite advancements in material and seal technology, gas springs remain sealed units that are susceptible to issues such as gas leakage, pressure loss, or failure under extreme conditions.

In outdoor or industrial environments, exposure to high temperatures, moisture, or corrosive elements can shorten product lifespan. These reliability issues raise concerns in critical-use sectors, such as medical equipment or automotive safety components, where failure could lead to safety risks or operational downtime.

Limited awareness and technical understanding in emerging markets restrict broader adoption. In many developing countries, consumers and some industrial users continue to rely on conventional mechanical alternatives due to cost constraints or a lack of exposure to newer technologies, such as gas springs. This lack of market education, combined with cost sensitivity and limited local manufacturing, slows penetration in regions that could otherwise present significant growth opportunities.

Country-Wise Outlook

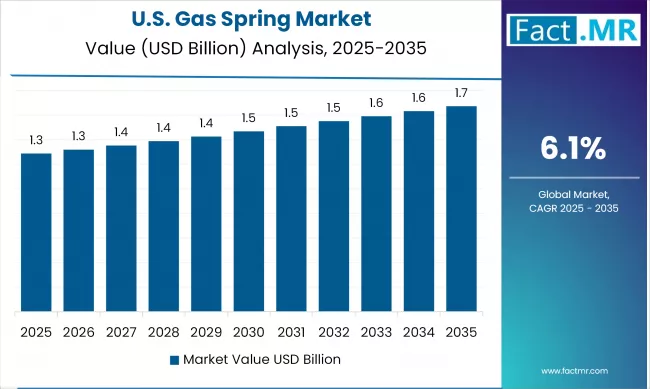
U.S. Gas Spring Market sees Growth Driven by Expansion of Automotive Industry

Gas Spring Market Cagr Analysis By Country

The growth of the gas spring market in the U.S. is driven by increasing demand across key sectors, including automotive, industrial machinery, aerospace, healthcare, and ergonomic furniture. The market benefits from the country’s well-established manufacturing infrastructure, strong emphasis on automation, and a high rate of technological adoption. As gas springs become integral to advanced systems offering smooth motion, load control, and safety, their adoption continues to rise in various precision-demanding applications.

The automotive industry is one of the primary drivers of market expansion in the U.S. Gas springs are commonly used in vehicle hoods, tailgates, trunk lids, and adjustable seating mechanisms. With consumers expecting greater comfort and automation in vehicles, gas springs offer a cost-effective and reliable solution. Moreover, the growth in electric and luxury vehicles is boosting the need for sophisticated support and damping systems, further contributing to market demand.

United States Gas Spring Market Country Value Analysis

The industrial and furniture sectors also contribute significantly to market growth. Gas springs are increasingly used in adjustable office furniture, height-adjustable desks, and ergonomic chairs, especially in the wake of the remote work trend that has reshaped workplace dynamics in the U.S. Industrial automation, safety compliance, and the need for efficient machine operations have also led to widespread use of gas springs in manufacturing environments, where they are used in machine hatches, safety guards, and control systems.

Moreover, sectors like aerospace and healthcare are providing new avenues for growth. In aerospace, gas springs are used in cabin storage compartments and maintenance equipment, due to their high strength-to-weight ratio and reliability. In healthcare, they are used in hospital beds, examination tables, and mobility devices to improve ease of use and safety. With ongoing technological advancements, including corrosion-resistant coatings and smart damping systems, the U.S. gas spring market is poised for robust and diversified growth across various industries.

China witnesses Rapid Market Growth Backed by a Growing Manufacturing Industry

The expansion of gas spring market is fueled by China’s position as a global manufacturing powerhouse. Industries such as automotive, electronics, aerospace, and heavy machinery are increasingly adopting nitrogen gas springs for their precision, compactness, and low-maintenance benefits. These springs are crucial in high-speed stamping, die cutting, and forming operations.

Driving this demand are large-scale investments in smart factories and broader industrial automation. Smart gas springs with real-time monitoring and fail-safe features are emerging trends, aligning with Industry 4.0 standards and reducing maintenance intervals. Furthermore, the ability to offer customized solutions enables gas spring suppliers to meet the specific needs of various applications across sectors such as medical devices and defense components.

China's manufacturing shift also supports growth in exports. With domestic suppliers earning international certifications and enhancing their capabilities, China now competes globally in the production of gas springs. Government support through industrial policies and automation-driven subsidies further boosts manufacturing upgrades, expanding both domestic and export-oriented demand. Moreover, recent infrastructure growth, increased focus on tooling and die innovation, and sustainability initiatives in design and recycling are contributing to market acceleration.

Japan sees Robust Manufacturing Base Fuels Demand for Gas Spring

Japan’s robust manufacturing base, especially in the automotive and industrial machinery sectors, underpins the growth of the gas spring market. Renowned Japanese OEMs are consistently integrating gas springs into engine compartments, hatches, and assembly equipment, promoting widespread domestic utilization.

The regional dynamic is fueled not only by automotive demand but also by the increasing use of industrial automation, healthcare equipment, and ergonomic furniture, where precision engineering and high-quality components are a priority.

Japan’s market growth will likely be propelled by emerging trends, such as smart gas springs integrated with sensors for real-time monitoring and predictive maintenance, which align with Industry 4.0 strategies. Additionally, there is an increasing demand for lightweight, corrosion-resistant materials, which are vital in sectors like aerospace and advanced manufacturing. With continued innovation and strict adherence to high-quality standards, Japan is expected to maintain steady, diversified growth in the gas spring market throughout the next decade.

Category-wise Analysis

Gas Springs to Exhibit Leading by Product

Gas Spring Market Analysis By Product

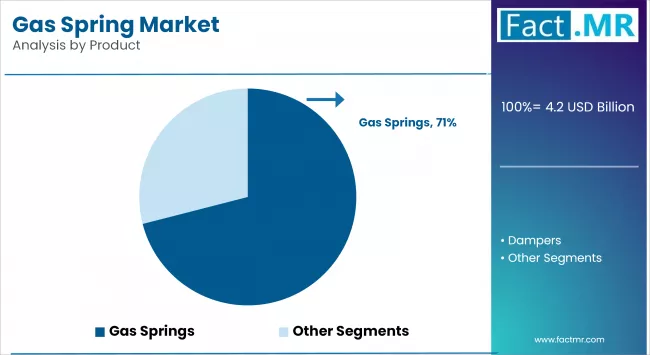
The gas springs segment dominates the market driven by their widespread application across industries such as automotive, furniture, healthcare, aerospace, and industrial machinery. Gas springs are extensively used in vehicle hoods, trunk lids, ergonomic chairs, hospital beds, and various machine components due to their ability to provide controlled motion, counterbalancing, and compact design. Their low maintenance requirements, reliability, and customizable load-bearing capacities make them a preferred choice in systems requiring repetitive and smooth opening or lifting operations.

Vertical to Exhibit Leading by Mounting Orientation

Gas Spring Market Analysis By Mounting Orientation

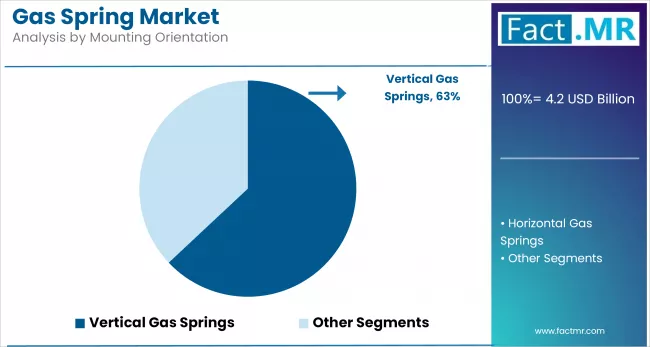
The horizontal gas springs segment dominates the market in terms of both revenue and deployment. This dominance is largely due to their wide usage in automotive applications, such as trunk lids, hatches, and tailgates, where horizontal installation provides optimal support and motion control.

Additionally, horizontal gas springs are widely used in industrial machinery, furniture mechanisms, and medical equipment, where space constraints and mechanical design favor the application of lateral forces. Their ability to provide stable support and smoother motion in load-bearing applications makes them ideal for systems that require frequent and controlled opening or closing at a horizontal angle.

The vertical gas springs segment is expected to witness the fastest growth driven by the rising adoption in ergonomic furniture, hospital beds, overhead cabinets, and vertical lift mechanisms, where vertical motion support is essential. As demand for space-efficient and user-friendly solutions grows in both residential and commercial environments, vertical gas springs are becoming increasingly important in furniture and interior systems. Furthermore, advancements in compact and adjustable vertical gas spring designs are encouraging their use in smart home systems and medical lift devices, further accelerating their growth potential.

Automotive to Exhibit Leading by Application

The automotive segment dominates the gas spring market and holds the largest market share among all application areas. Gas springs are integral to various automotive components such as tailgates, hoods, trunk lids, seats, and glove compartments, where they provide controlled motion, ease of use, and enhanced safety.

With the global increase in vehicle production and the growing consumer preference for comfort, convenience, and automated systems, demand for gas springs in this segment remains strong. Additionally, the trend toward electric and luxury vehicles with high-performance components further supports the dominance of the automotive sector.

The home & office equipment segment is expected to register the fastest growth rate driven by the rising demand for ergonomic furniture solutions, including adjustable chairs, sit-stand desks, and smart recliners, which use gas springs for height and position control. The surge in remote work and home office setups, particularly following the pandemic, has accelerated the need for comfortable and flexible furniture designs.

Moreover, increasing urbanization and space constraints are promoting the use of multifunctional and compact furniture, where gas springs enable smooth and safe transformation of structures, fueling growth in this application segment.

251 to 500 N to Exhibit Leading by Maximum Force

Gas springs with a force range of 251 to 500 N dominate the market due to their broad applicability across the automotive, aerospace, industrial machinery, and furniture sectors. These springs offer a balanced combination of strength and versatility, making them ideal for medium-load applications such as tailgates, hoods, and adjustable chairs. Their ability to deliver consistent force and smooth motion in diverse operating conditions drives strong demand across both OEM and aftermarket sectors.

Below 250 N gas springs are the fastest-growing segment, driven by the increasing adoption of these springs in lightweight applications and compact designs. Consumer electronics, home furnishings, and medical equipment are fueling this demand as manufacturers seek smaller, quieter, and more energy-efficient solutions. The trend toward ergonomic and user-friendly products is further accelerating growth in this segment, especially in adjustable workstations and lift-assist mechanisms for delicate or space-constrained environments.

OEMs to Exhibit Leading by Sales Channel

OEMs (Original Equipment Manufacturers) lead the gas springs market, accounting for the largest share due to their integration into new vehicle models, machinery, and industrial equipment. OEMs prefer customized, high-quality gas springs that meet precise technical specifications, ensuring seamless performance and durability. Strong partnerships between manufacturers and OEMs contribute to steady demand and continuous product innovation.

The aftermarket segment is growing at a faster pace, supported by rising maintenance and replacement activities in the automotive and industrial sectors. Consumers and service providers increasingly seek cost-effective, easy-to-install gas spring solutions for repairs and upgrades. The expansion of e-commerce platforms and improved product accessibility are further driving aftermarket growth, particularly in emerging markets and DIY-focused applications.

Competitive Analysis

The global gas spring market is becoming increasingly competitive, with a mix of multinational corporations and regional players competing across various application segments. Companies leverage decades of expertise in precision engineering to deliver high-performance, durable, and customizable gas springs for various sectors, including automotive, industrial automation, aerospace, furniture, and healthcare.

Product innovation and customization are central to competitive strategy. Manufacturers are increasingly offering gas springs tailored to specific load capacities, stroke lengths, mounting orientations, and environmental conditions. There is also a rising demand for smart gas springs, equipped with sensors for real-time monitoring and predictive maintenance. This technological evolution has become a key differentiator, enabling leading companies to meet the evolving performance expectations of OEMs and end users.

Another major strategic focus is geographic expansion and local production. Market leaders are establishing manufacturing facilities or distribution networks in high-growth regions, such as China, India, and Southeast Asia, to reduce costs and serve local markets more effectively. These regions offer a large customer base, rising industrialization, and increasing demand for ergonomic furniture, automotive parts, and medical equipment, all of which are strong end-use segments for gas springs. Local and regional players in these markets compete by offering cost-effective solutions and shorter lead times, intensifying the competitive dynamics.

Sustainability and compliance with international quality and environmental standards have become important competitive factors. Companies are investing in lightweight, recyclable, and corrosion-resistant gas spring materials to support sustainability goals, especially in the automotive and aerospace sectors. Overall, while global leaders hold a strong position due to brand reputation and advanced technology, the market remains open for regional players that can deliver specialized, flexible, and cost-efficient solutions tailored to specific applications.

Key players in the gas spring industry include Stabilus GmbH, Beijer Alma, Barnes Group, Suspa GmbH, BANSBACH EASYLIFT, Camloc, Dadco, Special Springs, DICTATOR Technik GmbH, Pascal Engineering, Tecapres, Showa Corporation, and other notable companies.

Recent Development

  • In April 2024, Stabilus SE finalized its acquisition of Destaco from Dover Corporation. This move significantly expanded Stabilus’s industrial automation offerings, integrating Destaco’s clamping and gripping technologies into its lineup.

Segmentation of Gas Spring Market

  • By Product :

    • Gas Springs
      • Lockable Gas Springs
      • Standard Gas Springs
    • Dampers
      • Hydraulic Gas Spring Dampers
      • Friction Gas Spring Dampers
  • By Maximum Force :

    • Below 250 N Gas Springs
    • 251 to 500 N Gas Springs
  • By Mounting Orientation :

    • Horizontal Gas Springs
    • Vertical Gas Springs
      • Vertical Rod Up Gas Springs
      • Vertical Rod Down Gas Springs
  • By Sales Channel :

    • OEM
    • Aftermarket
  • By Application :

    • Automotive
    • Aerospace, Marine & Rail
    • Home & Office Equipment
    • Industrial Machinery & Automation
    • Healthcare
    • Others
  • By Region :

    • North America
    • Latin America
    • Western Europe
    • Eastern Europe
    • East Asia
    • South Asia & Pacific
    • Middle East & Africa

Table of Content

  1. Executive Summary
    • Global Market Outlook
    • Demand-side Trends
    • Supply-side Trends
    • Technology Roadmap Analysis
    • Analysis and Recommendations
  2. Market Overview
    • Market Coverage / Taxonomy
    • Market Definition / Scope / Limitations
  3. Market Background
    • Market Dynamics
      • Drivers
      • Restraints
      • Opportunity
      • Trends
    • Scenario Forecast
      • Demand in Optimistic Scenario
      • Demand in Likely Scenario
      • Demand in Conservative Scenario
    • Opportunity Map Analysis
    • Product Life Cycle Analysis
    • Supply Chain Analysis
      • Supply Side Participants and their Roles
        • Producers
        • Mid-Level Participants (Traders/ Agents/ Brokers)
        • Wholesalers and Distributors
      • Value Added and Value Created at Node in the Supply Chain
      • List of Component Suppliers
      • List of Existing and Potential Buyers
    • Investment Feasibility Matrix
    • Value Chain Analysis
      • Profit Margin Analysis
      • Wholesalers and Distributors
    • PESTLE and Porter’s Analysis
    • Regulatory Landscape
      • By Key Regions
      • By Key Countries
    • Production and Consumption Statistics
    • Import and Export Statistics
  4. Global Market Analysis 2020 to 2024 and Forecast, 2025 to 2035
    • Historical Market Size Value (USD Bn) & Volume (Units) Analysis, 2020 to 2024
    • Current and Future Market Size Value (USD Bn) & Volume (Units) Projections, 2025 to 2035
      • Y-o-Y Growth Trend Analysis
      • Absolute $ Opportunity Analysis
  5. Global Market Pricing Analysis 2020 to 2024 and Forecast 2025 to 2035
  6. Global Market Analysis 2020 to 2024 and Forecast 2025 to 2035, By Product
    • Introduction / Key Findings
    • Historical Market Size Value (USD Bn) & Volume (Units) Analysis By Product, 2020 to 2024
    • Current and Future Market Size Value (USD Bn) & Volume (Units) Analysis and Forecast By Product, 2025 to 2035
      • Gas Springs
        • Lockable Gas Springs
        • Standard Gas Springs
      • Dampers
        • Hydraulic Dampers
        • Friction Dampers
    • Y-o-Y Growth Trend Analysis By Product, 2020 to 2024
    • Absolute $ Opportunity Analysis By Product, 2025 to 2035
  7. Global Market Analysis 2020 to 2024 and Forecast 2025 to 2035, By Maximum Force
    • Introduction / Key Findings
    • Historical Market Size Value (USD Bn) & Volume (Units) Analysis By Maximum Force, 2020 to 2024
    • Current and Future Market Size Value (USD Bn) & Volume (Units) Analysis and Forecast By Maximum Force, 2025 to 2035
      • Below 250 N Gas Springs
      • 251 to 500 N Gas Springs
    • Y-o-Y Growth Trend Analysis By Maximum Force, 2020 to 2024
    • Absolute $ Opportunity Analysis By Maximum Force, 2025 to 2035
  8. Global Market Analysis 2020 to 2024 and Forecast 2025 to 2035, By Mounting Orientation
    • Introduction / Key Findings
    • Historical Market Size Value (USD Bn) & Volume (Units) Analysis By Mounting Orientation, 2020 to 2024
    • Current and Future Market Size Value (USD Bn) & Volume (Units) Analysis and Forecast By Mounting Orientation, 2025 to 2035
      • Horizontal Gas Springs
      • Vertical Gas Springs
        • Vertical Rod Up Gas Springs
        • Vertical Rod Down Gas Springs
    • Y-o-Y Growth Trend Analysis By Mounting Orientation, 2020 to 2024
    • Absolute $ Opportunity Analysis By Mounting Orientation, 2025 to 2035
  9. Global Market Analysis 2020 to 2024 and Forecast 2025 to 2035, By Sales Channel
    • Introduction / Key Findings
    • Historical Market Size Value (USD Bn) & Volume (Units) Analysis By Sales Channel, 2020 to 2024
    • Current and Future Market Size Value (USD Bn) & Volume (Units) Analysis and Forecast By Sales Channel, 2025 to 2035
      • OEM
      • Aftermarket
    • Y-o-Y Growth Trend Analysis By Sales Channel, 2020 to 2024
    • Absolute $ Opportunity Analysis By Sales Channel, 2025 to 2035
  10. Global Market Analysis 2020 to 2024 and Forecast 2025 to 2035, By Application
    • Introduction / Key Findings
    • Historical Market Size Value (USD Bn) & Volume (Units) Analysis By Application, 2020 to 2024
    • Current and Future Market Size Value (USD Bn) & Volume (Units) Analysis and Forecast By Application, 2025 to 2035
      • Automotive
      • Aerospace, Marine & Rail
      • Home & Office Equipment
      • Industrial Machinery & Automation
      • Healthcare
      • Others
    • Y-o-Y Growth Trend Analysis By Application, 2020 to 2024
    • Absolute $ Opportunity Analysis By Application, 2025 to 2035
  11. Global Market Analysis 2020 to 2024 and Forecast 2025 to 2035, By Region
    • Introduction
    • Historical Market Size Value (USD Bn) & Volume (Units) Analysis By Region, 2020 to 2024
    • Current Market Size Value (USD Bn) & Volume (Units) Analysis and Forecast By Region, 2025 to 2035
      • North America
      • Latin America
      • Western Europe
      • East Asia
      • South Asia Pacific
      • Eastern Europe
      • Middle East & Africa
    • Market Attractiveness Analysis By Region
  12. North America Market Analysis 2020 to 2024 and Forecast 2025 to 2035, By Country
    • Historical Market Size Value (USD Bn) & Volume (Units) Trend Analysis By Market Taxonomy, 2020 to 2024
    • Market Size Value (USD Bn) & Volume (Units) Forecast By Market Taxonomy, 2025 to 2035
      • By Country
        • U.S.
        • Canada
        • Mexico
      • By Product
      • By Maximum Force
      • By Mounting Orientation
      • By Sales Channel
      • By Application
    • Market Attractiveness Analysis
      • By Country
      • By Product
      • By Maximum Force
      • By Mounting Orientation
      • By Sales Channel
      • By Application
    • Key Takeaways
  13. Latin America Market Analysis 2020 to 2024 and Forecast 2025 to 2035, By Country
    • Historical Market Size Value (USD Bn) & Volume (Units) Trend Analysis By Market Taxonomy, 2020 to 2024
    • Market Size Value (USD Bn) & Volume (Units) Forecast By Market Taxonomy, 2025 to 2035
      • By Country
        • Brazil
        • Chile
        • Rest of Latin America
      • By Product
      • By Maximum Force
      • By Mounting Orientation
      • By Sales Channel
      • By Application
    • Market Attractiveness Analysis
      • By Country
      • By Product
      • By Maximum Force
      • By Mounting Orientation
      • By Sales Channel
      • By Application
    • Key Takeaways
  14. Western Europe Market Analysis 2020 to 2024 and Forecast 2025 to 2035, By Country
    • Historical Market Size Value (USD Bn) & Volume (Units) Trend Analysis By Market Taxonomy, 2020 to 2024
    • Market Size Value (USD Bn) & Volume (Units) Forecast By Market Taxonomy, 2025 to 2035
      • By Country
        • Germany
        • Italy
        • France
        • U.K.
        • Spain
        • Russia
        • BENELUX
        • Rest of Europe
      • By Product
      • By Maximum Force
      • By Mounting Orientation
      • By Sales Channel
      • By Application
    • Market Attractiveness Analysis
      • By Country
      • By Product
      • By Maximum Force
      • By Mounting Orientation
      • By Sales Channel
      • By Application
    • Key Takeaways
  15. East Asia Market Analysis 2020 to 2024 and Forecast 2025 to 2035, By Country
    • Historical Market Size Value (USD Bn) & Volume (Units) Trend Analysis By Market Taxonomy, 2020 to 2024
    • Market Size Value (USD Bn) & Volume (Units) Forecast By Market Taxonomy, 2025 to 2035
      • By Country
        • China
        • Japan
        • South Korea
      • By Product
      • By Maximum Force
      • By Mounting Orientation
      • By Sales Channel
      • By Application
    • Market Attractiveness Analysis
      • By Country
      • By Product
      • By Maximum Force
      • By Mounting Orientation
      • By Sales Channel
      • By Application
    • Key Takeaways
  16. South Asia Pacific Market Analysis 2020 to 2024 and Forecast 2025 to 2035, By Country
    • Historical Market Size Value (USD Bn) & Volume (Units) Trend Analysis By Market Taxonomy, 2020 to 2024
    • Market Size Value (USD Bn) & Volume (Units) Forecast By Market Taxonomy, 2025 to 2035
      • By Country
        • India
        • ASEAN Countries
        • Australia & New Zealand
        • Rest of South Asia Pacific
      • By Product
      • By Maximum Force
      • By Mounting Orientation
      • By Sales Channel
      • By Application
    • Market Attractiveness Analysis
      • By Country
      • By Product
      • By Maximum Force
      • By Mounting Orientation
      • By Sales Channel
      • By Application
    • Key Takeaways
  17. Eastern Europe Market Analysis 2020 to 2024 and Forecast 2025 to 2035, By Country
    • Historical Market Size Value (USD Bn) & Volume (Units) Trend Analysis By Market Taxonomy, 2020 to 2024
    • Market Size Value (USD Bn) & Volume (Units) Forecast By Market Taxonomy, 2025 to 2035
      • By Country
        • Russia
        • Poland
        • Hungary
        • Balkan & Baltics
        • Rest of Eastern Europe
      • By Product
      • By Maximum Force
      • By Mounting Orientation
      • By Sales Channel
      • By Application
    • Market Attractiveness Analysis
      • By Country
      • By Product
      • By Maximum Force
      • By Mounting Orientation
      • By Sales Channel
      • By Application
    • Key Takeaways
  18. Middle East & Africa Market Analysis 2020 to 2024 and Forecast 2025 to 2035, By Country
    • Historical Market Size Value (USD Bn) & Volume (Units) Trend Analysis By Market Taxonomy, 2020 to 2024
    • Market Size Value (USD Bn) & Volume (Units) Forecast By Market Taxonomy, 2025 to 2035
      • By Country
        • KSA
        • Other GCC Countries
        • Turkiye
        • South Africa
        • Rest of MEA
      • By Product
      • By Maximum Force
      • By Mounting Orientation
      • By Sales Channel
      • By Application
    • Market Attractiveness Analysis
      • By Country
      • By Product
      • By Maximum Force
      • By Mounting Orientation
      • By Sales Channel
      • By Application
    • Key Takeaways
  19. Key Countries Market Analysis
    • Germany
      • Pricing Analysis
      • Market Share Analysis, 2024
        • By Product
        • By Maximum Force
        • By Mounting Orientation
        • By Sales Channel
        • By Application
    • United States
      • Pricing Analysis
      • Market Share Analysis, 2024
        • By Product
        • By Maximum Force
        • By Mounting Orientation
        • By Sales Channel
        • By Application
    • China
      • Pricing Analysis
      • Market Share Analysis, 2024
        • By Product
        • By Maximum Force
        • By Mounting Orientation
        • By Sales Channel
        • By Application
    • Japan
      • Pricing Analysis
      • Market Share Analysis, 2024
        • By Product
        • By Maximum Force
        • By Mounting Orientation
        • By Sales Channel
        • By Application
    • South Korea
      • Pricing Analysis
      • Market Share Analysis, 2024
        • By Product
        • By Maximum Force
        • By Mounting Orientation
        • By Sales Channel
        • By Application
  20. Market Structure Analysis
    • Competition Dashboard
    • Competition Benchmarking
    • Market Share Analysis of Top Players
      • By Regional
      • By Product
      • By Maximum Force
      • By Mounting Orientation
      • By Sales Channel
      • By Application
  21. Competition Analysis
    • Competition Deep Dive
      • Stabilus GmbH
        • Overview
        • Product Portfolio
        • Profitability by Market Segments (Product/Age /Sales Channel/Region)
        • Sales Footprint
        • Strategy Overview
          • Marketing Strategy
          • Product Strategy
          • Channel Strategy
      • Beijer Alma
        • Overview
        • Product Portfolio
        • Profitability by Market Segments (Product/Age /Sales Channel/Region)
        • Sales Footprint
        • Strategy Overview
          • Marketing Strategy
          • Product Strategy
          • Channel Strategy
      • Barnes Group
        • Overview
        • Product Portfolio
        • Profitability by Market Segments (Product/Age /Sales Channel/Region)
        • Sales Footprint
        • Strategy Overview
          • Marketing Strategy
          • Product Strategy
          • Channel Strategy
      • Suspa GmbH
        • Overview
        • Product Portfolio
        • Profitability by Market Segments (Product/Age /Sales Channel/Region)
        • Sales Footprint
        • Strategy Overview
          • Marketing Strategy
          • Product Strategy
          • Channel Strategy
      • BANSBACH EASYLIFT
        • Overview
        • Product Portfolio
        • Profitability by Market Segments (Product/Age /Sales Channel/Region)
        • Sales Footprint
        • Strategy Overview
          • Marketing Strategy
          • Product Strategy
          • Channel Strategy
      • Camloc
        • Overview
        • Product Portfolio
        • Profitability by Market Segments (Product/Age /Sales Channel/Region)
        • Sales Footprint
        • Strategy Overview
          • Marketing Strategy
          • Product Strategy
          • Channel Strategy
      • Dadco
        • Overview
        • Product Portfolio
        • Profitability by Market Segments (Product/Age /Sales Channel/Region)
        • Sales Footprint
        • Strategy Overview
          • Marketing Strategy
          • Product Strategy
          • Channel Strategy
      • Special Springs
        • Overview
        • Product Portfolio
        • Profitability by Market Segments (Product/Age /Sales Channel/Region)
        • Sales Footprint
        • Strategy Overview
          • Marketing Strategy
          • Product Strategy
          • Channel Strategy
      • DICTATOR Technik GmbH
        • Overview
        • Product Portfolio
        • Profitability by Market Segments (Product/Age /Sales Channel/Region)
        • Sales Footprint
        • Strategy Overview
          • Marketing Strategy
          • Product Strategy
          • Channel Strategy
      • Pascal Engineering
        • Overview
        • Product Portfolio
        • Profitability by Market Segments (Product/Age /Sales Channel/Region)
        • Sales Footprint
        • Strategy Overview
          • Marketing Strategy
          • Product Strategy
          • Channel Strategy
      • Tecapres
        • Overview
        • Product Portfolio
        • Profitability by Market Segments (Product/Age /Sales Channel/Region)
        • Sales Footprint
        • Strategy Overview
          • Marketing Strategy
          • Product Strategy
          • Channel Strategy
      • Showa Corporation
        • Overview
        • Product Portfolio
        • Profitability by Market Segments (Product/Age /Sales Channel/Region)
        • Sales Footprint
        • Strategy Overview
          • Marketing Strategy
          • Product Strategy
          • Channel Strategy
  22. Assumptions & Acronyms Used
  23. Research Methodology

List Of Table

  • Table 1: Global Market Value (USD Bn) Forecast by Region, 2020 to 2035
  • Table 2: Global Market Volume (Units) Forecast by Region, 2020 to 2035
  • Table 3: Global Market Value (USD Bn) Forecast by Product, 2020 to 2035
  • Table 4: Global Market Volume (Units) Forecast by Product, 2020 to 2035
  • Table 5: Global Market Value (USD Bn) Forecast by Maximum Force, 2020 to 2035
  • Table 6: Global Market Volume (Units) Forecast by Maximum Force, 2020 to 2035
  • Table 7: Global Market Value (USD Bn) Forecast by Mounting Orientation, 2020 to 2035
  • Table 8: Global Market Volume (Units) Forecast by Mounting Orientation, 2020 to 2035
  • Table 9: Global Market Value (USD Bn) Forecast by Sales Channel, 2020 to 2035
  • Table 10: Global Market Volume (Units) Forecast by Sales Channel, 2020 to 2035
  • Table 11: Global Market Value (USD Bn) Forecast by Application, 2020 to 2035
  • Table 12: Global Market Volume (Units) Forecast by Application, 2020 to 2035
  • Table 13: North America Market Value (USD Bn) Forecast by Country, 2020 to 2035
  • Table 14: North America Market Volume (Units) Forecast by Country, 2020 to 2035
  • Table 15: North America Market Value (USD Bn) Forecast by Product, 2020 to 2035
  • Table 16: North America Market Volume (Units) Forecast by Product, 2020 to 2035
  • Table 17: North America Market Value (USD Bn) Forecast by Maximum Force, 2020 to 2035
  • Table 18: North America Market Volume (Units) Forecast by Maximum Force, 2020 to 2035
  • Table 19: North America Market Value (USD Bn) Forecast by Mounting Orientation, 2020 to 2035
  • Table 20: North America Market Volume (Units) Forecast by Mounting Orientation, 2020 to 2035
  • Table 21: North America Market Value (USD Bn) Forecast by Sales Channel, 2020 to 2035
  • Table 22: North America Market Volume (Units) Forecast by Sales Channel, 2020 to 2035
  • Table 23: North America Market Value (USD Bn) Forecast by Application, 2020 to 2035
  • Table 24: North America Market Volume (Units) Forecast by Application, 2020 to 2035
  • Table 25: Latin America Market Value (USD Bn) Forecast by Country, 2020 to 2035
  • Table 26: Latin America Market Volume (Units) Forecast by Country, 2020 to 2035
  • Table 27: Latin America Market Value (USD Bn) Forecast by Product, 2020 to 2035
  • Table 28: Latin America Market Volume (Units) Forecast by Product, 2020 to 2035
  • Table 29: Latin America Market Value (USD Bn) Forecast by Maximum Force, 2020 to 2035
  • Table 30: Latin America Market Volume (Units) Forecast by Maximum Force, 2020 to 2035
  • Table 31: Latin America Market Value (USD Bn) Forecast by Mounting Orientation, 2020 to 2035
  • Table 32: Latin America Market Volume (Units) Forecast by Mounting Orientation, 2020 to 2035
  • Table 33: Latin America Market Value (USD Bn) Forecast by Sales Channel, 2020 to 2035
  • Table 34: Latin America Market Volume (Units) Forecast by Sales Channel, 2020 to 2035
  • Table 35: Latin America Market Value (USD Bn) Forecast by Application, 2020 to 2035
  • Table 36: Latin America Market Volume (Units) Forecast by Application, 2020 to 2035
  • Table 37: Western Europe Market Value (USD Bn) Forecast by Country, 2020 to 2035
  • Table 38: Western Europe Market Volume (Units) Forecast by Country, 2020 to 2035
  • Table 39: Western Europe Market Value (USD Bn) Forecast by Product, 2020 to 2035
  • Table 40: Western Europe Market Volume (Units) Forecast by Product, 2020 to 2035
  • Table 41: Western Europe Market Value (USD Bn) Forecast by Maximum Force, 2020 to 2035
  • Table 42: Western Europe Market Volume (Units) Forecast by Maximum Force, 2020 to 2035
  • Table 43: Western Europe Market Value (USD Bn) Forecast by Mounting Orientation, 2020 to 2035
  • Table 44: Western Europe Market Volume (Units) Forecast by Mounting Orientation, 2020 to 2035
  • Table 45: Western Europe Market Value (USD Bn) Forecast by Sales Channel, 2020 to 2035
  • Table 46: Western Europe Market Volume (Units) Forecast by Sales Channel, 2020 to 2035
  • Table 47: Western Europe Market Value (USD Bn) Forecast by Application, 2020 to 2035
  • Table 48: Western Europe Market Volume (Units) Forecast by Application, 2020 to 2035
  • Table 49: East Asia Market Value (USD Bn) Forecast by Country, 2020 to 2035
  • Table 50: East Asia Market Volume (Units) Forecast by Country, 2020 to 2035
  • Table 51: East Asia Market Value (USD Bn) Forecast by Product, 2020 to 2035
  • Table 52: East Asia Market Volume (Units) Forecast by Product, 2020 to 2035
  • Table 53: East Asia Market Value (USD Bn) Forecast by Maximum Force, 2020 to 2035
  • Table 54: East Asia Market Volume (Units) Forecast by Maximum Force, 2020 to 2035
  • Table 55: East Asia Market Value (USD Bn) Forecast by Mounting Orientation, 2020 to 2035
  • Table 56: East Asia Market Volume (Units) Forecast by Mounting Orientation, 2020 to 2035
  • Table 57: East Asia Market Value (USD Bn) Forecast by Sales Channel, 2020 to 2035
  • Table 58: East Asia Market Volume (Units) Forecast by Sales Channel, 2020 to 2035
  • Table 59: East Asia Market Value (USD Bn) Forecast by Application, 2020 to 2035
  • Table 60: East Asia Market Volume (Units) Forecast by Application, 2020 to 2035
  • Table 61: South Asia Pacific Market Value (USD Bn) Forecast by Country, 2020 to 2035
  • Table 62: South Asia Pacific Market Volume (Units) Forecast by Country, 2020 to 2035
  • Table 63: South Asia Pacific Market Value (USD Bn) Forecast by Product, 2020 to 2035
  • Table 64: South Asia Pacific Market Volume (Units) Forecast by Product, 2020 to 2035
  • Table 65: South Asia Pacific Market Value (USD Bn) Forecast by Maximum Force, 2020 to 2035
  • Table 66: South Asia Pacific Market Volume (Units) Forecast by Maximum Force, 2020 to 2035
  • Table 67: South Asia Pacific Market Value (USD Bn) Forecast by Mounting Orientation, 2020 to 2035
  • Table 68: South Asia Pacific Market Volume (Units) Forecast by Mounting Orientation, 2020 to 2035
  • Table 69: South Asia Pacific Market Value (USD Bn) Forecast by Sales Channel, 2020 to 2035
  • Table 70: South Asia Pacific Market Volume (Units) Forecast by Sales Channel, 2020 to 2035
  • Table 71: South Asia Pacific Market Value (USD Bn) Forecast by Application, 2020 to 2035
  • Table 72: South Asia Pacific Market Volume (Units) Forecast by Application, 2020 to 2035
  • Table 73: Eastern Europe Market Value (USD Bn) Forecast by Country, 2020 to 2035
  • Table 74: Eastern Europe Market Volume (Units) Forecast by Country, 2020 to 2035
  • Table 75: Eastern Europe Market Value (USD Bn) Forecast by Product, 2020 to 2035
  • Table 76: Eastern Europe Market Volume (Units) Forecast by Product, 2020 to 2035
  • Table 77: Eastern Europe Market Value (USD Bn) Forecast by Maximum Force, 2020 to 2035
  • Table 78: Eastern Europe Market Volume (Units) Forecast by Maximum Force, 2020 to 2035
  • Table 79: Eastern Europe Market Value (USD Bn) Forecast by Mounting Orientation, 2020 to 2035
  • Table 80: Eastern Europe Market Volume (Units) Forecast by Mounting Orientation, 2020 to 2035
  • Table 81: Eastern Europe Market Value (USD Bn) Forecast by Sales Channel, 2020 to 2035
  • Table 82: Eastern Europe Market Volume (Units) Forecast by Sales Channel, 2020 to 2035
  • Table 83: Eastern Europe Market Value (USD Bn) Forecast by Application, 2020 to 2035
  • Table 84: Eastern Europe Market Volume (Units) Forecast by Application, 2020 to 2035
  • Table 85: Middle East & Africa Market Value (USD Bn) Forecast by Country, 2020 to 2035
  • Table 86: Middle East & Africa Market Volume (Units) Forecast by Country, 2020 to 2035
  • Table 87: Middle East & Africa Market Value (USD Bn) Forecast by Product, 2020 to 2035
  • Table 88: Middle East & Africa Market Volume (Units) Forecast by Product, 2020 to 2035
  • Table 89: Middle East & Africa Market Value (USD Bn) Forecast by Maximum Force, 2020 to 2035
  • Table 90: Middle East & Africa Market Volume (Units) Forecast by Maximum Force, 2020 to 2035
  • Table 91: Middle East & Africa Market Value (USD Bn) Forecast by Mounting Orientation, 2020 to 2035
  • Table 92: Middle East & Africa Market Volume (Units) Forecast by Mounting Orientation, 2020 to 2035
  • Table 93: Middle East & Africa Market Value (USD Bn) Forecast by Sales Channel, 2020 to 2035
  • Table 94: Middle East & Africa Market Volume (Units) Forecast by Sales Channel, 2020 to 2035
  • Table 95: Middle East & Africa Market Value (USD Bn) Forecast by Application, 2020 to 2035
  • Table 96: Middle East & Africa Market Volume (Units) Forecast by Application, 2020 to 2035

List Of Figures

  • Figure 1: Global Market Volume (Units) Forecast 2020 to 2035
  • Figure 2: Global Market Pricing Analysis
  • Figure 3: Global Market Value (USD Bn) Forecast 2020 to 2035
  • Figure 4: Global Market Value Share and BPS Analysis by Product, 2025 and 2035
  • Figure 5: Global Market Y-o-Y Growth Comparison by Product, 2025 to 2035
  • Figure 6: Global Market Attractiveness Analysis by Product
  • Figure 7: Global Market Value Share and BPS Analysis by Maximum Force, 2025 and 2035
  • Figure 8: Global Market Y-o-Y Growth Comparison by Maximum Force, 2025 to 2035
  • Figure 9: Global Market Attractiveness Analysis by Maximum Force
  • Figure 10: Global Market Value Share and BPS Analysis by Mounting Orientation, 2025 and 2035
  • Figure 11: Global Market Y-o-Y Growth Comparison by Mounting Orientation, 2025 to 2035
  • Figure 12: Global Market Attractiveness Analysis by Mounting Orientation
  • Figure 13: Global Market Value Share and BPS Analysis by Sales Channel, 2025 and 2035
  • Figure 14: Global Market Y-o-Y Growth Comparison by Sales Channel, 2025 to 2035
  • Figure 15: Global Market Attractiveness Analysis by Sales Channel
  • Figure 16: Global Market Value Share and BPS Analysis by Application, 2025 and 2035
  • Figure 17: Global Market Y-o-Y Growth Comparison by Application, 2025 to 2035
  • Figure 18: Global Market Attractiveness Analysis by Application
  • Figure 19: Global Market Value (USD Bn) Share and BPS Analysis by Region, 2025 and 2035
  • Figure 20: Global Market Y-o-Y Growth Comparison by Region, 2025 to 2035
  • Figure 21: Global Market Attractiveness Analysis by Region
  • Figure 22: North America Market Incremental $ Opportunity, 2025 to 2035
  • Figure 23: Latin America Market Incremental $ Opportunity, 2025 to 2035
  • Figure 24: Western Europe Market Incremental $ Opportunity, 2025 to 2035
  • Figure 25: East Asia Market Incremental $ Opportunity, 2025 to 2035
  • Figure 26: South Asia Pacific Market Incremental $ Opportunity, 2025 to 2035
  • Figure 27: Eastern Europe Market Incremental $ Opportunity, 2025 to 2035
  • Figure 28: Middle East & Africa Market Incremental $ Opportunity, 2025 to 2035
  • Figure 29: North America Market Value Share and BPS Analysis by Country, 2025 and 2035
  • Figure 30: North America Market Value Share and BPS Analysis by Product, 2025 and 2035
  • Figure 31: North America Market Y-o-Y Growth Comparison by Product, 2025 to 2035
  • Figure 32: North America Market Attractiveness Analysis by Product
  • Figure 33: North America Market Value Share and BPS Analysis by Maximum Force, 2025 and 2035
  • Figure 34: North America Market Y-o-Y Growth Comparison by Maximum Force, 2025 to 2035
  • Figure 35: North America Market Attractiveness Analysis by Maximum Force
  • Figure 36: North America Market Value Share and BPS Analysis by Mounting Orientation, 2025 and 2035
  • Figure 37: North America Market Y-o-Y Growth Comparison by Mounting Orientation, 2025 to 2035
  • Figure 38: North America Market Attractiveness Analysis by Mounting Orientation
  • Figure 39: North America Market Value Share and BPS Analysis by Sales Channel, 2025 and 2035
  • Figure 40: North America Market Y-o-Y Growth Comparison by Sales Channel, 2025 to 2035
  • Figure 41: North America Market Attractiveness Analysis by Sales Channel
  • Figure 42: North America Market Value Share and BPS Analysis by Application, 2025 and 2035
  • Figure 43: North America Market Y-o-Y Growth Comparison by Application, 2025 to 2035
  • Figure 44: North America Market Attractiveness Analysis by Application
  • Figure 45: Latin America Market Value Share and BPS Analysis by Country, 2025 and 2035
  • Figure 46: Latin America Market Value Share and BPS Analysis by Product, 2025 and 2035
  • Figure 47: Latin America Market Y-o-Y Growth Comparison by Product, 2025 to 2035
  • Figure 48: Latin America Market Attractiveness Analysis by Product
  • Figure 49: Latin America Market Value Share and BPS Analysis by Maximum Force, 2025 and 2035
  • Figure 50: Latin America Market Y-o-Y Growth Comparison by Maximum Force, 2025 to 2035
  • Figure 51: Latin America Market Attractiveness Analysis by Maximum Force
  • Figure 52: Latin America Market Value Share and BPS Analysis by Mounting Orientation, 2025 and 2035
  • Figure 53: Latin America Market Y-o-Y Growth Comparison by Mounting Orientation, 2025 to 2035
  • Figure 54: Latin America Market Attractiveness Analysis by Mounting Orientation
  • Figure 55: Latin America Market Value Share and BPS Analysis by Sales Channel, 2025 and 2035
  • Figure 56: Latin America Market Y-o-Y Growth Comparison by Sales Channel, 2025 to 2035
  • Figure 57: Latin America Market Attractiveness Analysis by Sales Channel
  • Figure 58: Latin America Market Value Share and BPS Analysis by Application, 2025 and 2035
  • Figure 59: Latin America Market Y-o-Y Growth Comparison by Application, 2025 to 2035
  • Figure 60: Latin America Market Attractiveness Analysis by Application
  • Figure 61: Western Europe Market Value Share and BPS Analysis by Country, 2025 and 2035
  • Figure 62: Western Europe Market Value Share and BPS Analysis by Product, 2025 and 2035
  • Figure 63: Western Europe Market Y-o-Y Growth Comparison by Product, 2025 to 2035
  • Figure 64: Western Europe Market Attractiveness Analysis by Product
  • Figure 65: Western Europe Market Value Share and BPS Analysis by Maximum Force, 2025 and 2035
  • Figure 66: Western Europe Market Y-o-Y Growth Comparison by Maximum Force, 2025 to 2035
  • Figure 67: Western Europe Market Attractiveness Analysis by Maximum Force
  • Figure 68: Western Europe Market Value Share and BPS Analysis by Mounting Orientation, 2025 and 2035
  • Figure 69: Western Europe Market Y-o-Y Growth Comparison by Mounting Orientation, 2025 to 2035
  • Figure 70: Western Europe Market Attractiveness Analysis by Mounting Orientation
  • Figure 71: Western Europe Market Value Share and BPS Analysis by Sales Channel, 2025 and 2035
  • Figure 72: Western Europe Market Y-o-Y Growth Comparison by Sales Channel, 2025 to 2035
  • Figure 73: Western Europe Market Attractiveness Analysis by Sales Channel
  • Figure 74: Western Europe Market Value Share and BPS Analysis by Application, 2025 and 2035
  • Figure 75: Western Europe Market Y-o-Y Growth Comparison by Application, 2025 to 2035
  • Figure 76: Western Europe Market Attractiveness Analysis by Application
  • Figure 77: East Asia Market Value Share and BPS Analysis by Country, 2025 and 2035
  • Figure 78: East Asia Market Value Share and BPS Analysis by Product, 2025 and 2035
  • Figure 79: East Asia Market Y-o-Y Growth Comparison by Product, 2025 to 2035
  • Figure 80: East Asia Market Attractiveness Analysis by Product
  • Figure 81: East Asia Market Value Share and BPS Analysis by Maximum Force, 2025 and 2035
  • Figure 82: East Asia Market Y-o-Y Growth Comparison by Maximum Force, 2025 to 2035
  • Figure 83: East Asia Market Attractiveness Analysis by Maximum Force
  • Figure 84: East Asia Market Value Share and BPS Analysis by Mounting Orientation, 2025 and 2035
  • Figure 85: East Asia Market Y-o-Y Growth Comparison by Mounting Orientation, 2025 to 2035
  • Figure 86: East Asia Market Attractiveness Analysis by Mounting Orientation
  • Figure 87: East Asia Market Value Share and BPS Analysis by Sales Channel, 2025 and 2035
  • Figure 88: East Asia Market Y-o-Y Growth Comparison by Sales Channel, 2025 to 2035
  • Figure 89: East Asia Market Attractiveness Analysis by Sales Channel
  • Figure 90: East Asia Market Value Share and BPS Analysis by Application, 2025 and 2035
  • Figure 91: East Asia Market Y-o-Y Growth Comparison by Application, 2025 to 2035
  • Figure 92: East Asia Market Attractiveness Analysis by Application
  • Figure 93: South Asia Pacific Market Value Share and BPS Analysis by Country, 2025 and 2035
  • Figure 94: South Asia Pacific Market Value Share and BPS Analysis by Product, 2025 and 2035
  • Figure 95: South Asia Pacific Market Y-o-Y Growth Comparison by Product, 2025 to 2035
  • Figure 96: South Asia Pacific Market Attractiveness Analysis by Product
  • Figure 97: South Asia Pacific Market Value Share and BPS Analysis by Maximum Force, 2025 and 2035
  • Figure 98: South Asia Pacific Market Y-o-Y Growth Comparison by Maximum Force, 2025 to 2035
  • Figure 99: South Asia Pacific Market Attractiveness Analysis by Maximum Force
  • Figure 100: South Asia Pacific Market Value Share and BPS Analysis by Mounting Orientation, 2025 and 2035
  • Figure 101: South Asia Pacific Market Y-o-Y Growth Comparison by Mounting Orientation, 2025 to 2035
  • Figure 102: South Asia Pacific Market Attractiveness Analysis by Mounting Orientation
  • Figure 103: South Asia Pacific Market Value Share and BPS Analysis by Sales Channel, 2025 and 2035
  • Figure 104: South Asia Pacific Market Y-o-Y Growth Comparison by Sales Channel, 2025 to 2035
  • Figure 105: South Asia Pacific Market Attractiveness Analysis by Sales Channel
  • Figure 106: South Asia Pacific Market Value Share and BPS Analysis by Application, 2025 and 2035
  • Figure 107: South Asia Pacific Market Y-o-Y Growth Comparison by Application, 2025 to 2035
  • Figure 108: South Asia Pacific Market Attractiveness Analysis by Application
  • Figure 109: Eastern Europe Market Value Share and BPS Analysis by Country, 2025 and 2035
  • Figure 110: Eastern Europe Market Value Share and BPS Analysis by Product, 2025 and 2035
  • Figure 111: Eastern Europe Market Y-o-Y Growth Comparison by Product, 2025 to 2035
  • Figure 112: Eastern Europe Market Attractiveness Analysis by Product
  • Figure 113: Eastern Europe Market Value Share and BPS Analysis by Maximum Force, 2025 and 2035
  • Figure 114: Eastern Europe Market Y-o-Y Growth Comparison by Maximum Force, 2025 to 2035
  • Figure 115: Eastern Europe Market Attractiveness Analysis by Maximum Force
  • Figure 116: Eastern Europe Market Value Share and BPS Analysis by Mounting Orientation, 2025 and 2035
  • Figure 117: Eastern Europe Market Y-o-Y Growth Comparison by Mounting Orientation, 2025 to 2035
  • Figure 118: Eastern Europe Market Attractiveness Analysis by Mounting Orientation
  • Figure 119: Eastern Europe Market Value Share and BPS Analysis by Sales Channel, 2025 and 2035
  • Figure 120: Eastern Europe Market Y-o-Y Growth Comparison by Sales Channel, 2025 to 2035
  • Figure 121: Eastern Europe Market Attractiveness Analysis by Sales Channel
  • Figure 122: Eastern Europe Market Value Share and BPS Analysis by Application, 2025 and 2035
  • Figure 123: Eastern Europe Market Y-o-Y Growth Comparison by Application, 2025 to 2035
  • Figure 124: Eastern Europe Market Attractiveness Analysis by Application
  • Figure 125: Middle East & Africa Market Value Share and BPS Analysis by Country, 2025 and 2035
  • Figure 126: Middle East & Africa Market Value Share and BPS Analysis by Product, 2025 and 2035
  • Figure 127: Middle East & Africa Market Y-o-Y Growth Comparison by Product, 2025 to 2035
  • Figure 128: Middle East & Africa Market Attractiveness Analysis by Product
  • Figure 129: Middle East & Africa Market Value Share and BPS Analysis by Maximum Force, 2025 and 2035
  • Figure 130: Middle East & Africa Market Y-o-Y Growth Comparison by Maximum Force, 2025 to 2035
  • Figure 131: Middle East & Africa Market Attractiveness Analysis by Maximum Force
  • Figure 132: Middle East & Africa Market Value Share and BPS Analysis by Mounting Orientation, 2025 and 2035
  • Figure 133: Middle East & Africa Market Y-o-Y Growth Comparison by Mounting Orientation, 2025 to 2035
  • Figure 134: Middle East & Africa Market Attractiveness Analysis by Mounting Orientation
  • Figure 135: Middle East & Africa Market Value Share and BPS Analysis by Sales Channel, 2025 and 2035
  • Figure 136: Middle East & Africa Market Y-o-Y Growth Comparison by Sales Channel, 2025 to 2035
  • Figure 137: Middle East & Africa Market Attractiveness Analysis by Sales Channel
  • Figure 138: Middle East & Africa Market Value Share and BPS Analysis by Application, 2025 and 2035
  • Figure 139: Middle East & Africa Market Y-o-Y Growth Comparison by Application, 2025 to 2035
  • Figure 140: Middle East & Africa Market Attractiveness Analysis by Application
  • Figure 141: Global Market - Tier Structure Analysis
  • Figure 142: Global Market - Company Share Analysis

- FAQs -

What is the Global Gas Spring Market size in 2025?

The gas spring market is valued at USD 4.2 billion in 2025.

Who are the Major Players Operating in the Gas Spring Market?

Prominent players in the market include Stabilus GmbH, Beijer Alma, Barnes Group, Suspa GmbH, and BANSBACH EASYLIFT.

What is the Estimated Valuation of the Gas Spring Market by 2035?

The market is expected to reach a valuation of USD 7.6 billion by 2035.

What value CAGR is the Gas Spring Market Exhibit Over the Last Five Years?

The growth rate of the gas spring market is 5.5% from 2020 to 2024.

- Also of Interest -

Gas Detection Equipment Market

Gas Detection Equipment Market Analysis, By Type, By End-Use Industry, By Communication Type, By Gas Type, By Sensor Technology, and Region - Market Insights 2025 to 2035

Gas Cylinder Market

Gas Cylinder Market is Segmented By Cylinder Type, By Wrap Type, By Size, and By Gas Type & Region- Global Forecast 2025 to 2035

Gas and Liquid Flow Management Systems Market

Gas and Liquid Flow Management Systems Market Analysis, By Product Type (Flow Meters, Pumps, Control Valves, Linear Valves, Rotary Valves, Calibration Systems, and others), By End Use Industry, By Media Type, and Region - Market Insights 2025 to 2035

Gas Pressure Regulator Market

Gas Pressure Regulator Market Study by Single-stage and Double-stage for Oil & Gas, Medical, Automotive, Manufacturing, Residential & Commercial, Mining, and Water Treatment From 2024 to 2034

Gas Spring Market

Schedule a Call