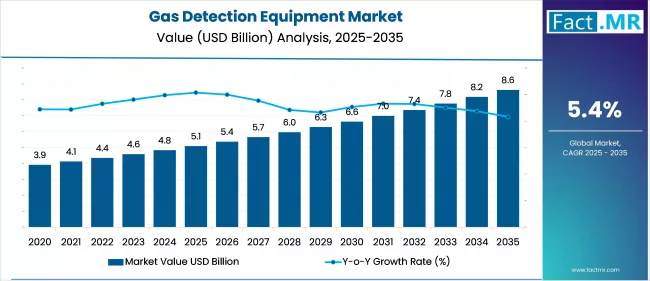
Gas Detection Equipment Market

Gas Detection Equipment Market Analysis, By Type, By End-Use Industry, By Communication Type, By Gas Type, By Sensor Technology, and Region - Market Insights 2025 to 2035

Analysis of Gas Detection Equipment Market Covering 30+ Countries Including analysis of US, Canada, UK, Germany, France, Nordics, GCC countries, Japan, Korea and many more.

Gas Detection Equipment Market Outlook (2025 to 2035)

The global gas detection equipment market is projected to increase from USD 5.1 billion in 2025 to USD 8.6 billion by 2035, with a CAGR of 5.4% during the forecast period. Growth is driven by rising industrialization and the expansion of hazardous workplaces. Stringent government safety regulations are compelling industries to adopt advanced gas detection systems.

Gas Detection Equipment Market

What are the Drivers of Gas Detection Equipment Market?

The gas detection equipment market is witnessing robust growth, primarily driven by stringent regulatory frameworks and heightened safety standards across industrial sectors. Governments and regulatory bodies such as OSHA, ATEX, and the European Commission have enforced strict guidelines mandating the use of gas detection systems in facilities handling toxic, flammable, or oxygen-depleting gases.

These regulations are particularly rigorous in sectors such as oil & gas, chemicals, and mining, where worker safety and accident prevention are of critical importance. The increasing frequency of gas-related industrial incidents has further emphasized the importance of such equipment, prompting organizations to adopt it early to ensure compliance and avoid operational liabilities.

Technological advancements are playing a transformative role in the evolution of gas detection equipment. Innovations such as laser-based sensors, infrared spectroscopy, and wireless, IoT-enabled devices are enhancing the precision, durability, and connectivity of gas detectors.

Integration with smart systems and cloud-based platforms enables real-time data collection, predictive maintenance, and remote monitoring, making the systems more intelligent and efficient. These advancements not only improve safety outcomes but also reduce downtime and operational costs, making them attractive investments for industries undergoing digital transformation.

Growing environmental concerns and global efforts to reduce greenhouse gas emissions are accelerating the adoption of gas detection systems. Industries are under pressure to monitor emissions and leaks of harmful gases, such as methane and carbon dioxide, from both regulatory and sustainability perspectives.

The demand for continuous emissions monitoring, especially in power plants, refineries, and landfill sites, is creating new market opportunities. Combined with the expansion of smart infrastructure and smart cities, where gas monitoring is integrated into building management systems, the gas detection equipment market is poised for sustained growth in the coming years.

What are the Regional Trends of Gas Detection Equipment Market?

The North American gas detection equipment market is characterized by its maturity, regulatory stringency, and high technological adoption. The U.S. and Canada have established comprehensive safety frameworks led by organizations such as OSHA, NFPA, and EPA, which mandate the use of gas detection systems in hazardous environments. Industries such as oil & gas, chemicals, and manufacturing dominate demand, especially for both fixed and portable detectors.

Moreover, the region is a leader in integrating smart technologies, such as wireless connectivity, IoT, and AI, into gas monitoring systems, enabling real-time detection and predictive maintenance. This advanced technological landscape continues to strengthen North America's global market position.

In Europe, the market is driven by stringent environmental and occupational safety regulations enforced by entities such as the European Union under ATEX, REACH, and the Industrial Emissions Directive (IED). Countries like Germany, the U.K., France, and the Netherlands have a strong focus on minimizing workplace hazards and reducing industrial emissions.

European industries are among the early adopters of cutting-edge gas detection technologies, particularly in sectors such as energy, wastewater management, and manufacturing. With rising awareness of carbon neutrality and climate commitments, the region is also experiencing a growing demand for emission monitoring equipment to track gases such as methane and CO₂, which further stimulates market growth.

Asia Pacific region is emerging as the fastest-growing market due to its rapid industrialization, expanding energy infrastructure, and increasing emphasis on worker safety. Major economies such as China, India, Japan, and South Korea are experiencing strong growth in process industries, construction, and urban infrastructure, all of which necessitate effective gas detection solutions.

Although regulatory enforcement varies across countries, increasing government focus on workplace safety and environmental protection is improving adoption rates. Moreover, the region is witnessing growing interest in portable and wireless gas detectors, especially in confined spaces and construction zones, as industries modernize and safety awareness increases.

In the Middle East, the gas detection market is developing steadily, fueled primarily by the oil & gas, mining, and utility sectors. In the Middle East, countries such as Saudi Arabia, the UAE, and Qatar are investing in petrochemical and energy infrastructure, where fixed and portable detectors are crucial for leak detection and worker safety.

What are the Challenges and Restraining Factors of Gas Detection Equipment Market?

One of the primary restraints is the high upfront cost of advanced gas detection systems. Sophisticated equipment, especially that with smart features such as real-time monitoring, wireless connectivity, and multi-gas detection, can be prohibitively expensive for small and medium-sized enterprises (SMEs) to adopt. Additionally, ongoing maintenance, calibration, and sensor replacement costs can further strain operational budgets, particularly in price-sensitive markets. This cost barrier often leads to delayed or partial implementation, particularly in developing regions.

Another major restraint is the lack of uniform regulatory enforcement in developing economies. While developed countries have well-established occupational health and safety regulations mandating gas detection systems in hazardous environments, many developing nations either lack such regulations or fail to enforce them effectively.

This leads to inconsistent adoption across industries, despite the presence of similar risks. In some regions, limited awareness of gas hazards and insufficient government oversight result in industries not prioritizing the installation of gas detection equipment, thereby slowing market penetration.

Technical challenges also pose significant obstacles to market growth. Despite improvements in sensor technologies, gas detection systems can suffer from false alarms, sensor drift, or failure under extreme environmental conditions such as high humidity, corrosive atmospheres, or fluctuating temperatures. These limitations may reduce the reliability of detection systems in critical situations. Additionally, the complexity of integrating these systems into existing industrial automation and monitoring platforms can deter end-users who lack the necessary technical expertise or resources for customization.

A shortage of skilled personnel trained to install, operate, and maintain gas detection equipment is a persistent issue, especially in emerging markets. Without adequate training, workers may misinterpret warnings, neglect necessary maintenance, or misuse the devices, compromising safety and reducing the effectiveness of the investment. This skills gap can limit the widespread deployment and long-term performance of gas detection systems.

Country-Wise Outlook

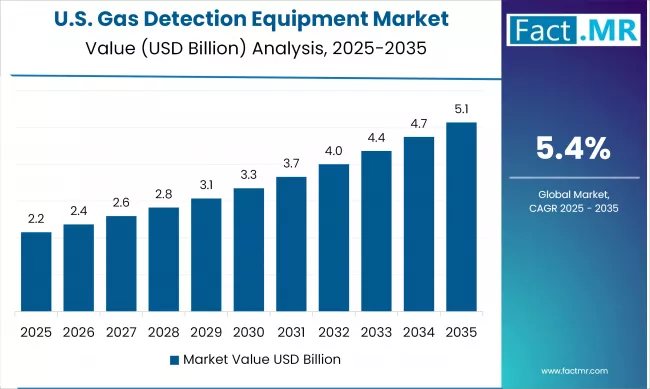
U.S. Gas Detection Equipment Market sees Growth Driven by Strict Regulatory Environment

Gas Detection Equipment Market Cagr Analysis By Country

The gas detection equipment market in the U.S. is experiencing strong and consistent growth, driven by a combination of strict regulatory compliance, technological innovation, and rising industrial safety demands. Federal regulations from agencies such as the Occupational Safety and Health Administration (OSHA), the Environmental Protection Agency (EPA), and the Department of Energy are key in enforcing the use of gas detection systems across hazardous work environments.

One of the main driving factors is the strict regulatory environment. U.S. industries, particularly those in oil & gas, chemical processing, and mining, are required to implement comprehensive gas monitoring systems to detect hazardous gases such as methane, carbon monoxide, hydrogen sulfide, and VOCs.

In 2023 and 2024, government-led initiatives focusing on methane leak detection and emissions monitoring have gained traction, encouraging further adoption of advanced detection technologies. These include funding for energy infrastructure upgrades, as well as policy mandates aligned with the Biden administration's climate goals, pushing industries to prioritize emission control and workplace safety.

United States Gas Detection Equipment Market Value Analysis

Another critical growth factor is the rapid adoption of portable and smart gas detection devices. Portable gas detectors are the fastest-growing product category in the U.S., driven by the need for flexible and real-time monitoring in confined spaces, remote worksites, and emergency response scenarios.

The integration of IoT, wireless connectivity, and AI-based analytics in these devices enables predictive maintenance and real-time alerts, which improve safety and operational efficiency. Moreover, advances in semiconductor-based and electrochemical sensor technologies are making gas detectors more reliable, durable, and responsive, further boosting the gas detection equipment market.

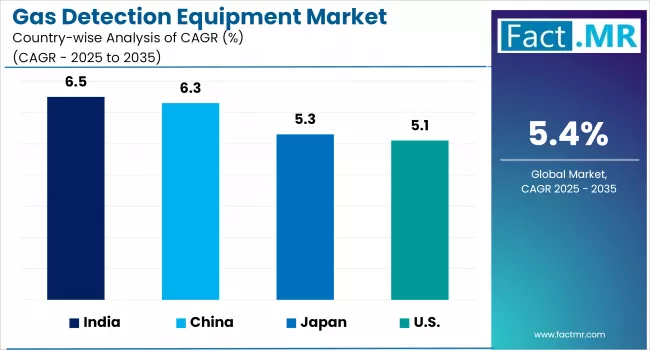
China witnesses Rapid Market Growth Backed by Rapid Industrialization

China’s gas detection equipment market is expanding faster, driven by strong industrial growth and rising safety standards. The key driver behind this growth is the rapid industrialization and infrastructure development, particularly in the energy, chemicals, and construction sectors.

China’s push for modernization in petrochemical plants, LNG terminals, and heavy industries has created persistent demand for advanced gas monitoring technologies. Moreover, government-led industrial safety initiatives, including the 2014 Work Safety Law and emissions control plans, have increased mandatory usage of gas detection systems in high-risk environments.

Another pivotal factor is technological innovation and local manufacturing momentum. Chinese and international OEMs are forging partnerships to introduce IoT-enabled, AI-powered detectors tailored for domestic applications. Players such as Teledyne, Siemens, Honeywell, ABB, and local firms are launching cost-effective, purpose-built solutions that comply with global standards, supporting both large-scale plants and SME requirements.

Environmental and ESG pressures are driving organizations to enhance their monitoring of greenhouse and toxic emissions. As China prioritizes cleaner air under its national policies, continuous emissions monitoring systems (CEMS) and methane leak detection equipment are being increasingly implemented in industrial sites. Consequently, demand extends beyond traditional workplace safety to encompass environmental compliance, reinforcing the market’s double-digit growth trajectory.

Japan sees Precision Manufacturing Fuels Demand for Ultra-Pure Piping

The growth of the gas detection market in Japan is driven by stringent workplace safety and environmental regulations enforced by Japanese authorities. Regulatory bodies require gas monitoring in industries such as oil & gas, chemicals, and manufacturing, ensuring compliance with national safety standards. Rising awareness of indoor air quality and emissions has increased adoption in healthcare, residential spaces, and smart building applications. This regulatory and environmental impetus is encouraging companies to invest in reliable detection technologies.

Technological innovation is also enabling market expansion. Japan’s advanced industrial ecosystem has fostered the development and deployment of IoT-enabled, wireless, and AI-integrated gas detection solutions. Local and global manufacturers, including ABB, Honeywell, and Siemens, are introducing sensor systems tailored for Japan’s high standards and operational needs. Furthermore, advancements in sensor technology, such as semiconductor and infrared sensors, offer higher accuracy, improved durability, and reduced maintenance, making adoption more viable for end-users.

Emerging demand in portable detectors complements fixed installations. With portable devices recognized as the fastest-growing segment, Japan’s workforce in sectors like construction, confined-space operations, and emergency response is increasingly relying on mobile monitoring. Combined with broader industrial automation trends and a focus on ESG compliance, the market is well-positioned for sustained double-digit growth through 2030.

Category-wise Analysis

Fixed Gas Detection Systems to Exhibit Leading by Type

Gas Detection Equipment Market Analysis By Type

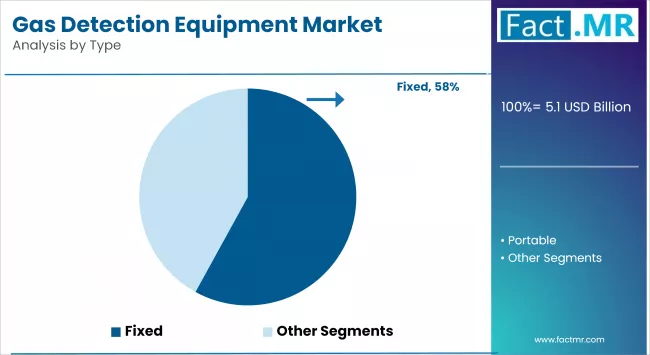
Fixed gas detection systems dominate the global gas detection equipment market, holding the largest revenue share. These systems are widely used in industrial facilities such as oil & gas plants, chemical manufacturing units, refineries, and wastewater treatment facilities, where continuous and real-time monitoring is critical for detecting hazardous gas leaks.

The dominance of fixed systems is primarily driven by their high reliability, ability to cover large areas, and integration with automated safety systems such as alarms, ventilation controls, and emergency shutdowns. Regulatory requirements across many countries also mandate the installation of fixed detectors in high-risk zones, reinforcing their widespread adoption.

Portable gas detectors are the fastest-growing segment driven by the increasing need for mobility, flexibility, and personal safety in field operations and confined spaces. Workers widely use portable detectors in various sectors, including construction, mining, firefighting, utilities, and emergency response, where fixed systems are not feasible. Technological advancements, including compact designs, multi-gas sensing capabilities, wireless connectivity, real-time data transmission, and integration with mobile apps, have significantly enhanced the usability and appeal of portable detectors.

Wired to Exhibit Leading by Communication Type

Gas Detection Equipment Market Analysis By Communication Type

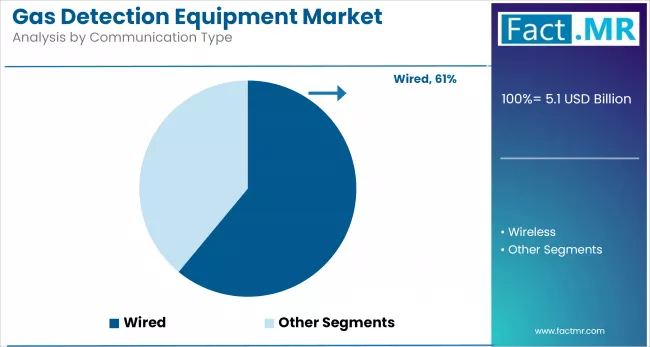
Wired communication systems hold the largest market share, driven by their reliability, minimal signal interference, and stable data transmission, especially in hazardous or industrial environments. These systems are preferred in legacy setups and large-scale facilities where infrastructure already supports physical wiring, providing consistent performance for monitoring and control applications over extended periods.

Wireless communication is the fastest-growing segment, driven by the need for flexible, scalable, and easy-to-install solutions. Advancements in IoT, along with decreasing costs of wireless technologies, are enabling real-time monitoring in remote or difficult-to-wire locations. Industries seeking digital transformation and reduced installation costs are increasingly turning to wireless systems for improved operational agility.

Oxygen Gas Detection to Exhibit Leading by Gas Type

The toxic gas detection segment currently dominates the gas detection equipment market. Strict occupational health and safety regulations and the high risk of exposure to toxic gases in industrial processes drive the dominance of this segment. Toxic gases are often colorless and odorless, posing serious health hazards even at low concentrations. As a result, industrial facilities are increasingly deploying fixed and portable toxic gas detectors to ensure real-time monitoring and compliance with safety standards, making this the most widely adopted gas type in the market.

The oxygen gas detection segment is expected to register the fastest growth over the forecast period. Oxygen detectors are crucial in environments where oxygen levels can either fall below safe thresholds (causing asphyxiation) or rise to dangerously high levels (increasing flammability risks).

This is particularly important in confined spaces, such as tunnels, tanks, and underground facilities, where oxygen depletion is a common concern. The increasing use of personal safety devices by workers, along with stricter safety protocols in industries such as pharmaceuticals, water treatment, food processing, and laboratory research, is driving the demand for oxygen monitoring equipment.

Electrochemical to Exhibit Leading by Sensor Technology

Electrochemical sensors dominate the sensor technology market due to their high sensitivity, selectivity, and suitability for detecting toxic gases such as CO and H₂S in industrial environments. These sensors are widely used across oil & gas, wastewater, and manufacturing industries for their accuracy, compact design, and lower power consumption, making them a reliable choice for continuous gas monitoring applications.

The infrared sensor segment is experiencing the fastest growth, propelled by its non-contact detection capabilities and durability in harsh conditions. Infrared sensors are being increasingly deployed in high-risk and explosive environments, particularly for detecting hydrocarbon gases. Their long lifespan, resistance to poisoning, and low maintenance requirements make them ideal for critical applications requiring dependable, real-time monitoring.

Oil & Gas to Exhibit Leading by End-Use

The oil & gas industry holds the dominant share in the gas detection equipment market. This segment’s leadership is driven by the inherently hazardous nature of oil and gas exploration, refining, and distribution processes, which involve the frequent handling of combustible and toxic gases such as methane (CH₄), hydrogen sulfide (H₂S), and volatile organic compounds (VOCs).

Strict safety regulations imposed by agencies like OSHA and API, along with increasing emphasis on leak detection and emissions monitoring, have compelled oil & gas companies to install both fixed and portable gas detectors across upstream, midstream, and downstream operations.

The water & wastewater industry is emerging as the fastest-growing end-use segment in the gas detection equipment market. This growth is largely attributed to the increasing need to monitor toxic gases, such as chlorine (Cl₂), hydrogen sulfide (H₂S), ammonia (NH₃), and methane (CH₄), during water treatment, sludge processing, and sewage handling. The sector is increasingly adopting gas detection systems to comply with environmental regulations and protect workers operating in confined spaces, such as sewers and tanks.

Competitive Analysis

The gas detection equipment market is becoming increasingly competitive, with a mix of global industry leaders and regional players competing on the basis of technology, product innovation, pricing, and service capabilities.

Technological innovation is a key differentiator in this market. Leading players are investing heavily in the development of smart, connected detection systems integrated with IoT, AI, real-time data analytics, and cloud platforms. These advancements enhance system reliability, facilitate remote monitoring, and minimize false alarms.

Companies are also focusing on miniaturized sensors, multi-gas detection capabilities, and enhanced battery life to meet the evolving needs of field personnel and mobile users. For example, MSA Safety has introduced Bluetooth-enabled portable detectors, while Honeywell offers wireless area monitoring systems and cloud-linked safety platforms.

Strategic partnerships, acquisitions, and geographic expansion are crucial to a company's competitive positioning. Firms are increasingly acquiring niche sensor manufacturers or software developers to expand their technological edge. For instance, Fortive (the parent company of Industrial Scientific) has been actively acquiring complementary safety and industrial automation businesses. Moreover, global players are targeting the Asia Pacific and Latin America for market expansion, leveraging regional partnerships to tap into fast-growing industries such as manufacturing, chemicals, and water treatment.

Regional players and emerging startups, particularly in Asia, are introducing cost-effective, localized solutions that are tailored to regional regulatory needs and pricing sensitivities. While they may lack the global reach of larger firms, these companies often compete effectively in price-sensitive markets by offering simpler, rugged designs and after-sales support. The competitive landscape is expected to become more dynamic as regulatory pressures, ESG goals, and industrial safety demands drive further innovation, collaboration, and consolidation across the sector.

Key players in the gas detection equipment industry are MSA Safety Incorporated, Opgal, Drägerwerk AG & Co. KGaA, Teledyne Technologies Inc., Emerson Electric Co., Halma plc, Honeywell International Inc., Danfoss A/S, Riken Keiki Co., Ltd., Sensidyne, LP, Testo SE & Co KGaA, Fortive Corporation, Inficon Holding AG, Trolex Ltd., ESP Safety Inc., and other players.

Recent Development

  • In June 2025, Teledyne Gas & Flame Detection released the PS DUO, a portable, ATEX/IECEx-certified device capable of simultaneously detecting two gases (e.g., CO + H₂S, NH₃ + SO₂). Its ergonomic, rugged design and two-year battery life target field workers in high-risk industrial environments.
  • In May 2025, Honeywell introduced a Thermal Conductivity-based Hydrogen Leak Detector capable of detecting leaks as small as 50 ppm. The sensor operates without recalibration for up to 10 years, marking a major leap in efficiency and hydrogen safety.

Segmentation of Gas Detection Equipment Market

  • By Type :

    • Fixed
    • Portable
  • By End-Use Industry :

    • Oil & Gas
    • Government & Military
    • Manufacturing
    • Chemicals & Petrochemicals
    • Water & Wastewater
    • Metal & Mining
    • Utilities
  • By Communication Type :

    • Wired
    • Wireless
  • By Gas Type :

    • Combustible
    • Toxic
    • Oxygen
    • Dedicated
  • By Sensor Technology :

    • Electrochemical
    • Infrared
    • Metal Oxide
    • Catalytic
    • Zirconia
  • By Region :

    • North America
    • Latin America
    • Western Europe
    • Eastern Europe
    • East Asia
    • South Asia & Pacific
    • Middle East & Africa

Table of Content

  1. Executive Summary
    • Global Market Outlook
    • Demand-side Trends
    • Supply-side Trends
    • Technology Roadmap Analysis
    • Analysis and Recommendations
  2. Market Overview
    • Market Coverage / Taxonomy
    • Market Definition / Scope / Limitations
  3. Market Background
    • Market Dynamics
      • Drivers
      • Restraints
      • Opportunity
      • Trends
    • Scenario Forecast
      • Demand in Optimistic Scenario
      • Demand in Likely Scenario
      • Demand in Conservative Scenario
    • Opportunity Map Analysis
    • Product Life Cycle Analysis
    • Supply Chain Analysis
      • Supply Side Participants and their Roles
        • Producers
        • Mid-Level Participants (Traders/ Agents/ Brokers)
        • Wholesalers and Distributors
      • Value Added and Value Created at Node in the Supply Chain
      • List of Component Suppliers
      • List of Existing and Potential Buyers
    • Investment Feasibility Matrix
    • Value Chain Analysis
      • Profit Margin Analysis
      • Wholesalers and Distributors
    • PESTLE and Porter’s Analysis
    • Regulatory Landscape
      • By Key Regions
      • By Key Countries
    • Production and Consumption Statistics
    • Import and Export Statistics
  4. Global Market Analysis 2020 to 2024 and Forecast, 2025 to 2035
    • Historical Market Size Value (USD Bn) & Volume (Units) Analysis, 2020 to 2024
    • Current and Future Market Size Value (USD Bn) & Volume (Units) Projections, 2025 to 2035
      • Y-o-Y Growth Trend Analysis
      • Absolute $ Opportunity Analysis
  5. Global Market Pricing Analysis 2020 to 2024 and Forecast 2025 to 2035
  6. Global Market Analysis 2020 to 2024 and Forecast 2025 to 2035, By Type
    • Introduction / Key Findings
    • Historical Market Size Value (USD Bn) & Volume (Units) Analysis By Type, 2020 to 2024
    • Current and Future Market Size Value (USD Bn) & Volume (Units) Analysis and Forecast By Type, 2025 to 2035
      • Fixed
      • Portable
    • Y-o-Y Growth Trend Analysis By Type, 2020 to 2024
    • Absolute $ Opportunity Analysis By Type, 2025 to 2035
  7. Global Market Analysis 2020 to 2024 and Forecast 2025 to 2035, By End-Use Industry
    • Introduction / Key Findings
    • Historical Market Size Value (USD Bn) & Volume (Units) Analysis By End-Use Industry, 2020 to 2024
    • Current and Future Market Size Value (USD Bn) & Volume (Units) Analysis and Forecast By End-Use Industry, 2025 to 2035
      • Oil & Gas
      • Government & Military
      • Manufacturing
      • Chemicals & Petrochemicals
      • Water & Wastewater
      • Metal & Mining
      • Utilities
    • Y-o-Y Growth Trend Analysis By End-Use Industry, 2020 to 2024
    • Absolute $ Opportunity Analysis By End-Use Industry, 2025 to 2035
  8. Global Market Analysis 2020 to 2024 and Forecast 2025 to 2035, By Communication Type
    • Introduction / Key Findings
    • Historical Market Size Value (USD Bn) & Volume (Units) Analysis By Communication Type, 2020 to 2024
    • Current and Future Market Size Value (USD Bn) & Volume (Units) Analysis and Forecast By Communication Type, 2025 to 2035
      • Wired
      • Wireless
    • Y-o-Y Growth Trend Analysis By Communication Type, 2020 to 2024
    • Absolute $ Opportunity Analysis By Communication Type, 2025 to 2035
  9. Global Market Analysis 2020 to 2024 and Forecast 2025 to 2035, By Gas Type
    • Introduction / Key Findings
    • Historical Market Size Value (USD Bn) & Volume (Units) Analysis By Gas Type, 2020 to 2024
    • Current and Future Market Size Value (USD Bn) & Volume (Units) Analysis and Forecast By Gas Type, 2025 to 2035
      • Combustible
      • Toxic
      • Oxygen
      • Dedicated
    • Y-o-Y Growth Trend Analysis By Gas Type, 2020 to 2024
    • Absolute $ Opportunity Analysis By Gas Type, 2025 to 2035
  10. Global Market Analysis 2020 to 2024 and Forecast 2025 to 2035, By Sensor Technology
    • Introduction / Key Findings
    • Historical Market Size Value (USD Bn) & Volume (Units) Analysis By Sensor Technology, 2020 to 2024
    • Current and Future Market Size Value (USD Bn) & Volume (Units) Analysis and Forecast By Sensor Technology, 2025 to 2035
      • Electrochemical
      • Infrared
      • Metal Oxide
      • Catalytic
      • Zirconia
    • Y-o-Y Growth Trend Analysis By Sensor Technology, 2020 to 2024
    • Absolute $ Opportunity Analysis By Sensor Technology, 2025 to 2035
  11. Global Market Analysis 2020 to 2024 and Forecast 2025 to 2035, By Region
    • Introduction
    • Historical Market Size Value (USD Bn) & Volume (Units) Analysis By Region, 2020 to 2024
    • Current Market Size Value (USD Bn) & Volume (Units) Analysis and Forecast By Region, 2025 to 2035
      • North America
      • Latin America
      • Western Europe
      • East Asia
      • South Asia Pacific
      • Eastern Europe
      • Middle East & Africa
    • Market Attractiveness Analysis By Region
  12. North America Market Analysis 2020 to 2024 and Forecast 2025 to 2035, By Country
    • Historical Market Size Value (USD Bn) & Volume (Units) Trend Analysis By Market Taxonomy, 2020 to 2024
    • Market Size Value (USD Bn) & Volume (Units) Forecast By Market Taxonomy, 2025 to 2035
      • By Country
        • U.S.
        • Canada
        • Mexico
      • By Type
      • By End-Use Industry
      • By Communication Type
      • By Gas Type
      • By Sensor Technology
    • Market Attractiveness Analysis
      • By Country
      • By Type
      • By End-Use Industry
      • By Communication Type
      • By Gas Type
      • By Sensor Technology
    • Key Takeaways
  13. Latin America Market Analysis 2020 to 2024 and Forecast 2025 to 2035, By Country
    • Historical Market Size Value (USD Bn) & Volume (Units) Trend Analysis By Market Taxonomy, 2020 to 2024
    • Market Size Value (USD Bn) & Volume (Units) Forecast By Market Taxonomy, 2025 to 2035
      • By Country
        • Brazil
        • Chile
        • Rest of Latin America
      • By Type
      • By End-Use Industry
      • By Communication Type
      • By Gas Type
      • By Sensor Technology
    • Market Attractiveness Analysis
      • By Country
      • By Type
      • By End-Use Industry
      • By Communication Type
      • By Gas Type
      • By Sensor Technology
    • Key Takeaways
  14. Western Europe Market Analysis 2020 to 2024 and Forecast 2025 to 2035, By Country
    • Historical Market Size Value (USD Bn) & Volume (Units) Trend Analysis By Market Taxonomy, 2020 to 2024
    • Market Size Value (USD Bn) & Volume (Units) Forecast By Market Taxonomy, 2025 to 2035
      • By Country
        • Germany
        • Italy
        • France
        • U.K.
        • Spain
        • Russia
        • BENELUX
        • Rest of Europe
      • By Type
      • By End-Use Industry
      • By Communication Type
      • By Gas Type
      • By Sensor Technology
    • Market Attractiveness Analysis
      • By Country
      • By Type
      • By End-Use Industry
      • By Communication Type
      • By Gas Type
      • By Sensor Technology
    • Key Takeaways
  15. East Asia Market Analysis 2020 to 2024 and Forecast 2025 to 2035, By Country
    • Historical Market Size Value (USD Bn) & Volume (Units) Trend Analysis By Market Taxonomy, 2020 to 2024
    • Market Size Value (USD Bn) & Volume (Units) Forecast By Market Taxonomy, 2025 to 2035
      • By Country
        • China
        • Japan
        • South Korea
      • By Type
      • By End-Use Industry
      • By Communication Type
      • By Gas Type
      • By Sensor Technology
    • Market Attractiveness Analysis
      • By Country
      • By Type
      • By End-Use Industry
      • By Communication Type
      • By Gas Type
      • By Sensor Technology
    • Key Takeaways
  16. South Asia Pacific Market Analysis 2020 to 2024 and Forecast 2025 to 2035, By Country
    • Historical Market Size Value (USD Bn) & Volume (Units) Trend Analysis By Market Taxonomy, 2020 to 2024
    • Market Size Value (USD Bn) & Volume (Units) Forecast By Market Taxonomy, 2025 to 2035
      • By Country
        • India
        • ASEAN Countries
        • Australia & New Zealand
        • Rest of South Asia Pacific
      • By Type
      • By End-Use Industry
      • By Communication Type
      • By Gas Type
      • By Sensor Technology
    • Market Attractiveness Analysis
      • By Country
      • By Type
      • By End-Use Industry
      • By Communication Type
      • By Gas Type
      • By Sensor Technology
    • Key Takeaways
  17. Eastern Europe Market Analysis 2020 to 2024 and Forecast 2025 to 2035, By Country
    • Historical Market Size Value (USD Bn) & Volume (Units) Trend Analysis By Market Taxonomy, 2020 to 2024
    • Market Size Value (USD Bn) & Volume (Units) Forecast By Market Taxonomy, 2025 to 2035
      • By Country
        • Russia
        • Poland
        • Hungary
        • Balkan & Baltics
        • Rest of Eastern Europe
      • By Type
      • By End-Use Industry
      • By Communication Type
      • By Gas Type
      • By Sensor Technology
    • Market Attractiveness Analysis
      • By Country
      • By Type
      • By End-Use Industry
      • By Communication Type
      • By Gas Type
      • By Sensor Technology
    • Key Takeaways
  18. Middle East & Africa Market Analysis 2020 to 2024 and Forecast 2025 to 2035, By Country
    • Historical Market Size Value (USD Bn) & Volume (Units) Trend Analysis By Market Taxonomy, 2020 to 2024
    • Market Size Value (USD Bn) & Volume (Units) Forecast By Market Taxonomy, 2025 to 2035
      • By Country
        • KSA
        • Other GCC Countries
        • Turkiye
        • South Africa
        • Rest of MEA
      • By Type
      • By End-Use Industry
      • By Communication Type
      • By Gas Type
      • By Sensor Technology
    • Market Attractiveness Analysis
      • By Country
      • By Type
      • By End-Use Industry
      • By Communication Type
      • By Gas Type
      • By Sensor Technology
    • Key Takeaways
  19. Key Countries Market Analysis
    • United States
      • Pricing Analysis
      • Market Share Analysis, 2024
        • By Type
        • By End-Use Industry
        • By Communication Type
        • By Gas Type
        • By Sensor Technology
    • China
      • Pricing Analysis
      • Market Share Analysis, 2024
        • By Type
        • By End-Use Industry
        • By Communication Type
        • By Gas Type
        • By Sensor Technology
    • Germany
      • Pricing Analysis
      • Market Share Analysis, 2024
        • By Type
        • By End-Use Industry
        • By Communication Type
        • By Gas Type
        • By Sensor Technology
    • Japan
      • Pricing Analysis
      • Market Share Analysis, 2024
        • By Type
        • By End-Use Industry
        • By Communication Type
        • By Gas Type
        • By Sensor Technology
    • India
      • Pricing Analysis
      • Market Share Analysis, 2024
        • By Type
        • By End-Use Industry
        • By Communication Type
        • By Gas Type
        • By Sensor Technology
  20. Market Structure Analysis
    • Competition Dashboard
    • Competition Benchmarking
    • Market Share Analysis of Top Players
      • By Regional
      • By Type
      • By End-Use Industry
      • By Communication Type
      • By Gas Type
      • By Sensor Technology
  21. Competition Analysis
    • Competition Deep Dive
      • MSA Safety Incorporated
        • Overview
        • Product Portfolio
        • Profitability by Market Segments (Product/Age /Sales Channel/Region)
        • Sales Footprint
        • Strategy Overview
          • Marketing Strategy
          • Product Strategy
          • Channel Strategy
      • Opgal
        • Overview
        • Product Portfolio
        • Profitability by Market Segments (Product/Age /Sales Channel/Region)
        • Sales Footprint
        • Strategy Overview
          • Marketing Strategy
          • Product Strategy
          • Channel Strategy
      • Drägerwerk AG & Co. KGaA
        • Overview
        • Product Portfolio
        • Profitability by Market Segments (Product/Age /Sales Channel/Region)
        • Sales Footprint
        • Strategy Overview
          • Marketing Strategy
          • Product Strategy
          • Channel Strategy
      • Teledyne Technologies Inc.
        • Overview
        • Product Portfolio
        • Profitability by Market Segments (Product/Age /Sales Channel/Region)
        • Sales Footprint
        • Strategy Overview
          • Marketing Strategy
          • Product Strategy
          • Channel Strategy
      • Emerson Electric Co.
        • Overview
        • Product Portfolio
        • Profitability by Market Segments (Product/Age /Sales Channel/Region)
        • Sales Footprint
        • Strategy Overview
          • Marketing Strategy
          • Product Strategy
          • Channel Strategy
      • Halma plc
        • Overview
        • Product Portfolio
        • Profitability by Market Segments (Product/Age /Sales Channel/Region)
        • Sales Footprint
        • Strategy Overview
          • Marketing Strategy
          • Product Strategy
          • Channel Strategy
      • Honeywell International Inc.
        • Overview
        • Product Portfolio
        • Profitability by Market Segments (Product/Age /Sales Channel/Region)
        • Sales Footprint
        • Strategy Overview
          • Marketing Strategy
          • Product Strategy
          • Channel Strategy
      • Danfoss A/S
        • Overview
        • Product Portfolio
        • Profitability by Market Segments (Product/Age /Sales Channel/Region)
        • Sales Footprint
        • Strategy Overview
          • Marketing Strategy
          • Product Strategy
          • Channel Strategy
      • Riken Keiki Co., Ltd.
        • Overview
        • Product Portfolio
        • Profitability by Market Segments (Product/Age /Sales Channel/Region)
        • Sales Footprint
        • Strategy Overview
          • Marketing Strategy
          • Product Strategy
          • Channel Strategy
      • Sensidyne, LP
        • Overview
        • Product Portfolio
        • Profitability by Market Segments (Product/Age /Sales Channel/Region)
        • Sales Footprint
        • Strategy Overview
          • Marketing Strategy
          • Product Strategy
          • Channel Strategy
      • Testo SE & Co KGaA
        • Overview
        • Product Portfolio
        • Profitability by Market Segments (Product/Age /Sales Channel/Region)
        • Sales Footprint
        • Strategy Overview
          • Marketing Strategy
          • Product Strategy
          • Channel Strategy
      • Fortive Corporation
        • Overview
        • Product Portfolio
        • Profitability by Market Segments (Product/Age /Sales Channel/Region)
        • Sales Footprint
        • Strategy Overview
          • Marketing Strategy
          • Product Strategy
          • Channel Strategy
      • Inficon Holding AG
        • Overview
        • Product Portfolio
        • Profitability by Market Segments (Product/Age /Sales Channel/Region)
        • Sales Footprint
        • Strategy Overview
          • Marketing Strategy
          • Product Strategy
          • Channel Strategy
      • Trolex Ltd.
        • Overview
        • Product Portfolio
        • Profitability by Market Segments (Product/Age /Sales Channel/Region)
        • Sales Footprint
        • Strategy Overview
          • Marketing Strategy
          • Product Strategy
          • Channel Strategy
      • ESP Safety Inc.
        • Overview
        • Product Portfolio
        • Profitability by Market Segments (Product/Age /Sales Channel/Region)
        • Sales Footprint
        • Strategy Overview
          • Marketing Strategy
          • Product Strategy
          • Channel Strategy
  22. Assumptions & Acronyms Used
  23. Research Methodology

List Of Table

  • Table 1: Global Market Value (USD Bn) Forecast by Region, 2020 to 2035
  • Table 2: Global Market Volume (Units) Forecast by Region, 2020 to 2035
  • Table 3: Global Market Value (USD Bn) Forecast by Type, 2020 to 2035
  • Table 4: Global Market Volume (Units) Forecast by Type, 2020 to 2035
  • Table 5: Global Market Value (USD Bn) Forecast by End-Use Industry, 2020 to 2035
  • Table 6: Global Market Volume (Units) Forecast by End-Use Industry, 2020 to 2035
  • Table 7: Global Market Value (USD Bn) Forecast by Communication Type, 2020 to 2035
  • Table 8: Global Market Volume (Units) Forecast by Communication Type, 2020 to 2035
  • Table 9: Global Market Value (USD Bn) Forecast by Gas Type, 2020 to 2035
  • Table 10: Global Market Volume (Units) Forecast by Gas Type, 2020 to 2035
  • Table 11: Global Market Value (USD Bn) Forecast by Sensor Technology, 2020 to 2035
  • Table 12: Global Market Volume (Units) Forecast by Sensor Technology, 2020 to 2035
  • Table 13: North America Market Value (USD Bn) Forecast by Country, 2020 to 2035
  • Table 14: North America Market Volume (Units) Forecast by Country, 2020 to 2035
  • Table 15: North America Market Value (USD Bn) Forecast by Type, 2020 to 2035
  • Table 16: North America Market Volume (Units) Forecast by Type, 2020 to 2035
  • Table 17: North America Market Value (USD Bn) Forecast by End-Use Industry, 2020 to 2035
  • Table 18: North America Market Volume (Units) Forecast by End-Use Industry, 2020 to 2035
  • Table 19: North America Market Value (USD Bn) Forecast by Communication Type, 2020 to 2035
  • Table 20: North America Market Volume (Units) Forecast by Communication Type, 2020 to 2035
  • Table 21: North America Market Value (USD Bn) Forecast by Gas Type, 2020 to 2035
  • Table 22: North America Market Volume (Units) Forecast by Gas Type, 2020 to 2035
  • Table 23: North America Market Value (USD Bn) Forecast by Sensor Technology, 2020 to 2035
  • Table 24: North America Market Volume (Units) Forecast by Sensor Technology, 2020 to 2035
  • Table 25: Latin America Market Value (USD Bn) Forecast by Country, 2020 to 2035
  • Table 26: Latin America Market Volume (Units) Forecast by Country, 2020 to 2035
  • Table 27: Latin America Market Value (USD Bn) Forecast by Type, 2020 to 2035
  • Table 28: Latin America Market Volume (Units) Forecast by Type, 2020 to 2035
  • Table 29: Latin America Market Value (USD Bn) Forecast by End-Use Industry, 2020 to 2035
  • Table 30: Latin America Market Volume (Units) Forecast by End-Use Industry, 2020 to 2035
  • Table 31: Latin America Market Value (USD Bn) Forecast by Communication Type, 2020 to 2035
  • Table 32: Latin America Market Volume (Units) Forecast by Communication Type, 2020 to 2035
  • Table 33: Latin America Market Value (USD Bn) Forecast by Gas Type, 2020 to 2035
  • Table 34: Latin America Market Volume (Units) Forecast by Gas Type, 2020 to 2035
  • Table 35: Latin America Market Value (USD Bn) Forecast by Sensor Technology, 2020 to 2035
  • Table 36: Latin America Market Volume (Units) Forecast by Sensor Technology, 2020 to 2035
  • Table 37: Western Europe Market Value (USD Bn) Forecast by Country, 2020 to 2035
  • Table 38: Western Europe Market Volume (Units) Forecast by Country, 2020 to 2035
  • Table 39: Western Europe Market Value (USD Bn) Forecast by Type, 2020 to 2035
  • Table 40: Western Europe Market Volume (Units) Forecast by Type, 2020 to 2035
  • Table 41: Western Europe Market Value (USD Bn) Forecast by End-Use Industry, 2020 to 2035
  • Table 42: Western Europe Market Volume (Units) Forecast by End-Use Industry, 2020 to 2035
  • Table 43: Western Europe Market Value (USD Bn) Forecast by Communication Type, 2020 to 2035
  • Table 44: Western Europe Market Volume (Units) Forecast by Communication Type, 2020 to 2035
  • Table 45: Western Europe Market Value (USD Bn) Forecast by Gas Type, 2020 to 2035
  • Table 46: Western Europe Market Volume (Units) Forecast by Gas Type, 2020 to 2035
  • Table 47: Western Europe Market Value (USD Bn) Forecast by Sensor Technology, 2020 to 2035
  • Table 48: Western Europe Market Volume (Units) Forecast by Sensor Technology, 2020 to 2035
  • Table 49: East Asia Market Value (USD Bn) Forecast by Country, 2020 to 2035
  • Table 50: East Asia Market Volume (Units) Forecast by Country, 2020 to 2035
  • Table 51: East Asia Market Value (USD Bn) Forecast by Type, 2020 to 2035
  • Table 52: East Asia Market Volume (Units) Forecast by Type, 2020 to 2035
  • Table 53: East Asia Market Value (USD Bn) Forecast by End-Use Industry, 2020 to 2035
  • Table 54: East Asia Market Volume (Units) Forecast by End-Use Industry, 2020 to 2035
  • Table 55: East Asia Market Value (USD Bn) Forecast by Communication Type, 2020 to 2035
  • Table 56: East Asia Market Volume (Units) Forecast by Communication Type, 2020 to 2035
  • Table 57: East Asia Market Value (USD Bn) Forecast by Gas Type, 2020 to 2035
  • Table 58: East Asia Market Volume (Units) Forecast by Gas Type, 2020 to 2035
  • Table 59: East Asia Market Value (USD Bn) Forecast by Sensor Technology, 2020 to 2035
  • Table 60: East Asia Market Volume (Units) Forecast by Sensor Technology, 2020 to 2035
  • Table 61: South Asia Pacific Market Value (USD Bn) Forecast by Country, 2020 to 2035
  • Table 62: South Asia Pacific Market Volume (Units) Forecast by Country, 2020 to 2035
  • Table 63: South Asia Pacific Market Value (USD Bn) Forecast by Type, 2020 to 2035
  • Table 64: South Asia Pacific Market Volume (Units) Forecast by Type, 2020 to 2035
  • Table 65: South Asia Pacific Market Value (USD Bn) Forecast by End-Use Industry, 2020 to 2035
  • Table 66: South Asia Pacific Market Volume (Units) Forecast by End-Use Industry, 2020 to 2035
  • Table 67: South Asia Pacific Market Value (USD Bn) Forecast by Communication Type, 2020 to 2035
  • Table 68: South Asia Pacific Market Volume (Units) Forecast by Communication Type, 2020 to 2035
  • Table 69: South Asia Pacific Market Value (USD Bn) Forecast by Gas Type, 2020 to 2035
  • Table 70: South Asia Pacific Market Volume (Units) Forecast by Gas Type, 2020 to 2035
  • Table 71: South Asia Pacific Market Value (USD Bn) Forecast by Sensor Technology, 2020 to 2035
  • Table 72: South Asia Pacific Market Volume (Units) Forecast by Sensor Technology, 2020 to 2035
  • Table 73: Eastern Europe Market Value (USD Bn) Forecast by Country, 2020 to 2035
  • Table 74: Eastern Europe Market Volume (Units) Forecast by Country, 2020 to 2035
  • Table 75: Eastern Europe Market Value (USD Bn) Forecast by Type, 2020 to 2035
  • Table 76: Eastern Europe Market Volume (Units) Forecast by Type, 2020 to 2035
  • Table 77: Eastern Europe Market Value (USD Bn) Forecast by End-Use Industry, 2020 to 2035
  • Table 78: Eastern Europe Market Volume (Units) Forecast by End-Use Industry, 2020 to 2035
  • Table 79: Eastern Europe Market Value (USD Bn) Forecast by Communication Type, 2020 to 2035
  • Table 80: Eastern Europe Market Volume (Units) Forecast by Communication Type, 2020 to 2035
  • Table 81: Eastern Europe Market Value (USD Bn) Forecast by Gas Type, 2020 to 2035
  • Table 82: Eastern Europe Market Volume (Units) Forecast by Gas Type, 2020 to 2035
  • Table 83: Eastern Europe Market Value (USD Bn) Forecast by Sensor Technology, 2020 to 2035
  • Table 84: Eastern Europe Market Volume (Units) Forecast by Sensor Technology, 2020 to 2035
  • Table 85: Middle East & Africa Market Value (USD Bn) Forecast by Country, 2020 to 2035
  • Table 86: Middle East & Africa Market Volume (Units) Forecast by Country, 2020 to 2035
  • Table 87: Middle East & Africa Market Value (USD Bn) Forecast by Type, 2020 to 2035
  • Table 88: Middle East & Africa Market Volume (Units) Forecast by Type, 2020 to 2035
  • Table 89: Middle East & Africa Market Value (USD Bn) Forecast by End-Use Industry, 2020 to 2035
  • Table 90: Middle East & Africa Market Volume (Units) Forecast by End-Use Industry, 2020 to 2035
  • Table 91: Middle East & Africa Market Value (USD Bn) Forecast by Communication Type, 2020 to 2035
  • Table 92: Middle East & Africa Market Volume (Units) Forecast by Communication Type, 2020 to 2035
  • Table 93: Middle East & Africa Market Value (USD Bn) Forecast by Gas Type, 2020 to 2035
  • Table 94: Middle East & Africa Market Volume (Units) Forecast by Gas Type, 2020 to 2035
  • Table 95: Middle East & Africa Market Value (USD Bn) Forecast by Sensor Technology, 2020 to 2035
  • Table 96: Middle East & Africa Market Volume (Units) Forecast by Sensor Technology, 2020 to 2035

List Of Figures

  • Figure 1: Global Market Volume (Units) Forecast 2020 to 2035
  • Figure 2: Global Market Pricing Analysis
  • Figure 3: Global Market Value (USD Bn) Forecast 2020 to 2035
  • Figure 4: Global Market Value Share and BPS Analysis by Type, 2025 and 2035
  • Figure 5: Global Market Y-o-Y Growth Comparison by Type, 2025 to 2035
  • Figure 6: Global Market Attractiveness Analysis by Type
  • Figure 7: Global Market Value Share and BPS Analysis by End-Use Industry, 2025 and 2035
  • Figure 8: Global Market Y-o-Y Growth Comparison by End-Use Industry, 2025 to 2035
  • Figure 9: Global Market Attractiveness Analysis by End-Use Industry
  • Figure 10: Global Market Value Share and BPS Analysis by Communication Type, 2025 and 2035
  • Figure 11: Global Market Y-o-Y Growth Comparison by Communication Type, 2025 to 2035
  • Figure 12: Global Market Attractiveness Analysis by Communication Type
  • Figure 13: Global Market Value Share and BPS Analysis by Gas Type, 2025 and 2035
  • Figure 14: Global Market Y-o-Y Growth Comparison by Gas Type, 2025 to 2035
  • Figure 15: Global Market Attractiveness Analysis by Gas Type
  • Figure 16: Global Market Value Share and BPS Analysis by Sensor Technology, 2025 and 2035
  • Figure 17: Global Market Y-o-Y Growth Comparison by Sensor Technology, 2025 to 2035
  • Figure 18: Global Market Attractiveness Analysis by Sensor Technology
  • Figure 19: Global Market Value (USD Bn) Share and BPS Analysis by Region, 2025 and 2035
  • Figure 20: Global Market Y-o-Y Growth Comparison by Region, 2025 to 2035
  • Figure 21: Global Market Attractiveness Analysis by Region
  • Figure 22: North America Market Incremental $ Opportunity, 2025 to 2035
  • Figure 23: Latin America Market Incremental $ Opportunity, 2025 to 2035
  • Figure 24: Western Europe Market Incremental $ Opportunity, 2025 to 2035
  • Figure 25: East Asia Market Incremental $ Opportunity, 2025 to 2035
  • Figure 26: South Asia Pacific Market Incremental $ Opportunity, 2025 to 2035
  • Figure 27: Eastern Europe Market Incremental $ Opportunity, 2025 to 2035
  • Figure 28: Middle East & Africa Market Incremental $ Opportunity, 2025 to 2035
  • Figure 29: North America Market Value Share and BPS Analysis by Country, 2025 and 2035
  • Figure 30: North America Market Value Share and BPS Analysis by Type, 2025 and 2035
  • Figure 31: North America Market Y-o-Y Growth Comparison by Type, 2025 to 2035
  • Figure 32: North America Market Attractiveness Analysis by Type
  • Figure 33: North America Market Value Share and BPS Analysis by End-Use Industry, 2025 and 2035
  • Figure 34: North America Market Y-o-Y Growth Comparison by End-Use Industry, 2025 to 2035
  • Figure 35: North America Market Attractiveness Analysis by End-Use Industry
  • Figure 36: North America Market Value Share and BPS Analysis by Communication Type, 2025 and 2035
  • Figure 37: North America Market Y-o-Y Growth Comparison by Communication Type, 2025 to 2035
  • Figure 38: North America Market Attractiveness Analysis by Communication Type
  • Figure 39: North America Market Value Share and BPS Analysis by Gas Type, 2025 and 2035
  • Figure 40: North America Market Y-o-Y Growth Comparison by Gas Type, 2025 to 2035
  • Figure 41: North America Market Attractiveness Analysis by Gas Type
  • Figure 42: North America Market Value Share and BPS Analysis by Sensor Technology, 2025 and 2035
  • Figure 43: North America Market Y-o-Y Growth Comparison by Sensor Technology, 2025 to 2035
  • Figure 44: North America Market Attractiveness Analysis by Sensor Technology
  • Figure 45: Latin America Market Value Share and BPS Analysis by Country, 2025 and 2035
  • Figure 46: Latin America Market Value Share and BPS Analysis by Type, 2025 and 2035
  • Figure 47: Latin America Market Y-o-Y Growth Comparison by Type, 2025 to 2035
  • Figure 48: Latin America Market Attractiveness Analysis by Type
  • Figure 49: Latin America Market Value Share and BPS Analysis by End-Use Industry, 2025 and 2035
  • Figure 50: Latin America Market Y-o-Y Growth Comparison by End-Use Industry, 2025 to 2035
  • Figure 51: Latin America Market Attractiveness Analysis by End-Use Industry
  • Figure 52: Latin America Market Value Share and BPS Analysis by Communication Type, 2025 and 2035
  • Figure 53: Latin America Market Y-o-Y Growth Comparison by Communication Type, 2025 to 2035
  • Figure 54: Latin America Market Attractiveness Analysis by Communication Type
  • Figure 55: Latin America Market Value Share and BPS Analysis by Gas Type, 2025 and 2035
  • Figure 56: Latin America Market Y-o-Y Growth Comparison by Gas Type, 2025 to 2035
  • Figure 57: Latin America Market Attractiveness Analysis by Gas Type
  • Figure 58: Latin America Market Value Share and BPS Analysis by Sensor Technology, 2025 and 2035
  • Figure 59: Latin America Market Y-o-Y Growth Comparison by Sensor Technology, 2025 to 2035
  • Figure 60: Latin America Market Attractiveness Analysis by Sensor Technology
  • Figure 61: Western Europe Market Value Share and BPS Analysis by Country, 2025 and 2035
  • Figure 62: Western Europe Market Value Share and BPS Analysis by Type, 2025 and 2035
  • Figure 63: Western Europe Market Y-o-Y Growth Comparison by Type, 2025 to 2035
  • Figure 64: Western Europe Market Attractiveness Analysis by Type
  • Figure 65: Western Europe Market Value Share and BPS Analysis by End-Use Industry, 2025 and 2035
  • Figure 66: Western Europe Market Y-o-Y Growth Comparison by End-Use Industry, 2025 to 2035
  • Figure 67: Western Europe Market Attractiveness Analysis by End-Use Industry
  • Figure 68: Western Europe Market Value Share and BPS Analysis by Communication Type, 2025 and 2035
  • Figure 69: Western Europe Market Y-o-Y Growth Comparison by Communication Type, 2025 to 2035
  • Figure 70: Western Europe Market Attractiveness Analysis by Communication Type
  • Figure 71: Western Europe Market Value Share and BPS Analysis by Gas Type, 2025 and 2035
  • Figure 72: Western Europe Market Y-o-Y Growth Comparison by Gas Type, 2025 to 2035
  • Figure 73: Western Europe Market Attractiveness Analysis by Gas Type
  • Figure 74: Western Europe Market Value Share and BPS Analysis by Sensor Technology, 2025 and 2035
  • Figure 75: Western Europe Market Y-o-Y Growth Comparison by Sensor Technology, 2025 to 2035
  • Figure 76: Western Europe Market Attractiveness Analysis by Sensor Technology
  • Figure 77: East Asia Market Value Share and BPS Analysis by Country, 2025 and 2035
  • Figure 78: East Asia Market Value Share and BPS Analysis by Type, 2025 and 2035
  • Figure 79: East Asia Market Y-o-Y Growth Comparison by Type, 2025 to 2035
  • Figure 80: East Asia Market Attractiveness Analysis by Type
  • Figure 81: East Asia Market Value Share and BPS Analysis by End-Use Industry, 2025 and 2035
  • Figure 82: East Asia Market Y-o-Y Growth Comparison by End-Use Industry, 2025 to 2035
  • Figure 83: East Asia Market Attractiveness Analysis by End-Use Industry
  • Figure 84: East Asia Market Value Share and BPS Analysis by Communication Type, 2025 and 2035
  • Figure 85: East Asia Market Y-o-Y Growth Comparison by Communication Type, 2025 to 2035
  • Figure 86: East Asia Market Attractiveness Analysis by Communication Type
  • Figure 87: East Asia Market Value Share and BPS Analysis by Gas Type, 2025 and 2035
  • Figure 88: East Asia Market Y-o-Y Growth Comparison by Gas Type, 2025 to 2035
  • Figure 89: East Asia Market Attractiveness Analysis by Gas Type
  • Figure 90: East Asia Market Value Share and BPS Analysis by Sensor Technology, 2025 and 2035
  • Figure 91: East Asia Market Y-o-Y Growth Comparison by Sensor Technology, 2025 to 2035
  • Figure 92: East Asia Market Attractiveness Analysis by Sensor Technology
  • Figure 93: South Asia Pacific Market Value Share and BPS Analysis by Country, 2025 and 2035
  • Figure 94: South Asia Pacific Market Value Share and BPS Analysis by Type, 2025 and 2035
  • Figure 95: South Asia Pacific Market Y-o-Y Growth Comparison by Type, 2025 to 2035
  • Figure 96: South Asia Pacific Market Attractiveness Analysis by Type
  • Figure 97: South Asia Pacific Market Value Share and BPS Analysis by End-Use Industry, 2025 and 2035
  • Figure 98: South Asia Pacific Market Y-o-Y Growth Comparison by End-Use Industry, 2025 to 2035
  • Figure 99: South Asia Pacific Market Attractiveness Analysis by End-Use Industry
  • Figure 100: South Asia Pacific Market Value Share and BPS Analysis by Communication Type, 2025 and 2035
  • Figure 101: South Asia Pacific Market Y-o-Y Growth Comparison by Communication Type, 2025 to 2035
  • Figure 102: South Asia Pacific Market Attractiveness Analysis by Communication Type
  • Figure 103: South Asia Pacific Market Value Share and BPS Analysis by Gas Type, 2025 and 2035
  • Figure 104: South Asia Pacific Market Y-o-Y Growth Comparison by Gas Type, 2025 to 2035
  • Figure 105: South Asia Pacific Market Attractiveness Analysis by Gas Type
  • Figure 106: South Asia Pacific Market Value Share and BPS Analysis by Sensor Technology, 2025 and 2035
  • Figure 107: South Asia Pacific Market Y-o-Y Growth Comparison by Sensor Technology, 2025 to 2035
  • Figure 108: South Asia Pacific Market Attractiveness Analysis by Sensor Technology
  • Figure 109: Eastern Europe Market Value Share and BPS Analysis by Country, 2025 and 2035
  • Figure 110: Eastern Europe Market Value Share and BPS Analysis by Type, 2025 and 2035
  • Figure 111: Eastern Europe Market Y-o-Y Growth Comparison by Type, 2025 to 2035
  • Figure 112: Eastern Europe Market Attractiveness Analysis by Type
  • Figure 113: Eastern Europe Market Value Share and BPS Analysis by End-Use Industry, 2025 and 2035
  • Figure 114: Eastern Europe Market Y-o-Y Growth Comparison by End-Use Industry, 2025 to 2035
  • Figure 115: Eastern Europe Market Attractiveness Analysis by End-Use Industry
  • Figure 116: Eastern Europe Market Value Share and BPS Analysis by Communication Type, 2025 and 2035
  • Figure 117: Eastern Europe Market Y-o-Y Growth Comparison by Communication Type, 2025 to 2035
  • Figure 118: Eastern Europe Market Attractiveness Analysis by Communication Type
  • Figure 119: Eastern Europe Market Value Share and BPS Analysis by Gas Type, 2025 and 2035
  • Figure 120: Eastern Europe Market Y-o-Y Growth Comparison by Gas Type, 2025 to 2035
  • Figure 121: Eastern Europe Market Attractiveness Analysis by Gas Type
  • Figure 122: Eastern Europe Market Value Share and BPS Analysis by Sensor Technology, 2025 and 2035
  • Figure 123: Eastern Europe Market Y-o-Y Growth Comparison by Sensor Technology, 2025 to 2035
  • Figure 124: Eastern Europe Market Attractiveness Analysis by Sensor Technology
  • Figure 125: Middle East & Africa Market Value Share and BPS Analysis by Country, 2025 and 2035
  • Figure 126: Middle East & Africa Market Value Share and BPS Analysis by Type, 2025 and 2035
  • Figure 127: Middle East & Africa Market Y-o-Y Growth Comparison by Type, 2025 to 2035
  • Figure 128: Middle East & Africa Market Attractiveness Analysis by Type
  • Figure 129: Middle East & Africa Market Value Share and BPS Analysis by End-Use Industry, 2025 and 2035
  • Figure 130: Middle East & Africa Market Y-o-Y Growth Comparison by End-Use Industry, 2025 to 2035
  • Figure 131: Middle East & Africa Market Attractiveness Analysis by End-Use Industry
  • Figure 132: Middle East & Africa Market Value Share and BPS Analysis by Communication Type, 2025 and 2035
  • Figure 133: Middle East & Africa Market Y-o-Y Growth Comparison by Communication Type, 2025 to 2035
  • Figure 134: Middle East & Africa Market Attractiveness Analysis by Communication Type
  • Figure 135: Middle East & Africa Market Value Share and BPS Analysis by Gas Type, 2025 and 2035
  • Figure 136: Middle East & Africa Market Y-o-Y Growth Comparison by Gas Type, 2025 to 2035
  • Figure 137: Middle East & Africa Market Attractiveness Analysis by Gas Type
  • Figure 138: Middle East & Africa Market Value Share and BPS Analysis by Sensor Technology, 2025 and 2035
  • Figure 139: Middle East & Africa Market Y-o-Y Growth Comparison by Sensor Technology, 2025 to 2035
  • Figure 140: Middle East & Africa Market Attractiveness Analysis by Sensor Technology
  • Figure 141: Global Market - Tier Structure Analysis
  • Figure 142: Global Market - Company Share Analysis

- FAQs -

What is the Global Gas Detection Equipment Market size in 2025?

The gas detection equipment market is valued at USD 5.1 billion in 2025.

Who are the Major Players Operating in the Gas Detection Equipment Market?

Prominent players in the market include MSA Safety Incorporated, Opgal, Drägerwerk AG & Co. KGaA, Teledyne Technologies Inc., and Emerson Electric Co.

What is the Estimated Valuation of the Gas Detection Equipment Market by 2035?

The market is expected to reach a valuation of USD 8.6 billion by 2035.

What value CAGR is the Gas Detection Equipment Market Exhibit Over the Last Five Years?

The growth rate of the gas detection equipment market is 4.9% from 2020 to 2024.

Gas Detection Equipment Market

Schedule a Call