Compact Track Loader Market
Compact Track Loader Market Analysis, By Engine Capacity, By Power Output, By Fuel Type, By Application, and Region - Market Insights 2025 to 2035
Analysis of Compact Track Loader Market Covering 30+ Countries Including Analysis of US, Canada, UK, Germany, France, Nordics, GCC countries, Japan, Korea and many more.
Compact Track Loader Market Outlook (2025 to 2035)
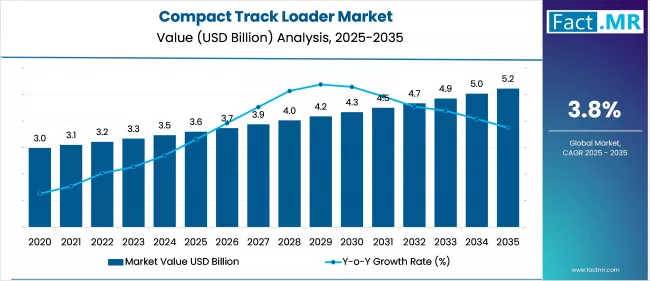
The global compact track loader market is projected to increase from USD 3.6 billion in 2025 to USD 5.2 billion by 2035, with a CAGR of 3.8%, driven by rising infrastructure projects requiring versatile, multi-functional equipment with enhanced efficiency. Their use makes them ideal for urban construction and rental markets due to their compact size, ease of transport, and compatibility with various attachments.
What are the Drivers of Compact Track Loader Market?
The surge in urban development projects is driving the U.S. compact track loader market. In October 2024, U.S. construction spending reached a record $2.17 trillion, up 0.4% from the previous month. Data centre and manufacturing investments are driving this surge, reflecting the growth of urban infrastructure. Single-family home construction rose 0.8%, indicating a strong housing market. In addition, rising construction activities have increased demand for compact track loaders.
The growing number of infrastructure development projects, particularly in emerging economies, is driving demand for compact equipment that delivers high performance without occupying excessive space. Compact track loaders meet this demand due to their small size and high maneuverability.
Advancements in hydraulic technology and attachment compatibility are enhancing machine performance, enabling operators to switch tools quickly and increase productivity across job sites. Their adaptability makes them more appealing to rental businesses and small contractors.
Environmental concerns are also affecting demand, as newer models feature more fuel-efficient engines and lower emissions. This makes them suitable for regions with strict environmental regulations, encouraging adoption among environmentally conscious contractors and municipalities aiming to achieve sustainability goals.
What are the Regional Trends of Compact Track Loader Market?
The U.S. compact loaders market holds the largest market share, while the Canadian compact track loaders market was the fastest-growing market in the North American region. The U.S. urgently needs to upgrade its existing civil infrastructure, particularly its road system. According to recent estimates, more than 11% of U.S. bridges require immediate repair, one out of every three major highways is in poor condition, and roughly 40% of primary metropolitan routes are congested.
The European compact track loader market benefits from strict environmental regulations and a strong emphasis on fuel efficiency. The construction industry's push for technologically advanced, environmentally friendly equipment drives the market.
Strong economic development and investments in the construction and infrastructure sectors are driving the region's growth. Compact loaders are essential in these areas due to their versatility and ability to operate in a variety of terrains, which is critical in the Asia Pacific's diverse geographic landscapes.
The Latin American compact loader market is experiencing rapid growth as urban infrastructure and agricultural activities continue to improve. The region's economic recovery following the recession has contributed to a gradual rise in demand for compact loaders.
The compact loader market in the Middle East & Africa is expanding, driven by infrastructure developments and investments in the oil and gas sector. The region's strategic economic diversification initiatives create new opportunities for market expansion.
What are the Challenges and Restraining Factors of Compact Track Loader Market?
One of the primary concerns is the high cost of purchasing and operating these machines. Compact track loaders have a much higher initial investment than wheeled loaders or skid steers. Maintenance costs are also higher due to the need for frequent replacement of rubber tracks, which can wear out quickly in heavy use or harsh environments. This creates an adoption barrier for small contractors and rental fleet operators.
Compact track loaders excel on soft, muddy, or uneven surfaces, but are less well-suited for hard, rocky, or paved surfaces, where rubber tracks tend to degrade more quickly. In areas where ground conditions do not favor tracked equipment, wheeled alternatives are frequently preferred, reducing potential demand.
The limited awareness and availability of skilled operators in developing markets impedes effective deployment. Advanced features like grade control, GPS integration, and telematics necessitate trained personnel, but many areas still have a skills shortage. This not only reduces machine efficiency but also increases the risk of equipment misuse and damage, discouraging fleet owners from investing in high-end models.
Country-Wise Outlook
Germany Compact Track Loader Market sees Growth Driven by Infrastructure Renewal Project
The Germany compact track loader market is influenced by the country's high standards for construction technology, environmental regulations, and infrastructure renewal projects. Germany, one of Europe's leading economies with significant public infrastructure investment, continues to modernize roads, railways, and urban areas, driving demand for compact, versatile construction equipment.
Germany's stringent emissions regulations under the EU Stage V standards compel construction equipment manufacturers and users to adopt environmentally friendly models. As a result, diesel-powered compact track loaders with improved emission control systems are in higher demand, while electric and hybrid models are gaining popularity for use in urban areas.
In 2023, the government allocated over USD 14 billion for road and bridge modernization. Compact track loaders, renowned for their agility in confined spaces and versatility on various terrains, are ideal for urban and semi-urban rehabilitation projects.
Additionally, skilled labor shortages in Germany are hastening the adoption of automated and simple-to-use machinery. Many compact track loader models now feature joystick controls, digital diagnostics, and quick-attach systems, making them appealing to contractors seeking efficiency while reducing workforce dependency.
China's Strategic Investments Fuel Compact Track Loader Market Growth
China is a key player in the global compact track loader (CTL) market, driven by its expanding urban infrastructure and rural modernization efforts. The country's 13th and 14th Five-Year Plans have prioritized significant investments in road construction, smart cities, and agricultural mechanization, all of which drive demand for compact, multi-functional machinery such as CTLs.
By 2023, over 65% of China's population is expected to live in cities, driving up demand for compact construction equipment that can operate efficiently in confined spaces. CTLs are preferred in these environments due to their maneuverability and reduced ground disturbance compared to wheeled loaders.
Compact track loaders are gaining popularity in agriculture due to government-led initiatives promoting farm mechanization in rural provinces. China's subsidy programs for small and medium-sized agricultural machinery have boosted adoption among smallholder farmers. CTLs with attachments for plowing, trenching, and material handling are particularly useful in hilly or difficult terrain.
Emission standards such as China Stage IV and V have prompted automakers to introduce more energy-efficient and low-emission CTL cars. In 2023, XCMG introduced electric compact track loaders for urban use, reflecting a larger national push for green construction machinery under the "Made in China 2025" initiative.
India Prioritizes Compact Track Loaders in Rural and Urban Development Initiatives
A strong infrastructure agenda and agricultural modernization are propelling India's compact track loader market forward. The National Infrastructure Pipeline anticipates investing more than USD 1.4 trillion by 2025, driving demand for versatile equipment, such as CTLs, in construction, rural development, and disaster recovery operations.
Government policies aimed at mechanizing agriculture promote CTL adoption in semi-urban and rural areas. With over 300 million farmers, CTLs equipped with attachments for trenching and loading are increasingly popular, especially in terrain where wheel loaders fall short.
Emission regulations that are consistent with global standards are driving the market toward energy-efficient and electric vehicles. Pilot programs and technology demonstrations at events such as Excon 2023 demonstrate growing momentum toward electrified CTLs, aligning India with global green-equipment trends.
Infrastructure development, local manufacturing initiatives, agricultural mechanization, and the adoption of green policies are all contributing to the advancement of India's CTL market. Its future will depend on developing technical expertise, enabling financing models, and advancing electrification.
Category-wise Analysis
4 to 10-Liter to Exhibit Leading by Engine Capacity
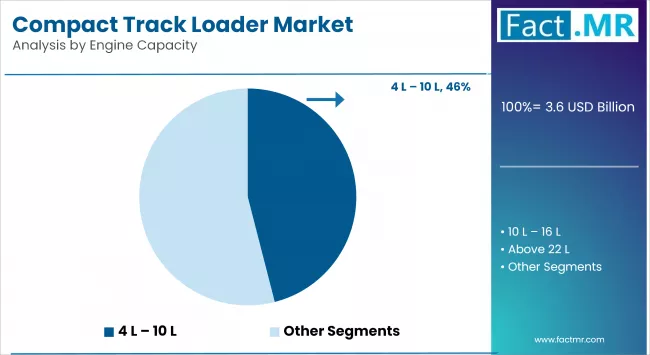
Loaders with 4 to 10-litre displacement make up a sizable segment of the compact track loader market. They strike an excellent balance between power and fuel economy, making them ideal for demanding tasks like grading, trenching, and material handling in commercial construction and agriculture. These machines offer increased torque, longer operating hours, and compatibility with heavier attachments, resulting in enhanced productivity across various job types. Contractors prefer this displacement range because it provides versatility without incurring large equipment costs.
Compact track loaders with engine displacements of less than 4 litres (<4 L) are intended for tasks that require less power but greater manoeuvrability. These models are widely used in small-scale landscaping, property maintenance, and light-duty construction applications where compact size and fuel efficiency are important. Their low emissions and quiet operation make them appropriate for urban and residential settings. While not suitable for heavy lifting or rough terrain, they meet specific requirements where precision and low operational costs are critical.
50 HP-100 HP to Exhibit leading by Power Output
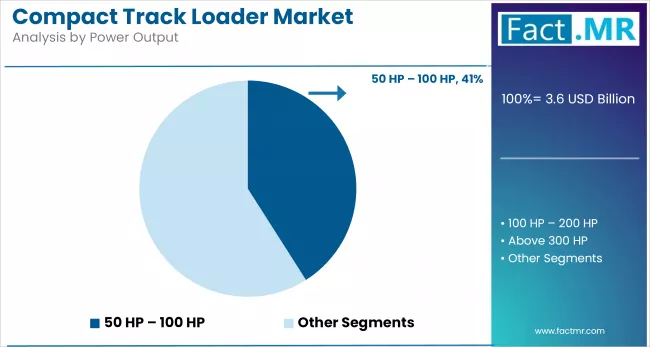
Loaders with 50-100 horsepower form the backbone of the compact track loader market due to their balance of power and versatility. This segment is extensively used in road construction, commercial landscaping, grading, and general material handling. They offer improved hydraulic flow, attachment compatibility, and lifting capacity compared to models with less than 50 HP. Their adaptability makes them the preferred choice for mid-sized construction firms and farm operators seeking durability without incurring heavy equipment costs.
Compact track loaders with under 50 horsepower (<50 HP) are ideal for residential landscaping, site cleanup, and indoor demolition where space is limited and ground disturbance is required. Their small size and manoeuvrability allow operators to work in congested or urban areas with ease. Small contractors or property owners frequently choose these models due to their low cost, low fuel consumption, and ease of transportation. Despite their limited lifting capacity, they excel at precision-driven, short-duration tasks.
Gasoline-Powered to Exhibit Leading by Fuel Type
Gasoline-powered compact track loaders are preferred due to their low initial cost and ease of maintenance. These machines are commonly used in light to medium-duty applications, particularly in residential and commercial landscaping, where emissions and noise regulations are more relaxed. Gasoline engines start easily in cold weather, making them ideal for seasonal operations. However, they typically provide less torque and efficiency than diesel-powered models, limiting their use in heavy-duty applications.
Diesel-powered compact track loaders dominate the market due to their high torque output, fuel efficiency, and durability in harsh environments. They are the preferred choice for heavy-duty construction, agriculture, and industrial applications. To meet Tier 4 and Euro Stage V emissions standards, modern diesel vehicles are increasingly equipped with advanced emission control systems. Despite higher initial costs and maintenance requirements, their performance, longevity, and fuel economy make them ideal for heavy-duty and continuous operations.
Construction to Exhibit Leading by Application
Compact loaders are widely used in the construction industry, assisting with a variety of tasks during building projects. These flexible machines are used on construction sites to excavate, dig, lift, and transport materials. Their mobility and small size make them ideal for handling tight spaces on urban construction sites. Compact loaders are crucial for enhancing efficiency and productivity on construction sites, whether loading materials into trucks, grading surfaces, or clearing debris.
Compact loaders are also widely used in agriculture to feed livestock and clear land. Landscape applications benefit from their ability to handle a wide range of ground materials while also assisting in the creation and maintenance of aesthetically pleasing spaces.
Competitive Analysis
The global compact track loader market is becoming increasingly competitive, with a mix of established construction equipment manufacturers and emerging technology-driven brands catering to applications in infrastructure, landscaping, agriculture, and urban development.
Advancements in hydraulic systems, operator comfort, telematics integration, and multi-attachment versatility fuel this competitive environment. Leading companies such as Caterpillar Inc., Bobcat Company, Deere & Co., JCB Inc., and Kubota Corporation are gaining a distinct competitive edge by consistently innovating, expanding their product portfolios, and leveraging strategic global distribution networks.
The compact track loader market is growing due to rising construction, infrastructure modernization, and agricultural and landscaping mechanization. These machines are ideal for applications where wheeled equipment fails due to their traction, stability, and versatility on various terrains. Their low ground pressure and ability to operate in muddy or uneven conditions give them an edge in projects requiring minimal surface disruption.
Competition is high, with manufacturers focusing on performance, fuel efficiency, and operator comfort. Most companies are investing in telematics, GPS integration, and automated diagnostics. These features reduce downtime and boost productivity with real-time performance monitoring and maintenance alerts. Companies are also introducing models with higher lift capacity and breakout force to meet customer demand for faster cycle times and better hydraulic performance.
Key players in the compact track loader industry include ASV Holdings Inc., Bobcat Company, Inc., CNH Industrial Inc., Caterpillar Inc., Manitou, IHI Construction Machinery Limited, JCB Inc., Deere & Company, Kubota Corporation, Takeuchi Mfg Co., Ltd., Volvo AB, Wacker Neuson SE, and Yanmar Co., Ltd.
Recent Development
- In September 2024, ASV introduced two new compact track loaders, the VT-75 and RT-65, specifically designed for enhanced performance and productivity in construction, landscaping, and other applications. These models feature Tier 4 Final Yanmar diesel engines, known for their reliability and efficiency.
- In September 2024, Caterpillar introduced eight new models of its next-generation Cat® Skid Steer Loaders (SSLs) and Compact Track Loaders (CTLs) with significant enhancements in power, performance, and operator comfort.
Segmentation of Compact Track Loader Market
-
By Engine Capacity :
- <4 L
- 4 L-10 L
- 10 L-16 L
- 16 L-22 L
- Above 22 L
-
By Power Output :
- <50 HP
- 50 HP-100 HP
- 100 HP- 200 HP
- 200 HP - 300 HP
- Above 300 HP
-
By Fuel Type :
- Gasoline
- Diesel
- Others
-
By Application :
- Construction Equipment
- Agriculture Equipment
- Marine Engines
- Genset
- Industrial Trucks
- Power Sports
- Others
-
By Region :
- North America
- Latin America
- Western Europe
- Eastern Europe
- East Asia
- South Asia & Pacific
- Middle East & Africa
Table of Content
- Executive Summary
- Global Market Outlook
- Demand-side Trends
- Supply-side Trends
- Technology Roadmap Analysis
- Analysis and Recommendations
- Market Overview
- Market Coverage / Taxonomy
- Market Definition / Scope / Limitations
- Market Background
- Market Dynamics
- Drivers
- Restraints
- Opportunity
- Trends
- Scenario Forecast
- Demand in Optimistic Scenario
- Demand in Likely Scenario
- Demand in Conservative Scenario
- Opportunity Map Analysis
- Product Life Cycle Analysis
- Supply Chain Analysis
- Supply Side Participants and their Roles
- Producers
- Mid-Level Participants (Traders/ Agents/ Brokers)
- Wholesalers and Distributors
- Value Added and Value Created at Node in the Supply Chain
- List of Component Suppliers
- List of Existing and Potential Buyers
- Supply Side Participants and their Roles
- Investment Feasibility Matrix
- Value Chain Analysis
- Profit Margin Analysis
- Wholesalers and Distributors
- Retailers
- PESTLE and Porter’s Analysis
- Regulatory Landscape
- By Key Regions
- By Key Countries
- Production and Consumption Statistics
- Import and Export Statistics
- Market Dynamics
- Global Market Analysis 2020 to 2024 and Forecast, 2025 to 2035
- Historical Market Size Value (USD Bn) & Volume (Units) Analysis, 2020 to 2024
- Current and Future Market Size Value (USD Bn) & Volume (Units) Projections, 2025 to 2035
- Y-o-Y Growth Trend Analysis
- Absolute $ Opportunity Analysis
- Global Market Pricing Analysis 2020 to 2024 and Forecast 2025 to 2035
- Global Market Analysis 2020 to 2024 and Forecast 2025 to 2035, By Engine Capacity
- Introduction / Key Findings
- Historical Market Size Value (USD Bn) & Volume (Units) Analysis By Engine Capacity, 2020 to 2024
- Current and Future Market Size Value (USD Bn) & Volume (Units) Analysis and Forecast By Engine Capacity, 2025 to 2035
- <4 L
- 4 L-10 L
- 10 L-16 L
- 16 L-22 L
- Above 22 L
- Y-o-Y Growth Trend Analysis By Engine Capacity, 2020 to 2024
- Absolute $ Opportunity Analysis By Engine Capacity, 2025 to 2035
- Global Market Analysis 2020 to 2024 and Forecast 2025 to 2035, By Power Output
- Introduction / Key Findings
- Historical Market Size Value (USD Bn) & Volume (Units) Analysis By Power Output, 2020 to 2024
- Current and Future Market Size Value (USD Bn) & Volume (Units) Analysis and Forecast By Power Output, 2025 to 2035
- <50 HP
- 50 HP-100 HP
- 100 HP to 200 HP
- 200 HP-300 HP
- Above 300 HP
- Y-o-Y Growth Trend Analysis By Power Output, 2020 to 2024
- Absolute $ Opportunity Analysis By Power Output, 2025 to 2035
- Global Market Analysis 2020 to 2024 and Forecast 2025 to 2035, By Fuel Type
- Introduction / Key Findings
- Historical Market Size Value (USD Bn) & Volume (Units) Analysis By Fuel Type, 2020 to 2024
- Current and Future Market Size Value (USD Bn) & Volume (Units) Analysis and Forecast By Fuel Type, 2025 to 2035
- Gasoline
- Diesel
- Others
- Y-o-Y Growth Trend Analysis By Fuel Type, 2020 to 2024
- Absolute $ Opportunity Analysis By Fuel Type, 2025 to 2035
- Global Market Analysis 2020 to 2024 and Forecast 2025 to 2035, By Application
- Introduction / Key Findings
- Historical Market Size Value (USD Bn) & Volume (Units) Analysis By Application, 2020 to 2024
- Current and Future Market Size Value (USD Bn) & Volume (Units) Analysis and Forecast By Application, 2025 to 2035
- Construction Equipment
- Agriculture Equipment
- Marine Engines
- Genset
- Industrial Trucks
- Power Sports
- Others
- Y-o-Y Growth Trend Analysis By Application, 2020 to 2024
- Absolute $ Opportunity Analysis By Application, 2025 to 2035
- Global Market Analysis 2020 to 2024 and Forecast 2025 to 2035, By Region
- Introduction
- Historical Market Size Value (USD Bn) & Volume (Units) Analysis By Region, 2020 to 2024
- Current Market Size Value (USD Bn) & Volume (Units) Analysis and Forecast By Region, 2025 to 2035
- North America
- Latin America
- Western Europe
- East Asia
- South Asia Pacific
- Eastern Europe
- Middle East & Africa
- Market Attractiveness Analysis By Region
- North America Market Analysis 2020 to 2024 and Forecast 2025 to 2035, By Country
- Historical Market Size Value (USD Bn) & Volume (Units) Trend Analysis By Market Taxonomy, 2020 to 2024
- Market Size Value (USD Bn) & Volume (Units) Forecast By Market Taxonomy, 2025 to 2035
- By Country
- U.S.
- Canada
- Mexico
- By Engine Capacity
- By Power Output
- By Fuel Type
- By Application
- By Country
- Market Attractiveness Analysis
- By Country
- By Engine Capacity
- By Power Output
- By Fuel Type
- By Application
- Key Takeaways
- Latin America Market Analysis 2020 to 2024 and Forecast 2025 to 2035, By Country
- Historical Market Size Value (USD Bn) & Volume (Units) Trend Analysis By Market Taxonomy, 2020 to 2024
- Market Size Value (USD Bn) & Volume (Units) Forecast By Market Taxonomy, 2025 to 2035
- By Country
- Brazil
- Chile
- Rest of Latin America
- By Engine Capacity
- By Power Output
- By Fuel Type
- By Application
- By Country
- Market Attractiveness Analysis
- By Country
- By Engine Capacity
- By Power Output
- By Fuel Type
- By Application
- Key Takeaways
- Western Europe Market Analysis 2020 to 2024 and Forecast 2025 to 2035, By Country
- Historical Market Size Value (USD Bn) & Volume (Units) Trend Analysis By Market Taxonomy, 2020 to 2024
- Market Size Value (USD Bn) & Volume (Units) Forecast By Market Taxonomy, 2025 to 2035
- By Country
- Germany
- Italy
- France
- U.K.
- Spain
- Russia
- BENELUX
- Rest of Europe
- By Engine Capacity
- By Power Output
- By Fuel Type
- By Application
- By Country
- Market Attractiveness Analysis
- By Country
- By Engine Capacity
- By Power Output
- By Fuel Type
- By Application
- Key Takeaways
- East Asia Market Analysis 2020 to 2024 and Forecast 2025 to 2035, By Country
- Historical Market Size Value (USD Bn) & Volume (Units) Trend Analysis By Market Taxonomy, 2020 to 2024
- Market Size Value (USD Bn) & Volume (Units) Forecast By Market Taxonomy, 2025 to 2035
- By Country
- China
- Japan
- South Korea
- By Engine Capacity
- By Power Output
- By Fuel Type
- By Application
- By Country
- Market Attractiveness Analysis
- By Country
- By Engine Capacity
- By Power Output
- By Fuel Type
- By Application
- Key Takeaways
- South Asia Pacific Market Analysis 2020 to 2024 and Forecast 2025 to 2035, By Country
- Historical Market Size Value (USD Bn) & Volume (Units) Trend Analysis By Market Taxonomy, 2020 to 2024
- Market Size Value (USD Bn) & Volume (Units) Forecast By Market Taxonomy, 2025 to 2035
- By Country
- India
- ASEAN Countries
- Australia & New Zealand
- Rest of South Asia Pacific
- By Engine Capacity
- By Power Output
- By Fuel Type
- By Application
- By Country
- Market Attractiveness Analysis
- By Country
- By Engine Capacity
- By Power Output
- By Fuel Type
- By Application
- Key Takeaways
- Eastern Europe Market Analysis 2020 to 2024 and Forecast 2025 to 2035, By Country
- Historical Market Size Value (USD Bn) & Volume (Units) Trend Analysis By Market Taxonomy, 2020 to 2024
- Market Size Value (USD Bn) & Volume (Units) Forecast By Market Taxonomy, 2025 to 2035
- By Country
- Russia
- Poland
- Hungary
- Balkan & Baltics
- Rest of Eastern Europe
- By Engine Capacity
- By Power Output
- By Fuel Type
- By Application
- By Country
- Market Attractiveness Analysis
- By Country
- By Engine Capacity
- By Power Output
- By Fuel Type
- By Application
- Key Takeaways
- Middle East & Africa Market Analysis 2020 to 2024 and Forecast 2025 to 2035, By Country
- Historical Market Size Value (USD Bn) & Volume (Units) Trend Analysis By Market Taxonomy, 2020 to 2024
- Market Size Value (USD Bn) & Volume (Units) Forecast By Market Taxonomy, 2025 to 2035
- By Country
- KSA
- Other GCC Countries
- Turkiye
- South Africa
- Rest of MEA
- By Engine Capacity
- By Power Output
- By Fuel Type
- By Application
- By Country
- Market Attractiveness Analysis
- By Country
- By Engine Capacity
- By Power Output
- By Fuel Type
- By Application
- Key Takeaways
- Key Countries Market Analysis
- United States
- Pricing Analysis
- Market Share Analysis, 2024
- By Engine Capacity
- By Power Output
- By Fuel Type
- By Application
- Canada
- Pricing Analysis
- Market Share Analysis, 2024
- By Engine Capacity
- By Power Output
- By Fuel Type
- By Application
- Germany
- Pricing Analysis
- Market Share Analysis, 2024
- By Engine Capacity
- By Power Output
- By Fuel Type
- By Application
- Australia
- Pricing Analysis
- Market Share Analysis, 2024
- By Engine Capacity
- By Power Output
- By Fuel Type
- By Application
- Japan
- Pricing Analysis
- Market Share Analysis, 2024
- By Engine Capacity
- By Power Output
- By Fuel Type
- By Application
- United States
- Market Structure Analysis
- Competition Dashboard
- Competition Benchmarking
- Market Share Analysis of Top Players
- By Regional
- By Engine Capacity
- By Power Output
- By Fuel Type
- By Application
- Competition Analysis
- Competition Deep Dive
- ASV Holdings Inc.
- Overview
- Product Portfolio
- Profitability by Market Segments (Product/Age /Sales Channel/Region)
- Sales Footprint
- Strategy Overview
- Marketing Strategy
- Product Strategy
- Channel Strategy
- Bobcat Company, Inc.
- Overview
- Product Portfolio
- Profitability by Market Segments (Product/Age /Sales Channel/Region)
- Sales Footprint
- Strategy Overview
- Marketing Strategy
- Product Strategy
- Channel Strategy
- CNH Industrial Inc.
- Overview
- Product Portfolio
- Profitability by Market Segments (Product/Age /Sales Channel/Region)
- Sales Footprint
- Strategy Overview
- Marketing Strategy
- Product Strategy
- Channel Strategy
- Caterpillar Inc.
- Overview
- Product Portfolio
- Profitability by Market Segments (Product/Age /Sales Channel/Region)
- Sales Footprint
- Strategy Overview
- Marketing Strategy
- Product Strategy
- Channel Strategy
- Manitou
- Overview
- Product Portfolio
- Profitability by Market Segments (Product/Age /Sales Channel/Region)
- Sales Footprint
- Strategy Overview
- Marketing Strategy
- Product Strategy
- Channel Strategy
- IHI Construction Machinery Limited
- Overview
- Product Portfolio
- Profitability by Market Segments (Product/Age /Sales Channel/Region)
- Sales Footprint
- Strategy Overview
- Marketing Strategy
- Product Strategy
- Channel Strategy
- JCB Inc.
- Overview
- Product Portfolio
- Profitability by Market Segments (Product/Age /Sales Channel/Region)
- Sales Footprint
- Strategy Overview
- Marketing Strategy
- Product Strategy
- Channel Strategy
- Deere & Co.
- Overview
- Product Portfolio
- Profitability by Market Segments (Product/Age /Sales Channel/Region)
- Sales Footprint
- Strategy Overview
- Marketing Strategy
- Product Strategy
- Channel Strategy
- Kubota Corporation
- Overview
- Product Portfolio
- Profitability by Market Segments (Product/Age /Sales Channel/Region)
- Sales Footprint
- Strategy Overview
- Marketing Strategy
- Product Strategy
- Channel Strategy
- Takeuchi Mfg Co. Ltd.
- Overview
- Product Portfolio
- Profitability by Market Segments (Product/Age /Sales Channel/Region)
- Sales Footprint
- Strategy Overview
- Marketing Strategy
- Product Strategy
- Channel Strategy
- Volvo AB
- Overview
- Product Portfolio
- Profitability by Market Segments (Product/Age /Sales Channel/Region)
- Sales Footprint
- Strategy Overview
- Marketing Strategy
- Product Strategy
- Channel Strategy
- Wacker Neuson SE
- Overview
- Product Portfolio
- Profitability by Market Segments (Product/Age /Sales Channel/Region)
- Sales Footprint
- Strategy Overview
- Marketing Strategy
- Product Strategy
- Channel Strategy
- Yanmar Co. Ltd.
- Overview
- Product Portfolio
- Profitability by Market Segments (Product/Age /Sales Channel/Region)
- Sales Footprint
- Strategy Overview
- Marketing Strategy
- Product Strategy
- Channel Strategy
- ASV Holdings Inc.
- Competition Deep Dive
- Assumptions & Acronyms Used
- Research Methodology
List Of Table
- Table 1: Global Market Value (USD Bn) Forecast by Region, 2020 to 2035
- Table 2: Global Market Volume (Units) Forecast by Region, 2020 to 2035
- Table 3: Global Market Value (USD Bn) Forecast by Engine Capacity, 2020 to 2035
- Table 4: Global Market Volume (Units) Forecast by Engine Capacity, 2020 to 2035
- Table 5: Global Market Value (USD Bn) Forecast by Power Output, 2020 to 2035
- Table 6: Global Market Volume (Units) Forecast by Power Output, 2020 to 2035
- Table 7: Global Market Value (USD Bn) Forecast by Fuel Type, 2020 to 2035
- Table 8: Global Market Volume (Units) Forecast by Fuel Type, 2020 to 2035
- Table 9: Global Market Value (USD Bn) Forecast by Application, 2020 to 2035
- Table 10: Global Market Volume (Units) Forecast by Application, 2020 to 2035
- Table 11: North America Market Value (USD Bn) Forecast by Country, 2020 to 2035
- Table 12: North America Market Volume (Units) Forecast by Country, 2020 to 2035
- Table 13: North America Market Value (USD Bn) Forecast by Engine Capacity, 2020 to 2035
- Table 14: North America Market Volume (Units) Forecast by Engine Capacity, 2020 to 2035
- Table 15: North America Market Value (USD Bn) Forecast by Power Output, 2020 to 2035
- Table 16: North America Market Volume (Units) Forecast by Power Output, 2020 to 2035
- Table 17: North America Market Value (USD Bn) Forecast by Fuel Type, 2020 to 2035
- Table 18: North America Market Volume (Units) Forecast by Fuel Type, 2020 to 2035
- Table 19: North America Market Value (USD Bn) Forecast by Application, 2020 to 2035
- Table 20: North America Market Volume (Units) Forecast by Application, 2020 to 2035
- Table 21: Latin America Market Value (USD Bn) Forecast by Country, 2020 to 2035
- Table 22: Latin America Market Volume (Units) Forecast by Country, 2020 to 2035
- Table 23: Latin America Market Value (USD Bn) Forecast by Engine Capacity, 2020 to 2035
- Table 24: Latin America Market Volume (Units) Forecast by Engine Capacity, 2020 to 2035
- Table 25: Latin America Market Value (USD Bn) Forecast by Power Output, 2020 to 2035
- Table 26: Latin America Market Volume (Units) Forecast by Power Output, 2020 to 2035
- Table 27: Latin America Market Value (USD Bn) Forecast by Fuel Type, 2020 to 2035
- Table 28: Latin America Market Volume (Units) Forecast by Fuel Type, 2020 to 2035
- Table 29: Latin America Market Value (USD Bn) Forecast by Application, 2020 to 2035
- Table 30: Latin America Market Volume (Units) Forecast by Application, 2020 to 2035
- Table 31: Western Europe Market Value (USD Bn) Forecast by Country, 2020 to 2035
- Table 32: Western Europe Market Volume (Units) Forecast by Country, 2020 to 2035
- Table 33: Western Europe Market Value (USD Bn) Forecast by Engine Capacity, 2020 to 2035
- Table 34: Western Europe Market Volume (Units) Forecast by Engine Capacity, 2020 to 2035
- Table 35: Western Europe Market Value (USD Bn) Forecast by Power Output, 2020 to 2035
- Table 36: Western Europe Market Volume (Units) Forecast by Power Output, 2020 to 2035
- Table 37: Western Europe Market Value (USD Bn) Forecast by Fuel Type, 2020 to 2035
- Table 38: Western Europe Market Volume (Units) Forecast by Fuel Type, 2020 to 2035
- Table 39: Western Europe Market Value (USD Bn) Forecast by Application, 2020 to 2035
- Table 40: Western Europe Market Volume (Units) Forecast by Application, 2020 to 2035
- Table 41: East Asia Market Value (USD Bn) Forecast by Country, 2020 to 2035
- Table 42: East Asia Market Volume (Units) Forecast by Country, 2020 to 2035
- Table 43: East Asia Market Value (USD Bn) Forecast by Engine Capacity, 2020 to 2035
- Table 44: East Asia Market Volume (Units) Forecast by Engine Capacity, 2020 to 2035
- Table 45: East Asia Market Value (USD Bn) Forecast by Power Output, 2020 to 2035
- Table 46: East Asia Market Volume (Units) Forecast by Power Output, 2020 to 2035
- Table 47: East Asia Market Value (USD Bn) Forecast by Fuel Type, 2020 to 2035
- Table 48: East Asia Market Volume (Units) Forecast by Fuel Type, 2020 to 2035
- Table 49: East Asia Market Value (USD Bn) Forecast by Application, 2020 to 2035
- Table 50: East Asia Market Volume (Units) Forecast by Application, 2020 to 2035
- Table 51: South Asia Pacific Market Value (USD Bn) Forecast by Country, 2020 to 2035
- Table 52: South Asia Pacific Market Volume (Units) Forecast by Country, 2020 to 2035
- Table 53: South Asia Pacific Market Value (USD Bn) Forecast by Engine Capacity, 2020 to 2035
- Table 54: South Asia Pacific Market Volume (Units) Forecast by Engine Capacity, 2020 to 2035
- Table 55: South Asia Pacific Market Value (USD Bn) Forecast by Power Output, 2020 to 2035
- Table 56: South Asia Pacific Market Volume (Units) Forecast by Power Output, 2020 to 2035
- Table 57: South Asia Pacific Market Value (USD Bn) Forecast by Fuel Type, 2020 to 2035
- Table 58: South Asia Pacific Market Volume (Units) Forecast by Fuel Type, 2020 to 2035
- Table 59: South Asia Pacific Market Value (USD Bn) Forecast by Application, 2020 to 2035
- Table 60: South Asia Pacific Market Volume (Units) Forecast by Application, 2020 to 2035
- Table 61: Eastern Europe Market Value (USD Bn) Forecast by Country, 2020 to 2035
- Table 62: Eastern Europe Market Volume (Units) Forecast by Country, 2020 to 2035
- Table 63: Eastern Europe Market Value (USD Bn) Forecast by Engine Capacity, 2020 to 2035
- Table 64: Eastern Europe Market Volume (Units) Forecast by Engine Capacity, 2020 to 2035
- Table 65: Eastern Europe Market Value (USD Bn) Forecast by Power Output, 2020 to 2035
- Table 66: Eastern Europe Market Volume (Units) Forecast by Power Output, 2020 to 2035
- Table 67: Eastern Europe Market Value (USD Bn) Forecast by Fuel Type, 2020 to 2035
- Table 68: Eastern Europe Market Volume (Units) Forecast by Fuel Type, 2020 to 2035
- Table 69: Eastern Europe Market Value (USD Bn) Forecast by Application, 2020 to 2035
- Table 70: Eastern Europe Market Volume (Units) Forecast by Application, 2020 to 2035
- Table 71: Middle East & Africa Market Value (USD Bn) Forecast by Country, 2020 to 2035
- Table 72: Middle East & Africa Market Volume (Units) Forecast by Country, 2020 to 2035
- Table 73: Middle East & Africa Market Value (USD Bn) Forecast by Engine Capacity, 2020 to 2035
- Table 74: Middle East & Africa Market Volume (Units) Forecast by Engine Capacity, 2020 to 2035
- Table 75: Middle East & Africa Market Value (USD Bn) Forecast by Power Output, 2020 to 2035
- Table 76: Middle East & Africa Market Volume (Units) Forecast by Power Output, 2020 to 2035
- Table 77: Middle East & Africa Market Value (USD Bn) Forecast by Fuel Type, 2020 to 2035
- Table 78: Middle East & Africa Market Volume (Units) Forecast by Fuel Type, 2020 to 2035
- Table 79: Middle East & Africa Market Value (USD Bn) Forecast by Application, 2020 to 2035
- Table 80: Middle East & Africa Market Volume (Units) Forecast by Application, 2020 to 2035
List Of Figures
- Figure 1: Global Market Volume (Units) Forecast 2020 to 2035
- Figure 2: Global Market Pricing Analysis
- Figure 3: Global Market Value (USD Bn) Forecast 2020 to 2035
- Figure 4: Global Market Value Share and BPS Analysis by Engine Capacity, 2025 and 2035
- Figure 5: Global Market Y-o-Y Growth Comparison by Engine Capacity, 2025 to 2035
- Figure 6: Global Market Attractiveness Analysis by Engine Capacity
- Figure 7: Global Market Value Share and BPS Analysis by Power Output, 2025 and 2035
- Figure 8: Global Market Y-o-Y Growth Comparison by Power Output, 2025 to 2035
- Figure 9: Global Market Attractiveness Analysis by Power Output
- Figure 10: Global Market Value Share and BPS Analysis by Fuel Type, 2025 and 2035
- Figure 11: Global Market Y-o-Y Growth Comparison by Fuel Type, 2025 to 2035
- Figure 12: Global Market Attractiveness Analysis by Fuel Type
- Figure 13: Global Market Value Share and BPS Analysis by Application, 2025 and 2035
- Figure 14: Global Market Y-o-Y Growth Comparison by Application, 2025 to 2035
- Figure 15: Global Market Attractiveness Analysis by Application
- Figure 16: Global Market Value (USD Bn) Share and BPS Analysis by Region, 2025 and 2035
- Figure 17: Global Market Y-o-Y Growth Comparison by Region, 2025 to 2035
- Figure 18: Global Market Attractiveness Analysis by Region
- Figure 19: North America Market Incremental $ Opportunity, 2025 to 2035
- Figure 20: Latin America Market Incremental $ Opportunity, 2025 to 2035
- Figure 21: Western Europe Market Incremental $ Opportunity, 2025 to 2035
- Figure 22: East Asia Market Incremental $ Opportunity, 2025 to 2035
- Figure 23: South Asia Pacific Market Incremental $ Opportunity, 2025 to 2035
- Figure 24: Eastern Europe Market Incremental $ Opportunity, 2025 to 2035
- Figure 25: Middle East & Africa Market Incremental $ Opportunity, 2025 to 2035
- Figure 26: North America Market Value Share and BPS Analysis by Country, 2025 and 2035
- Figure 27: North America Market Value Share and BPS Analysis by Engine Capacity, 2025 and 2035
- Figure 28: North America Market Y-o-Y Growth Comparison by Engine Capacity, 2025 to 2035
- Figure 29: North America Market Attractiveness Analysis by Engine Capacity
- Figure 30: North America Market Value Share and BPS Analysis by Power Output, 2025 and 2035
- Figure 31: North America Market Y-o-Y Growth Comparison by Power Output, 2025 to 2035
- Figure 32: North America Market Attractiveness Analysis by Power Output
- Figure 33: North America Market Value Share and BPS Analysis by Fuel Type, 2025 and 2035
- Figure 34: North America Market Y-o-Y Growth Comparison by Fuel Type, 2025 to 2035
- Figure 35: North America Market Attractiveness Analysis by Fuel Type
- Figure 36: North America Market Value Share and BPS Analysis by Application, 2025 and 2035
- Figure 37: North America Market Y-o-Y Growth Comparison by Application, 2025 to 2035
- Figure 38: North America Market Attractiveness Analysis by Application
- Figure 39: Latin America Market Value Share and BPS Analysis by Country, 2025 and 2035
- Figure 40: Latin America Market Value Share and BPS Analysis by Engine Capacity, 2025 and 2035
- Figure 41: Latin America Market Y-o-Y Growth Comparison by Engine Capacity, 2025 to 2035
- Figure 42: Latin America Market Attractiveness Analysis by Engine Capacity
- Figure 43: Latin America Market Value Share and BPS Analysis by Power Output, 2025 and 2035
- Figure 44: Latin America Market Y-o-Y Growth Comparison by Power Output, 2025 to 2035
- Figure 45: Latin America Market Attractiveness Analysis by Power Output
- Figure 46: Latin America Market Value Share and BPS Analysis by Fuel Type, 2025 and 2035
- Figure 47: Latin America Market Y-o-Y Growth Comparison by Fuel Type, 2025 to 2035
- Figure 48: Latin America Market Attractiveness Analysis by Fuel Type
- Figure 49: Latin America Market Value Share and BPS Analysis by Application, 2025 and 2035
- Figure 50: Latin America Market Y-o-Y Growth Comparison by Application, 2025 to 2035
- Figure 51: Latin America Market Attractiveness Analysis by Application
- Figure 52: Western Europe Market Value Share and BPS Analysis by Country, 2025 and 2035
- Figure 53: Western Europe Market Value Share and BPS Analysis by Engine Capacity, 2025 and 2035
- Figure 54: Western Europe Market Y-o-Y Growth Comparison by Engine Capacity, 2025 to 2035
- Figure 55: Western Europe Market Attractiveness Analysis by Engine Capacity
- Figure 56: Western Europe Market Value Share and BPS Analysis by Power Output, 2025 and 2035
- Figure 57: Western Europe Market Y-o-Y Growth Comparison by Power Output, 2025 to 2035
- Figure 58: Western Europe Market Attractiveness Analysis by Power Output
- Figure 59: Western Europe Market Value Share and BPS Analysis by Fuel Type, 2025 and 2035
- Figure 60: Western Europe Market Y-o-Y Growth Comparison by Fuel Type, 2025 to 2035
- Figure 61: Western Europe Market Attractiveness Analysis by Fuel Type
- Figure 62: Western Europe Market Value Share and BPS Analysis by Application, 2025 and 2035
- Figure 63: Western Europe Market Y-o-Y Growth Comparison by Application, 2025 to 2035
- Figure 64: Western Europe Market Attractiveness Analysis by Application
- Figure 65: East Asia Market Value Share and BPS Analysis by Country, 2025 and 2035
- Figure 66: East Asia Market Value Share and BPS Analysis by Engine Capacity, 2025 and 2035
- Figure 67: East Asia Market Y-o-Y Growth Comparison by Engine Capacity, 2025 to 2035
- Figure 68: East Asia Market Attractiveness Analysis by Engine Capacity
- Figure 69: East Asia Market Value Share and BPS Analysis by Power Output, 2025 and 2035
- Figure 70: East Asia Market Y-o-Y Growth Comparison by Power Output, 2025 to 2035
- Figure 71: East Asia Market Attractiveness Analysis by Power Output
- Figure 72: East Asia Market Value Share and BPS Analysis by Fuel Type, 2025 and 2035
- Figure 73: East Asia Market Y-o-Y Growth Comparison by Fuel Type, 2025 to 2035
- Figure 74: East Asia Market Attractiveness Analysis by Fuel Type
- Figure 75: East Asia Market Value Share and BPS Analysis by Application, 2025 and 2035
- Figure 76: East Asia Market Y-o-Y Growth Comparison by Application, 2025 to 2035
- Figure 77: East Asia Market Attractiveness Analysis by Application
- Figure 78: South Asia Pacific Market Value Share and BPS Analysis by Country, 2025 and 2035
- Figure 79: South Asia Pacific Market Value Share and BPS Analysis by Engine Capacity, 2025 and 2035
- Figure 80: South Asia Pacific Market Y-o-Y Growth Comparison by Engine Capacity, 2025 to 2035
- Figure 81: South Asia Pacific Market Attractiveness Analysis by Engine Capacity
- Figure 82: South Asia Pacific Market Value Share and BPS Analysis by Power Output, 2025 and 2035
- Figure 83: South Asia Pacific Market Y-o-Y Growth Comparison by Power Output, 2025 to 2035
- Figure 84: South Asia Pacific Market Attractiveness Analysis by Power Output
- Figure 85: South Asia Pacific Market Value Share and BPS Analysis by Fuel Type, 2025 and 2035
- Figure 86: South Asia Pacific Market Y-o-Y Growth Comparison by Fuel Type, 2025 to 2035
- Figure 87: South Asia Pacific Market Attractiveness Analysis by Fuel Type
- Figure 88: South Asia Pacific Market Value Share and BPS Analysis by Application, 2025 and 2035
- Figure 89: South Asia Pacific Market Y-o-Y Growth Comparison by Application, 2025 to 2035
- Figure 90: South Asia Pacific Market Attractiveness Analysis by Application
- Figure 91: Eastern Europe Market Value Share and BPS Analysis by Country, 2025 and 2035
- Figure 92: Eastern Europe Market Value Share and BPS Analysis by Engine Capacity, 2025 and 2035
- Figure 93: Eastern Europe Market Y-o-Y Growth Comparison by Engine Capacity, 2025 to 2035
- Figure 94: Eastern Europe Market Attractiveness Analysis by Engine Capacity
- Figure 95: Eastern Europe Market Value Share and BPS Analysis by Power Output, 2025 and 2035
- Figure 96: Eastern Europe Market Y-o-Y Growth Comparison by Power Output, 2025 to 2035
- Figure 97: Eastern Europe Market Attractiveness Analysis by Power Output
- Figure 98: Eastern Europe Market Value Share and BPS Analysis by Fuel Type, 2025 and 2035
- Figure 99: Eastern Europe Market Y-o-Y Growth Comparison by Fuel Type, 2025 to 2035
- Figure 100: Eastern Europe Market Attractiveness Analysis by Fuel Type
- Figure 101: Eastern Europe Market Value Share and BPS Analysis by Application, 2025 and 2035
- Figure 102: Eastern Europe Market Y-o-Y Growth Comparison by Application, 2025 to 2035
- Figure 103: Eastern Europe Market Attractiveness Analysis by Application
- Figure 104: Middle East & Africa Market Value Share and BPS Analysis by Country, 2025 and 2035
- Figure 105: Middle East & Africa Market Value Share and BPS Analysis by Engine Capacity, 2025 and 2035
- Figure 106: Middle East & Africa Market Y-o-Y Growth Comparison by Engine Capacity, 2025 to 2035
- Figure 107: Middle East & Africa Market Attractiveness Analysis by Engine Capacity
- Figure 108: Middle East & Africa Market Value Share and BPS Analysis by Power Output, 2025 and 2035
- Figure 109: Middle East & Africa Market Y-o-Y Growth Comparison by Power Output, 2025 to 2035
- Figure 110: Middle East & Africa Market Attractiveness Analysis by Power Output
- Figure 111: Middle East & Africa Market Value Share and BPS Analysis by Fuel Type, 2025 and 2035
- Figure 112: Middle East & Africa Market Y-o-Y Growth Comparison by Fuel Type, 2025 to 2035
- Figure 113: Middle East & Africa Market Attractiveness Analysis by Fuel Type
- Figure 114: Middle East & Africa Market Value Share and BPS Analysis by Application, 2025 and 2035
- Figure 115: Middle East & Africa Market Y-o-Y Growth Comparison by Application, 2025 to 2035
- Figure 116: Middle East & Africa Market Attractiveness Analysis by Application
- Figure 117: Global Market - Tier Structure Analysis
- Figure 118: Global Market - Company Share Analysis
- FAQs -
What is the Global Compact Track Loader Market Size in 2025?
The compact track loader market is valued at USD 3.6 billion in 2025.
Who are the Major Players Operating in the Compact Track Loader Market?
Prominent players in the market include CNH Industrial Inc., Caterpillar Inc., Manitou, IHI Construction Machinery Limited, JCB Inc., and Deere & Co.
What is the Estimated Valuation of the Compact Track Loader Market by 2035?
The market is expected to reach a valuation of USD 5.2 billion by 2035.
What Value CAGR is the Compact Track Loader Market Exhibit Over the Last Five years?
The historic growth rate of the compact track loader market was 2.6% from 2020 to 2024.