Interactive Display Market

Interactive Display Market Analysis, By Product Type (White Boards, Flat Panel Displays, Projectors, Monitors, and Others), By End User, By Size, and Region - Market Insights 2025 to 2035

The White Boards segment is projected to grow at a CAGR of 6.5%, whereas another segment Flat Panel Displays is likely to grow at 10.0%. In terms of countries U.S. is projected to grow at 8.3%, followed by China at 9.7% and South Korea to grow at 7.0%.

Interactive Display Market Outlook (2025 to 2035)

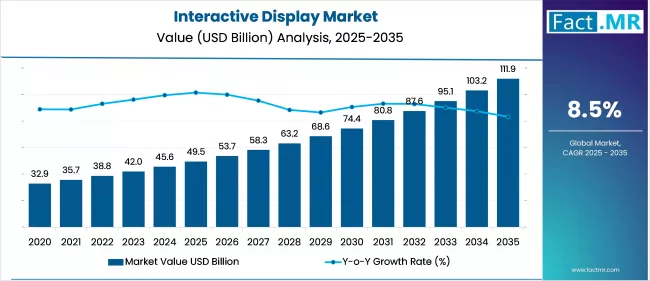
The global interactive display market is expected to reach USD 111.9 billion by 2035, up from USD 45.9 billion in 2024. During the forecast period (2025-2035), the industry is projected to register a CAGR of 8.5%.

The high digitization of education, the corporate sector, hybrid work adoption, and government-backed digital literacy initiatives are driving demand for interactive displays. Advancements in 4K, OLED, and touch technology further boost adoption across healthcare, retail, and transport for real-time engagement.

Interactive Display Market Value Analysis 2025 To 2035

What are the drivers of interactive display market?

The growing digitization rate of learning institutions and corporate offices is significantly impacting the interactive display market. The increasing use of smart classrooms and virtual learning environments is encouraging schools and universities in various regions to adopt interactive whiteboards and flat panels to enhance teaching effectiveness.

Likewise, in the business sector, an increase in the hybrid working mode and the need for collaborative digital tools stimulate investment in smart meeting rooms equipped with touchscreen-enabled displays. The development of display technologies, such as 4K UHD, OLED, and capacitive touch, is also enhancing the devices, making them more responsive, visually appealing, and easy to use.

This increases their uptake in other industries, such as healthcare, retail, and transport sectors, where seamless and immediate engagement and visibility are vital. The inclusion of smart city infrastructure and digital literacy programs by the government, particularly in developing countries, further contributes to the demand for interactive kiosks and tables.

With customer engagement at the forefront of many industries, the ability of these systems to deliver both visual aesthetic and real-time interactions places them as crucial assets to the contemporary digital economy.

What are the regional trends of interactive display market?

The North American market for interactive displays is experiencing steady growth, driven by strong demand in the education and enterprise sectors. Interactive whiteboards and flat panels are gaining traction in U.S. schools, supported by digital learning infrastructure investments from the government. Collaborative displays are being adopted in tech-based workspaces, enabling a smooth, remote, and hybrid conference experience.

Europe follows a similar trajectory, particularly in corporate boardrooms and through government-led digitalization initiatives in countries such as Germany and the U.K. In East Asia, including China, South Korea, and Japan, the market is advancing with the production and application of high-end touch displays in retail and transportation. The digital reforms of education in China and the expansion of smart city initiatives improve market growth.

South Asia and Oceania are high-growth regions, with digital classroom adoption increasing in India and Australia. There is an increasing adoption of digitalization in the Middle East and African regions, especially in the public sector and smart healthcare systems.

In Latin America, there is growing interest in interactive solutions for retail, banking, and government environments, influenced by ongoing urbanization and the need for customer-facing digital touchpoints.

What are the challenges and restraining factors of interactive display market?

The interactive display market presents several challenges, although its future outlook remains positive. High prices of advanced displays, particularly those with 4K resolution, OLED panels, or multi-touch functionality, continue to be a significant barrier for small businesses and underfunded educational institutions. The overall ownership costs, including maintenance, upgrades, and software licenses, are often uneconomic, discouraging mass usage.

The technical complexity of integrating interactive displays with existing IT infrastructure is another limitation. Emerging markets lack proper digital setups and user training, which hinders effective use. Additionally, the desire to implement the technology on connected displays in corporate and other environments raises concerns regarding data confidentiality and regulatory compliance.

Display durability is a concern, especially in public installations or retail settings with high usage. Additionally, the semiconductor supply chain impacts the market, and disruptions can lead to shortages or price increases for products. The issue of e-waste and the energy use of large screens also causes long-term sustainability concerns.

Country-Wise Outlook

Education Digitization and Corporate Hybridization Fuel U.S. Demand

Interactive Display Market Country Wise Analysis Cagr 2025 To 2035

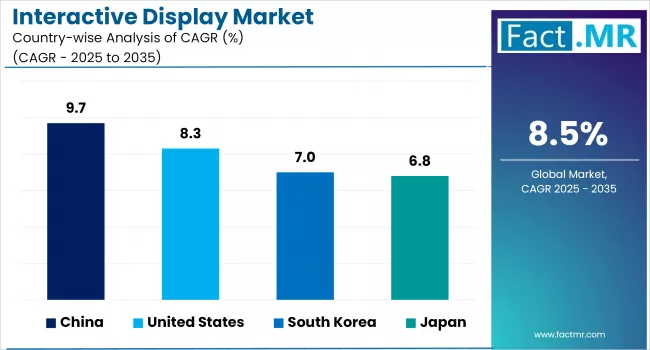
The United States leads the interactive display market. The country accounts for a significant portion of global purchases, with rapid adoption of interactive displays in K-12 schools, higher education, corporate boardrooms and government agencies. Further growth is supported by federal and state investments in educational technology, including the E-Rate Program and the CARES Act funds, resulting in increasing deployments in public institutions.

US Interactive Display Market Value (USD Million) Analysis 2025 To 2035

U.S. brands are primarily focused on integrating software, cloud-based collaboration tools, and enhancing interactivity with the help of AI. The business sector utilizes touch screens with the integration of gesture control and real-time presentation annotation. Key industry participants, such as SMART Technologies and ViewSonic, are enhancing the integration of Microsoft Teams and Zoom, which drives adoption in SMBs.

Smart Classrooms and Corporate Hubs Drive Growth in China

China has a dominant share in volume-based production and deployment of interactive displays. Interactive flat panels (IFPs) are being introduced across public schools and vocational institutions in Tier I and Tier II Cities, with the vision of a Smart Campus. Domestic companies such as Huawei and Hisense are incorporating AI-powered handwriting recognition, voice-activated content sharing, and cloud synchronization.

The corporate sector in China, particularly within the financial, technology, and telecom industries, is integrating interactive displays into smart boardrooms with face biometric access and control systems interconnected to the IoT. The growing demand for bilingual instruction and the accelerated expansion of digital curricula are also contributing to increased adoption in the education sector.

Innovation-Focused Ecosystem Accelerates Uptake in South Korea

South Korea is recognized for its innovative and advanced infrastructure. Emphasis on the Digital New Deal and smart school changes by the government facilitates the widespread use of interactive displays in both public and commercial education.

STEM and coding lessons are transitioning toward high-resolution interactive touch systems with stylus latency of less than 10 milliseconds. Korean manufacturers are at the frontier of OLED/LED development, offering thin-bezel panels with ultra-HD capability that can support both the learning and business industries.

The corporate world is adopting next-generation conference room technologies, incorporating sensors and wireless connectivity to enable collaborations across several devices. The increasing demand for healthcare facilities, museums, and transportation centers also contributes to market expansion.

Category-Wise Analysis

Flat Panel Displays Dominate as Core Hardware for Interactive Learning and Collaboration

Interactive Display Market Analysis By Product Type

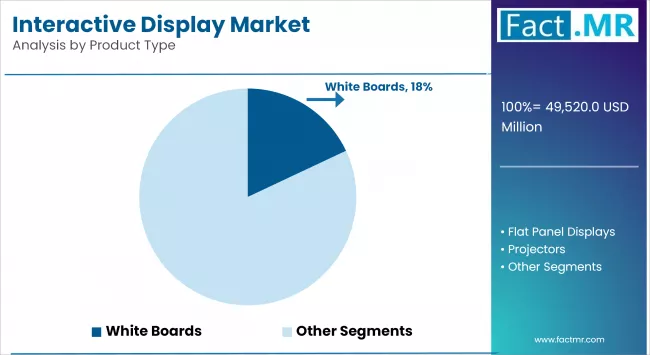
The interactive display market has established flat panel products as the primary product category, driven by the versatility of these products, their high-resolution outputs, and the declining cost per inch. Such displays are the core components of interactive whiteboards and digital signage, which are essential in educational and business settings.

With advancements in touchscreen responsiveness and multi-user interaction, flat panels are being increasingly deployed in collaborative spaces, such as classrooms, training rooms, and hybrid work environments. Their long operational lifespan further supports their adoption in tech-savvy institutions, low energy consumption and their ability to deliver 4K and even 8K content.

Education Sector Fuels Demand for Smart Displays in Digitized Classrooms

Interactive Display Market Analysis By End User

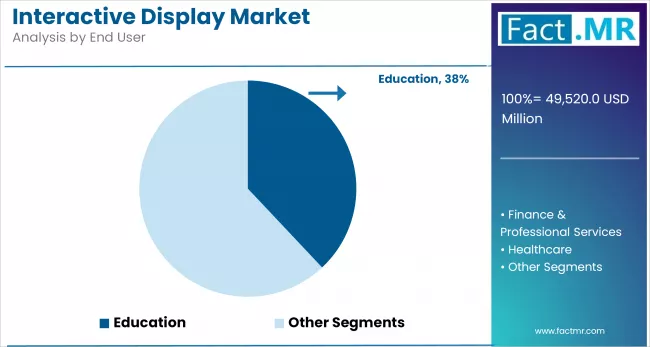
The end-user category that has maintained a leading position in the interactive display market is education, as schools across various regions continue to integrate digital tools into pedagogy and blended learning models. Educational institutions are utilizing these displays to enhance student engagement, facilitate real-time collaboration, and support the delivery of interactive content.

School boards and governments in North America, Europe, and some parts of the Asia-Pacific are investing in educational technology infrastructure, such as interactive flat panels, to fill the digital learning gaps. They also facilitate the promotion of inclusive education by accommodating visual, auditory, and kinesthetic learner tools, making them a fundamental component of modern academic environments.

Compact Interactive Displays (<32 IN) Gain Traction in Space-Constrained and Personalized Setups

Displays smaller than 32 inches are addressed to niche applications, including personal learning stations, portable teaching tools, and retail interaction kiosks. Such compact systems are well-suited in areas that require space efficiency, such as small classrooms, tutoring centers, and e-learning pods. They also gain recognition in early childhood education settings, where the screen size and interface should be adapted to meet the needs of young users.

Competitive Analysis

The interactive display industry is characterized by increasing competition, influenced by rapid technological advancement and growing demand across the education, corporate, retail, and healthcare sectors. The introduction of products, being the differentiating factor among players, focuses on features such as advanced resolution, multi-touch capacity, stylus responsiveness, and built-in software platforms that enable remote cooperation and learning.

Research and development efforts are also shifting toward eco-friendly materials and energy-efficient designs. In the education sector, traditional whiteboards are being gradually replaced by interactive flat panels in schools and universities as digital learning continues to expand. Concurrently, the corporate sector is shifting toward the use of displays that are combined with cloud-based videoconferencing solutions and artificial intelligence-based collaboration tools.

Local vendors are gaining momentum by offering cost-effective, compliant solutions that align with institutional requirements. Emerging markets are price-sensitive, promoting value-driven market shares, whereas in traditional economies, premium features and bundled services influence competitive positioning.

Positioning of vendors is also determined by strategic partnerships with software providers and schools. Furthermore, the reducing hardware prices and customization possibilities through modularity are enabling new entrants, intensifying competition, and prompting ongoing innovation cycles to retain user engagement and support long-term customer loyalty.

Key players in the interactive display industry are BenQ Corporation, IntuiLab SA, Google Inc., Samsung Display Co. Ltd., Egan Teamboard Inc., SMART Technologies, Crystal Display Systems Ltd., Cisco Systems Inc., Hitachi Ltd., Planar Systems Inc., LG Display Co. Ltd., ViewSonic Corporation, Microsoft Corp, Epson America Inc., NEC Display Solutions Ltd., Panasonic Corporation, and other players.

Recent Development

  • In February 2025, at Integrated Systems Europe (ISE) 2025, Samsung introduced the WAF Interactive Display (model WAFX-P) and a 105-inch 5K UHD Smart Signage (model QPD-5K), showcasing advancements in display technology aimed at enhancing user experiences in various sectors.
  • In September 2024, BenQ updated its interactive displays to include ClassroomCare® features, focusing on health and safety in educational environments. Enhancements include antimicrobial screens, air quality sensors, and low-blue-light technology to promote a healthier classroom environment.

Fact.MR has provided detailed information about the price points of key manufacturers of the interactive display market positioned across regions, sales growth, production capacity, and speculative technological expansion, in the recently published report.

Methodology and Industry Tracking Approach

Surveys by Fact.MR conducted in 2025 surveyed about 3,800 confirmed stakeholders in 18 countries on the interactive display market. Closed in October 2020, the survey captured feedback of at least 90 seasoned respondents in each participating country, that is, interactive UX designers, display panel engineers, and education-tech experts.

The major market trends from July 2024 to June 2025 included the emergence of whiteboarding tools enabled by AI, an increase in demand for energy-efficient interactive flat panels, and the addition of voice-activated collaboration to the composition. Hybrid innovations, such as wireless screen-sharing hubs and dynamic content-driven displays, are transforming user interactions in both training and professional domains.

Fact.MR has been monitoring changes in panel durability, touch speed advancements, and interactive OS since 2018. Such pivots in the recent past have comprised smooth cloud-synced functionality, flexible interactive layouts meant to support mobile implementation, and innovative haptic-feedback display surfaces that ensure the enhancement of accessibility and engaging learning experiences in most industries.

Segmentation of Interactive display market

  • By Product Type :

    • White Boards
    • Flat Panel Displays
    • Projectors
    • Tables
    • Monitors
    • Kiosks
    • Others
  • By End User :

    • Education
    • Finance & Professional Services
    • Healthcare
    • Retail
    • Hospitality & Leisure
    • Travel & Transportation
    • Other End Users
  • By Size :

    • Less than 32 IN
    • 33 IN - 42 IN
    • 43 IN - 55 IN
    • 56 IN - 65 IN
    • 66 IN - 70 IN
    • 71 IN - 80 IN
    • 81 IN - 90 IN
    • Over 90 IN
  • By Region :

    • North America
    • Latin America
    • Western Europe
    • Eastern Europe
    • East Asia
    • South Asia & Pacific
    • Middle East & Africa

Table of Content

  1. Executive Summary
    • Global Market Outlook
    • Demand-side Trends
    • Supply-side Trends
    • Technology Roadmap Analysis
    • Analysis and Recommendations
  2. Market Overview
    • Market Coverage / Taxonomy
    • Market Definition / Scope / Limitations
  3. Market Background
    • Market Dynamics
      • Drivers
      • Restraints
      • Opportunity
      • Trends
    • Scenario Forecast
      • Demand in Optimistic Scenario
      • Demand in Likely Scenario
      • Demand in Conservative Scenario
    • Opportunity Map Analysis
    • Product Life Cycle Analysis
    • Supply Chain Analysis
      • Supply Side Participants and their Roles
        • Producers
        • Mid-Level Participants (Traders/ Agents/ Brokers)
        • Wholesalers and Distributors
      • Value Added and Value Created at Node in the Supply Chain
      • List of Component Suppliers
      • List of Existing and Potential Buyers
    • Investment Feasibility Matrix
    • Value Chain Analysis
      • Profit Margin Analysis
      • Wholesalers and Distributors
      • Retailers
    • PESTLE and Porter’s Analysis
    • Regulatory Landscape
      • By Key Regions
      • By Key Countries
    • Production and Consumption Statistics
    • Import and Export Statistics
  4. Global Market Analysis 2020 to 2024 and Forecast, 2025 to 2035
    • Historical Market Size Value (USD Mn) & Volume (Units) Analysis, 2020 to 2024
    • Current and Future Market Size Value (USD Mn) & Volume (Units) Projections, 2025 to 2035
      • Y-o-Y Growth Trend Analysis
      • Absolute $ Opportunity Analysis
  5. Global Market Pricing Analysis 2020 to 2024 and Forecast 2025 to 2035
  6. Global Market Analysis 2020 to 2024 and Forecast 2025 to 2035, By Product Type
    • Introduction / Key Findings
    • Historical Market Size Value (USD Mn) & Volume (Units) Analysis By Product Type, 2020 to 2024
    • Current and Future Market Size Value (USD Mn) & Volume (Units) Analysis and Forecast By Product Type, 2025 to 2035
      • White Boards
      • Flat Panel Displays
      • Projectors
      • Tables
      • Monitors
      • Kiosks
      • Others
    • Y-o-Y Growth Trend Analysis By Product Type, 2020 to 2024
    • Absolute $ Opportunity Analysis By Product Type, 2025 to 2035
  7. Global Market Analysis 2020 to 2024 and Forecast 2025 to 2035, By End User
    • Introduction / Key Findings
    • Historical Market Size Value (USD Mn) & Volume (Units) Analysis By End User, 2020 to 2024
    • Current and Future Market Size Value (USD Mn) & Volume (Units) Analysis and Forecast By End User, 2025 to 2035
      • Education
      • Finance & Professional Services
      • Healthcare
      • Retail
      • Hospitality & Leisure
      • Travel & Transportation
      • Other End Users
    • Y-o-Y Growth Trend Analysis By End User, 2020 to 2024
    • Absolute $ Opportunity Analysis By End User, 2025 to 2035
  8. Global Market Analysis 2020 to 2024 and Forecast 2025 to 2035, By Size
    • Introduction / Key Findings
    • Historical Market Size Value (USD Mn) & Volume (Units) Analysis By Size, 2020 to 2024
    • Current and Future Market Size Value (USD Mn) & Volume (Units) Analysis and Forecast By Size, 2025 to 2035
      • Less than 32 IN
      • 33 IN – 42 IN
      • 43 IN – 55 IN
      • 56 IN – 65 IN
      • 66 IN – 70 IN
      • 71 IN – 80 IN
      • 81 IN – 90 IN
      • Over 90 IN
    • Y-o-Y Growth Trend Analysis By Size, 2020 to 2024
    • Absolute $ Opportunity Analysis By Size, 2025 to 2035
  9. Global Market Analysis 2020 to 2024 and Forecast 2025 to 2035, By Region
    • Introduction
    • Historical Market Size Value (USD Mn) & Volume (Units) Analysis By Region, 2020 to 2024
    • Current Market Size Value (USD Mn) & Volume (Units) Analysis and Forecast By Region, 2025 to 2035
      • North America
      • Latin America
      • Western Europe
      • East Asia
      • South Asia Pacific
      • Eastern Europe
      • Middle East & Africa
    • Market Attractiveness Analysis By Region
  10. North America Market Analysis 2020 to 2024 and Forecast 2025 to 2035, By Country
    • Historical Market Size Value (USD Mn) & Volume (Units) Trend Analysis By Market Taxonomy, 2020 to 2024
    • Market Size Value (USD Mn) & Volume (Units) Forecast By Market Taxonomy, 2025 to 2035
      • By Country
        • U.S.
        • Canada
        • Mexico
      • By Product Type
      • By End User
      • By Size
    • Market Attractiveness Analysis
      • By Country
      • By Product Type
      • By End User
      • By Size
    • Key Takeaways
  11. Latin America Market Analysis 2020 to 2024 and Forecast 2025 to 2035, By Country
    • Historical Market Size Value (USD Mn) & Volume (Units) Trend Analysis By Market Taxonomy, 2020 to 2024
    • Market Size Value (USD Mn) & Volume (Units) Forecast By Market Taxonomy, 2025 to 2035
      • By Country
        • Brazil
        • Chile
        • Rest of Latin America
      • By Product Type
      • By End User
      • By Size
    • Market Attractiveness Analysis
      • By Country
      • By Product Type
      • By End User
      • By Size
    • Key Takeaways
  12. Western Europe Market Analysis 2020 to 2024 and Forecast 2025 to 2035, By Country
    • Historical Market Size Value (USD Mn) & Volume (Units) Trend Analysis By Market Taxonomy, 2020 to 2024
    • Market Size Value (USD Mn) & Volume (Units) Forecast By Market Taxonomy, 2025 to 2035
      • By Country
        • Germany
        • Italy
        • France
        • U.K.
        • Spain
        • Russia
        • BENELUX
        • Rest of Europe
      • By Product Type
      • By End User
      • By Size
    • Market Attractiveness Analysis
      • By Country
      • By Product Type
      • By End User
      • By Size
    • Key Takeaways
  13. East Asia Market Analysis 2020 to 2024 and Forecast 2025 to 2035, By Country
    • Historical Market Size Value (USD Mn) & Volume (Units) Trend Analysis By Market Taxonomy, 2020 to 2024
    • Market Size Value (USD Mn) & Volume (Units) Forecast By Market Taxonomy, 2025 to 2035
      • By Country
        • China
        • Japan
        • South Korea
      • By Product Type
      • By End User
      • By Size
    • Market Attractiveness Analysis
      • By Country
      • By Product Type
      • By End User
      • By Size
    • Key Takeaways
  14. South Asia Pacific Market Analysis 2020 to 2024 and Forecast 2025 to 2035, By Country
    • Historical Market Size Value (USD Mn) & Volume (Units) Trend Analysis By Market Taxonomy, 2020 to 2024
    • Market Size Value (USD Mn) & Volume (Units) Forecast By Market Taxonomy, 2025 to 2035
      • By Country
        • India
        • ASEAN Countries
        • Australia & New Zealand
        • Rest of South Asia Pacific
      • By Product Type
      • By End User
      • By Size
    • Market Attractiveness Analysis
      • By Country
      • By Product Type
      • By End User
      • By Size
    • Key Takeaways
  15. Eastern Europe Market Analysis 2020 to 2024 and Forecast 2025 to 2035, By Country
    • Historical Market Size Value (USD Mn) & Volume (Units) Trend Analysis By Market Taxonomy, 2020 to 2024
    • Market Size Value (USD Mn) & Volume (Units) Forecast By Market Taxonomy, 2025 to 2035
      • By Country
        • Russia
        • Poland
        • Hungary
        • Balkan & Baltics
        • Rest of Eastern Europe
      • By Product Type
      • By End User
      • By Size
    • Market Attractiveness Analysis
      • By Country
      • By Product Type
      • By End User
      • By Size
    • Key Takeaways
  16. Middle East & Africa Market Analysis 2020 to 2024 and Forecast 2025 to 2035, By Country
    • Historical Market Size Value (USD Mn) & Volume (Units) Trend Analysis By Market Taxonomy, 2020 to 2024
    • Market Size Value (USD Mn) & Volume (Units) Forecast By Market Taxonomy, 2025 to 2035
      • By Country
        • KSA
        • Other GCC Countries
        • Turkiye
        • South Africa
        • Rest of MEA
      • By Product Type
      • By End User
      • By Size
    • Market Attractiveness Analysis
      • By Country
      • By Product Type
      • By End User
      • By Size
    • Key Takeaways
  17. Key Countries Market Analysis
    • Value (USD Mn) & Volume (Units)ed States
      • Pricing Analysis
      • Market Share Analysis, 2024
        • By Product Type
        • By End User
        • By Size
    • China
      • Pricing Analysis
      • Market Share Analysis, 2024
        • By Product Type
        • By End User
        • By Size
    • South Korea
      • Pricing Analysis
      • Market Share Analysis, 2024
        • By Product Type
        • By End User
        • By Size
    • Japan
      • Pricing Analysis
      • Market Share Analysis, 2024
        • By Product Type
        • By End User
        • By Size
  18. Market Structure Analysis
    • Competition Dashboard
    • Competition Benchmarking
    • Market Share Analysis of Top Players
      • By Regional
      • By Product Type
      • By End User
      • By Size
  19. Competition Analysis
    • Competition Deep Dive
      • BenQ Corporation
        • Overview
        • Product Portfolio
        • Profitability by Market Segments (Product/Age /Sales Channel/Region)
        • Sales Footprint
        • Strategy Overview
          • Marketing Strategy
          • Product Strategy
          • Channel Strategy
      • IntuiLab SA
        • Overview
        • Product Portfolio
        • Profitability by Market Segments (Product/Age /Sales Channel/Region)
        • Sales Footprint
        • Strategy Overview
          • Marketing Strategy
          • Product Strategy
          • Channel Strategy
      • Google Inc.
        • Overview
        • Product Portfolio
        • Profitability by Market Segments (Product/Age /Sales Channel/Region)
        • Sales Footprint
        • Strategy Overview
          • Marketing Strategy
          • Product Strategy
          • Channel Strategy
      • Samsung Display Co. Ltd.
        • Overview
        • Product Portfolio
        • Profitability by Market Segments (Product/Age /Sales Channel/Region)
        • Sales Footprint
        • Strategy Overview
          • Marketing Strategy
          • Product Strategy
          • Channel Strategy
      • Egan Teamboard Inc.
        • Overview
        • Product Portfolio
        • Profitability by Market Segments (Product/Age /Sales Channel/Region)
        • Sales Footprint
        • Strategy Overview
          • Marketing Strategy
          • Product Strategy
          • Channel Strategy
      • SMART Technologies
        • Overview
        • Product Portfolio
        • Profitability by Market Segments (Product/Age /Sales Channel/Region)
        • Sales Footprint
        • Strategy Overview
          • Marketing Strategy
          • Product Strategy
          • Channel Strategy
      • Crystal Display Systems Ltd.
        • Overview
        • Product Portfolio
        • Profitability by Market Segments (Product/Age /Sales Channel/Region)
        • Sales Footprint
        • Strategy Overview
          • Marketing Strategy
          • Product Strategy
          • Channel Strategy
      • Cisco Systems Inc.
        • Overview
        • Product Portfolio
        • Profitability by Market Segments (Product/Age /Sales Channel/Region)
        • Sales Footprint
        • Strategy Overview
          • Marketing Strategy
          • Product Strategy
          • Channel Strategy
      • Hitachi Ltd.
        • Overview
        • Product Portfolio
        • Profitability by Market Segments (Product/Age /Sales Channel/Region)
        • Sales Footprint
        • Strategy Overview
          • Marketing Strategy
          • Product Strategy
          • Channel Strategy
      • Planar Systems Inc.
        • Overview
        • Product Portfolio
        • Profitability by Market Segments (Product/Age /Sales Channel/Region)
        • Sales Footprint
        • Strategy Overview
          • Marketing Strategy
          • Product Strategy
          • Channel Strategy
      • LG Display Co. Ltd.
        • Overview
        • Product Portfolio
        • Profitability by Market Segments (Product/Age /Sales Channel/Region)
        • Sales Footprint
        • Strategy Overview
          • Marketing Strategy
          • Product Strategy
          • Channel Strategy
      • ViewSonic Corporation
        • Overview
        • Product Portfolio
        • Profitability by Market Segments (Product/Age /Sales Channel/Region)
        • Sales Footprint
        • Strategy Overview
          • Marketing Strategy
          • Product Strategy
          • Channel Strategy
      • Microsoft Corp
        • Overview
        • Product Portfolio
        • Profitability by Market Segments (Product/Age /Sales Channel/Region)
        • Sales Footprint
        • Strategy Overview
          • Marketing Strategy
          • Product Strategy
          • Channel Strategy
      • Epson America Inc.
        • Overview
        • Product Portfolio
        • Profitability by Market Segments (Product/Age /Sales Channel/Region)
        • Sales Footprint
        • Strategy Overview
          • Marketing Strategy
          • Product Strategy
          • Channel Strategy
      • NEC Display Solutions Ltd.
        • Overview
        • Product Portfolio
        • Profitability by Market Segments (Product/Age /Sales Channel/Region)
        • Sales Footprint
        • Strategy Overview
          • Marketing Strategy
          • Product Strategy
          • Channel Strategy
      • Panasonic Corporation
        • Overview
        • Product Portfolio
        • Profitability by Market Segments (Product/Age /Sales Channel/Region)
        • Sales Footprint
        • Strategy Overview
          • Marketing Strategy
          • Product Strategy
          • Channel Strategy
  20. Assumptions & Acronyms Used
  21. Research Methodology

List Of Table

  • Table 1: Global Market Value (USD Mn) Forecast by Region, 2020 to 2035
  • Table 2: Global Market Volume (Units) Forecast by Region, 2020 to 2035
  • Table 3: Global Market Value (USD Mn) Forecast by Product Type, 2020 to 2035
  • Table 4: Global Market Volume (Units) Forecast by Product Type, 2020 to 2035
  • Table 5: Global Market Value (USD Mn) Forecast by End User, 2020 to 2035
  • Table 6: Global Market Volume (Units) Forecast by End User, 2020 to 2035
  • Table 7: Global Market Value (USD Mn) Forecast by Size, 2020 to 2035
  • Table 8: Global Market Volume (Units) Forecast by Size, 2020 to 2035
  • Table 9: North America Market Value (USD Mn) Forecast by Country, 2020 to 2035
  • Table 10: North America Market Volume (Units) Forecast by Country, 2020 to 2035
  • Table 11: North America Market Value (USD Mn) Forecast by Product Type, 2020 to 2035
  • Table 12: North America Market Volume (Units) Forecast by Product Type, 2020 to 2035
  • Table 13: North America Market Value (USD Mn) Forecast by End User, 2020 to 2035
  • Table 14: North America Market Volume (Units) Forecast by End User, 2020 to 2035
  • Table 15: North America Market Value (USD Mn) Forecast by Size, 2020 to 2035
  • Table 16: North America Market Volume (Units) Forecast by Size, 2020 to 2035
  • Table 17: Latin America Market Value (USD Mn) Forecast by Country, 2020 to 2035
  • Table 18: Latin America Market Volume (Units) Forecast by Country, 2020 to 2035
  • Table 19: Latin America Market Value (USD Mn) Forecast by Product Type, 2020 to 2035
  • Table 20: Latin America Market Volume (Units) Forecast by Product Type, 2020 to 2035
  • Table 21: Latin America Market Value (USD Mn) Forecast by End User, 2020 to 2035
  • Table 22: Latin America Market Volume (Units) Forecast by End User, 2020 to 2035
  • Table 23: Latin America Market Value (USD Mn) Forecast by Size, 2020 to 2035
  • Table 24: Latin America Market Volume (Units) Forecast by Size, 2020 to 2035
  • Table 25: Western Europe Market Value (USD Mn) Forecast by Country, 2020 to 2035
  • Table 26: Western Europe Market Volume (Units) Forecast by Country, 2020 to 2035
  • Table 27: Western Europe Market Value (USD Mn) Forecast by Product Type, 2020 to 2035
  • Table 28: Western Europe Market Volume (Units) Forecast by Product Type, 2020 to 2035
  • Table 29: Western Europe Market Value (USD Mn) Forecast by End User, 2020 to 2035
  • Table 30: Western Europe Market Volume (Units) Forecast by End User, 2020 to 2035
  • Table 31: Western Europe Market Value (USD Mn) Forecast by Size, 2020 to 2035
  • Table 32: Western Europe Market Volume (Units) Forecast by Size, 2020 to 2035
  • Table 33: East Asia Market Value (USD Mn) Forecast by Country, 2020 to 2035
  • Table 34: East Asia Market Volume (Units) Forecast by Country, 2020 to 2035
  • Table 35: East Asia Market Value (USD Mn) Forecast by Product Type, 2020 to 2035
  • Table 36: East Asia Market Volume (Units) Forecast by Product Type, 2020 to 2035
  • Table 37: East Asia Market Value (USD Mn) Forecast by End User, 2020 to 2035
  • Table 38: East Asia Market Volume (Units) Forecast by End User, 2020 to 2035
  • Table 39: East Asia Market Value (USD Mn) Forecast by Size, 2020 to 2035
  • Table 40: East Asia Market Volume (Units) Forecast by Size, 2020 to 2035
  • Table 41: South Asia Pacific Market Value (USD Mn) Forecast by Country, 2020 to 2035
  • Table 42: South Asia Pacific Market Volume (Units) Forecast by Country, 2020 to 2035
  • Table 43: South Asia Pacific Market Value (USD Mn) Forecast by Product Type, 2020 to 2035
  • Table 44: South Asia Pacific Market Volume (Units) Forecast by Product Type, 2020 to 2035
  • Table 45: South Asia Pacific Market Value (USD Mn) Forecast by End User, 2020 to 2035
  • Table 46: South Asia Pacific Market Volume (Units) Forecast by End User, 2020 to 2035
  • Table 47: South Asia Pacific Market Value (USD Mn) Forecast by Size, 2020 to 2035
  • Table 48: South Asia Pacific Market Volume (Units) Forecast by Size, 2020 to 2035
  • Table 49: Eastern Europe Market Value (USD Mn) Forecast by Country, 2020 to 2035
  • Table 50: Eastern Europe Market Volume (Units) Forecast by Country, 2020 to 2035
  • Table 51: Eastern Europe Market Value (USD Mn) Forecast by Product Type, 2020 to 2035
  • Table 52: Eastern Europe Market Volume (Units) Forecast by Product Type, 2020 to 2035
  • Table 53: Eastern Europe Market Value (USD Mn) Forecast by End User, 2020 to 2035
  • Table 54: Eastern Europe Market Volume (Units) Forecast by End User, 2020 to 2035
  • Table 55: Eastern Europe Market Value (USD Mn) Forecast by Size, 2020 to 2035
  • Table 56: Eastern Europe Market Volume (Units) Forecast by Size, 2020 to 2035
  • Table 57: Middle East & Africa Market Value (USD Mn) Forecast by Country, 2020 to 2035
  • Table 58: Middle East & Africa Market Volume (Units) Forecast by Country, 2020 to 2035
  • Table 59: Middle East & Africa Market Value (USD Mn) Forecast by Product Type, 2020 to 2035
  • Table 60: Middle East & Africa Market Volume (Units) Forecast by Product Type, 2020 to 2035
  • Table 61: Middle East & Africa Market Value (USD Mn) Forecast by End User, 2020 to 2035
  • Table 62: Middle East & Africa Market Volume (Units) Forecast by End User, 2020 to 2035
  • Table 63: Middle East & Africa Market Value (USD Mn) Forecast by Size, 2020 to 2035
  • Table 64: Middle East & Africa Market Volume (Units) Forecast by Size, 2020 to 2035

List Of Figures

  • Figure 1: Global Market Volume (Units) Forecast 2025 to 2035
  • Figure 2: Global Market Pricing Analysis
  • Figure 3: Global Market Value (USD Mn) Forecast 2025 to 2035
  • Figure 4: Global Market Value Share and BPS Analysis by Product Type, 2025 and 2035
  • Figure 5: Global Market Y-o-Y Growth Comparison by Product Type, 2025 to 2035
  • Figure 6: Global Market Attractiveness Analysis by Product Type
  • Figure 7: Global Market Value Share and BPS Analysis by End User, 2025 and 2035
  • Figure 8: Global Market Y-o-Y Growth Comparison by End User, 2025 to 2035
  • Figure 9: Global Market Attractiveness Analysis by End User
  • Figure 10: Global Market Value Share and BPS Analysis by Size, 2025 and 2035
  • Figure 11: Global Market Y-o-Y Growth Comparison by Size, 2025 to 2035
  • Figure 12: Global Market Attractiveness Analysis by Size
  • Figure 13: Global Market Value (USD Mn) Share and BPS Analysis by Region, 2025 and 2035
  • Figure 14: Global Market Y-o-Y Growth Comparison by Region, 2025 to 2035
  • Figure 15: Global Market Attractiveness Analysis by Region
  • Figure 16: North America Market Incremental $ Opportunity, 2025 to 2035
  • Figure 17: Latin America Market Incremental $ Opportunity, 2025 to 2035
  • Figure 18: Western Europe Market Incremental $ Opportunity, 2025 to 2035
  • Figure 19: East Asia Market Incremental $ Opportunity, 2025 to 2035
  • Figure 20: South Asia Pacific Market Incremental $ Opportunity, 2025 to 2035
  • Figure 21: Eastern Europe Market Incremental $ Opportunity, 2025 to 2035
  • Figure 22: Middle East & Africa Market Incremental $ Opportunity, 2025 to 2035
  • Figure 23: North America Market Value Share and BPS Analysis by Country, 2025 and 2035
  • Figure 24: North America Market Value Share and BPS Analysis by Product Type, 2025 and 2035
  • Figure 25: North America Market Y-o-Y Growth Comparison by Product Type, 2025 to 2035
  • Figure 26: North America Market Attractiveness Analysis by Product Type
  • Figure 27: North America Market Value Share and BPS Analysis by End User, 2025 and 2035
  • Figure 28: North America Market Y-o-Y Growth Comparison by End User, 2025 to 2035
  • Figure 29: North America Market Attractiveness Analysis by End User
  • Figure 30: North America Market Value Share and BPS Analysis by Size, 2025 and 2035
  • Figure 31: North America Market Y-o-Y Growth Comparison by Size, 2025 to 2035
  • Figure 32: North America Market Attractiveness Analysis by Size
  • Figure 33: Latin America Market Value Share and BPS Analysis by Country, 2025 and 2035
  • Figure 34: Latin America Market Value Share and BPS Analysis by Product Type, 2025 and 2035
  • Figure 35: Latin America Market Y-o-Y Growth Comparison by Product Type, 2025 to 2035
  • Figure 36: Latin America Market Attractiveness Analysis by Product Type
  • Figure 37: Latin America Market Value Share and BPS Analysis by End User, 2025 and 2035
  • Figure 38: Latin America Market Y-o-Y Growth Comparison by End User, 2025 to 2035
  • Figure 39: Latin America Market Attractiveness Analysis by End User
  • Figure 40: Latin America Market Value Share and BPS Analysis by Size, 2025 and 2035
  • Figure 41: Latin America Market Y-o-Y Growth Comparison by Size, 2025 to 2035
  • Figure 42: Latin America Market Attractiveness Analysis by Size
  • Figure 43: Western Europe Market Value Share and BPS Analysis by Country, 2025 and 2035
  • Figure 44: Western Europe Market Value Share and BPS Analysis by Product Type, 2025 and 2035
  • Figure 45: Western Europe Market Y-o-Y Growth Comparison by Product Type, 2025 to 2035
  • Figure 46: Western Europe Market Attractiveness Analysis by Product Type
  • Figure 47: Western Europe Market Value Share and BPS Analysis by End User, 2025 and 2035
  • Figure 48: Western Europe Market Y-o-Y Growth Comparison by End User, 2025 to 2035
  • Figure 49: Western Europe Market Attractiveness Analysis by End User
  • Figure 50: Western Europe Market Value Share and BPS Analysis by Size, 2025 and 2035
  • Figure 51: Western Europe Market Y-o-Y Growth Comparison by Size, 2025 to 2035
  • Figure 52: Western Europe Market Attractiveness Analysis by Size
  • Figure 53: East Asia Market Value Share and BPS Analysis by Country, 2025 and 2035
  • Figure 54: East Asia Market Value Share and BPS Analysis by Product Type, 2025 and 2035
  • Figure 55: East Asia Market Y-o-Y Growth Comparison by Product Type, 2025 to 2035
  • Figure 56: East Asia Market Attractiveness Analysis by Product Type
  • Figure 57: East Asia Market Value Share and BPS Analysis by End User, 2025 and 2035
  • Figure 58: East Asia Market Y-o-Y Growth Comparison by End User, 2025 to 2035
  • Figure 59: East Asia Market Attractiveness Analysis by End User
  • Figure 60: East Asia Market Value Share and BPS Analysis by Size, 2025 and 2035
  • Figure 61: East Asia Market Y-o-Y Growth Comparison by Size, 2025 to 2035
  • Figure 62: East Asia Market Attractiveness Analysis by Size
  • Figure 63: South Asia Pacific Market Value Share and BPS Analysis by Country, 2025 and 2035
  • Figure 64: South Asia Pacific Market Value Share and BPS Analysis by Product Type, 2025 and 2035
  • Figure 65: South Asia Pacific Market Y-o-Y Growth Comparison by Product Type, 2025 to 2035
  • Figure 66: South Asia Pacific Market Attractiveness Analysis by Product Type
  • Figure 67: South Asia Pacific Market Value Share and BPS Analysis by End User, 2025 and 2035
  • Figure 68: South Asia Pacific Market Y-o-Y Growth Comparison by End User, 2025 to 2035
  • Figure 69: South Asia Pacific Market Attractiveness Analysis by End User
  • Figure 70: South Asia Pacific Market Value Share and BPS Analysis by Size, 2025 and 2035
  • Figure 71: South Asia Pacific Market Y-o-Y Growth Comparison by Size, 2025 to 2035
  • Figure 72: South Asia Pacific Market Attractiveness Analysis by Size
  • Figure 73: Eastern Europe Market Value Share and BPS Analysis by Country, 2025 and 2035
  • Figure 74: Eastern Europe Market Value Share and BPS Analysis by Product Type, 2025 and 2035
  • Figure 75: Eastern Europe Market Y-o-Y Growth Comparison by Product Type, 2025 to 2035
  • Figure 76: Eastern Europe Market Attractiveness Analysis by Product Type
  • Figure 77: Eastern Europe Market Value Share and BPS Analysis by End User, 2025 and 2035
  • Figure 78: Eastern Europe Market Y-o-Y Growth Comparison by End User, 2025 to 2035
  • Figure 79: Eastern Europe Market Attractiveness Analysis by End User
  • Figure 80: Eastern Europe Market Value Share and BPS Analysis by Size, 2025 and 2035
  • Figure 81: Eastern Europe Market Y-o-Y Growth Comparison by Size, 2025 to 2035
  • Figure 82: Eastern Europe Market Attractiveness Analysis by Size
  • Figure 83: Middle East & Africa Market Y-o-Y Growth Comparison by Product Type, 2025 to 2035
  • Figure 84: Middle East & Africa Market Attractiveness Analysis by Product Type
  • Figure 85: Middle East & Africa Market Value Share and BPS Analysis by End User, 2025 and 2035
  • Figure 86: Middle East & Africa Market Y-o-Y Growth Comparison by End User, 2025 to 2035
  • Figure 87: Middle East & Africa Market Attractiveness Analysis by End User
  • Figure 88: Middle East & Africa Market Value Share and BPS Analysis by Size, 2025 and 2035
  • Figure 89: Middle East & Africa Market Y-o-Y Growth Comparison by Size, 2025 to 2035
  • Figure 90: Middle East & Africa Market Attractiveness Analysis by Size
  • Figure 91: Global Market - Tier Structure Analysis
  • Figure 92: Global Market - Company Share Analysis

- FAQs -

What was the global Interactive display market size reported by Fact.MR for 2025?

The global interactive display market was valued at USD 49.5 billion in 2025.

Who are the major players operating in the interactive display market?

Prominent players in the market are BenQ Corporation, IntuiLab SA, Google Inc., Samsung Display Co. Ltd., Egan Teamboard Inc., SMART Technologies, among others.

What is the Estimated Valuation of the interactive display market in 2035?

The market is expected to reach a valuation of USD 111.9 billion in 2035.

What value CAGR did the Interactive display market exhibit over the last five years?

The historic growth rate of the Interactive display market was 7.2% from 2020-2024.

- Also of Interest -

Interactive Dog Toys Market

Interactive Dog Toys Market By Type (Chew, Squeaky, Treat Dispenser, Plush, Fetch, Tug, Others), By Material (Fabric, Plastics, Wood, Rubber, Other), By Sales Channel (Online, Offline, Others), By Regions - Global Review 2021 to 2031

5K Display Resolution Market

5K Display Resolution Market Analysis by Cameras, Televisions, Monitors, Smartphones/Tablets, and Projectors from 2023 to 2033

Retail display racks Market

Retail display racks Market Analysis Report By Material Type (Metal, Plastic, Wooden), By Application (Department, Stores, Grocery Stores, Hypermarkets and Supermarkets, Pharmacy Outlets, Wine and Liquor Outlets) - Regional Forecast 2021-2031

Wearable Display Market

Wearable Display Market By Product Type (Smart Bands, Smart Watches, Head Mounted Displays, Wearable ECG, Smart Helmets), By Display Technology (LED, LCD, OLED), By Display Size (Less than 1 inch, 1 – 2 inches, More than 2 inches), By Regions - Global Review 2021 to 2031

Interactive Display Market

Schedule a Call