Gamma butyrolactone (GBL) Market
Gamma Butyrolactone (GBL) Market Analysis, By Purity, By Functionality, By Application, By End-Use Industry, By Distribution Channel, and Region - Market Insights 2025 to 2035
The Min 99.9% segment is projected to grow at a CAGR of 4.0%, whereas another segment Min 99.7% is likely to grow at 2.4%. In terms of countries USA is projected to grow at 2.1%, followed by China at 4.5% and Germany to grow at 1.5%.
Gamma Butyrolactone (GBL) Market Outlook (2025 to 2035)
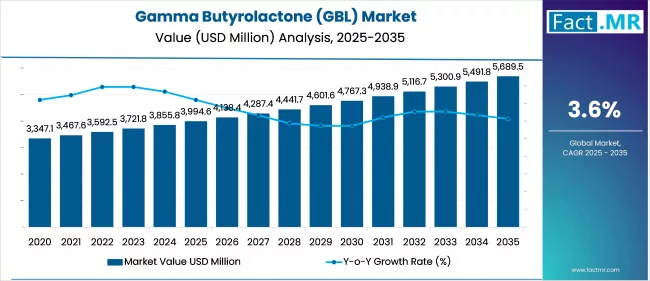
The global Gamma Butyrolactone (GBL) Market is expected to reach USD 5,690 million by 2035, up from USD 3,856 million in 2024. During the forecast period 2025 to 2035, the industry is projected to grow at a CAGR of 3.6%, driven by rising demand in high-performance battery electrolytes, precision cleaning for electronics, and pharmaceutical intermediates.
Regulatory approvals for industrial solvents and increasing investments in specialty chemicals have further accelerated the adoption. With the Asia Pacific leading consumption, market dynamics have been shaped by technological integration, sustainability mandates, and diversification of downstream applications.
What factors have driven the increasing demand for Gamma Butyrolactone (GBL) in global markets?
The growing pharmaceutical industry has significantly contributed to the expansion of the GBL market, where it is widely used as a precursor for drugs and a solvent for active ingredients. Its involvement in the manufacturing of battery cells and clean technology in the electronics industry has also facilitated its rapid market adoption.
Another sector that has employed the use of GBL is the agrochemical industry, in the formulation of herbicides and insecticides. Its effectiveness in cleaning agents, polymer and coating has also been acknowledged by industrial manufacturers. All of this has contributed to an increase in industrialization and research activities among growing economies, enhancing the overall demand foundations of gamma-butyrolactone at the global level.
What have been the major trends shaping the global Gamma butyrolactone (GBL) Market recently?
The shift toward environmentally friendly production has become a prominent trend in the GBL market, enabling companies to reduce their ecological footprint. The firms have been seeking alternative bio-based and low-emission synthesis routes in order to address the regulatory frameworks.
The integration of battery-grade materials is also drawing attention, particularly with the global shift toward electric mobility. There has also been an increase in collaboration between research institutes and the chemical industry to develop GBL derivatives.
The market has witnessed strategic-level activity, including mergers, expansions, and product innovations. These trends indicate a broader industry shift towards specialty chemicals with sustainable and high-value applications.
What are the primary regulatory and safety concerns restraining the Gamma butyrolactone (GBL) Market growth?
One of the factors that has hampered the gamma butyrolactone market is the stringent regulatory measures related to its availability as a potential precursor in the production of restricted substances. This has limited its supply and made global trade flows challenging.
Fluctuating raw material prices have continued to pose challenges for maintaining stable production costs. The ecological issues associated with traditional methods of producing GBL have garnered increased attention from policymakers and environmental organizations.
The compliance and certification requirements, particularly for small and medium-scale manufacturers, have presented additional difficulties. Cumulatively, these variables have introduced operational and strategic challenges that market players must address to ensure legal, safe, and sustainable business practices.
What factors have driven regional differences in Gamma butyrolactone (GBL) Market growth and adoption trends?
The gamma-butyrolactone (GBL) market in North America has remained steady, with minimal demand fluctuations, supported by the region's advanced pharmaceutical and chemical sectors. Regulatory measures were introduced in response to the potential misuse of GBL, which affected certain aspects of business operations. Manufacturers have responded by maintaining steady supply chains and exploring sustainable production methods to support continued market presence.
East Asia led the world in the GBL market, with China and South Korea as the top nations in both production and consumption. Regional demand has been boosted by industrial growth in the electronics, pharmaceuticals, and agrochemical sectors. The governments had already invested in the downstream application of GBL, and the local manufacturers had taken advantage of the low-cost synthetic routes to strengthen their market dominance.
The Western European gamma butyrolactone market has benefited from an established industrial base, particularly in the pharmaceutical sector and specialty materials production. Although previous growth was limited by strict EU chemical regulations, manufacturers adapted by improving compliance and focusing on high-value specialty segments. Local R&D had also been working on less environmentally polluting methods of production and sustainable chemical solvent technologies.
Country-wise Outlook
Industrial Growth and Regulatory Streamlining Boost China’s Gamma Butyrolactone (GBL) Market
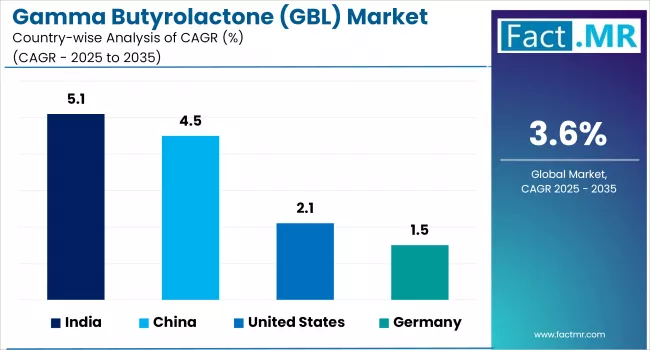
China has emerged as a dominant force in the gamma butyrolactone market, driven by its large-scale industrial capacity and regulatory framework that ensures efficient production and steady supply. The country plays a central role as both a producer and consumer of GBL, with applications extending across the pharmaceutical, agrochemical, and electronics sectors.
Manufacturers have significantly increased their produced goods to meet the demands domestically and globally. In parallel, regulatory reforms have eased import restrictions and simplified procedures related to GBL-containing products, streamlining market operations.
Such changes have resulted in the smoother and more efficient environment of trades and promoted the expansion of industrial applications, which further solidifies the position of China as the pivot of the international chain of GBL suppliers.
Health-Conscious Consumers and Functional Ingredients Boost USA Gamma Butyrolactone (GBL) Market
The gamma butyrolactone market in the USA has registered a growth since the last few years owing to changing consumer trend in food products as they seek more functional and enriched food products. The need to produce food using clean-label and wellness-oriented ingredients has compelled food producers to embrace the use of natural preservatives like GBL.
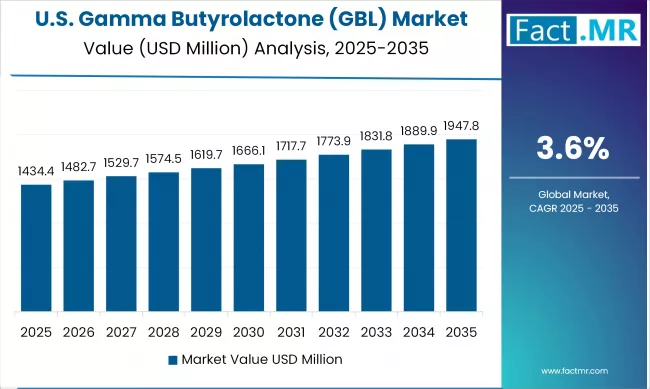
Artisan and organic breads, often additive-free, have incorporated GBL, reflecting the preferences of consumers seeking transparent and health-aligned products. The popularity of products that are more convenient to use due to the possibility to extend the shelf life such as frozen dough has proved the efficiency of GBL in associating shelf life and retailing quality. These developments have established GBL as a relevant component in the evolving USA food industry.
Clean-Label Compliance and Dairy Innovation Propel Germany’s Gamma Butyrolactone (GBL) Market
Germany's gamma butyrolactone market has benefited from regulatory compliance and a growing preference for clean-label food products. Consumers have been demanding fewer additive and organic attributes, prompting producers to incorporate natural preservatives such as GBL. Its applicability in bakery and dairy products has proven effective particularly in maintaining product integrity and preventing spoilage.
The provision of regulatory focus on sustainability and integrity of the food has propounded the wide adoption of GBL as the producers strive to deliver on consumer demands concerning the production of natural, safe and health-focused products. This regulatory and consumer harmony has reinforced positioning of GBL in the German market.
Category-Wise Market Outlook
Min 99.9% Grade Gains Prominence Amid High-Purity Industrial Demands
The 99.9% purity segment has become the most rapidly developing area of the gamma butyrolactone market in terms of purity level. This is an upward trend supported by the growing demand in high-end electronic, pharmaceutical, and lithium battery applications, where ultrahigh purity has become critical to both performance and safety.
Regulatory requirements for purity in developed countries and quality standards in Asian manufacturing hubs have also led to the preference for this grade. Its application in high-quality solvents in semiconductor and advanced energy storage systems sustained its growth as global markets continue to shift toward precision-focused and clean energy applications.
Industrial Solvent Demand Surges with Rising Applications Across Chemical Processing
The gamma butyrolactone market has witnessed significant growth in its role as an industrial solvent, a key functional subsegment. This uptrend is driven by GBL’s exceptional solvency strength and relatively low toxicity, making it ideal for diverse chemical processing operations. Its effectiveness in dissolving a broad range of organic and inorganic substances has made it a preferred choice across multiple industries.
The movement toward environmentally safer and more sustainable chemical formulations have further accelerated its adoption as an industrial solvent. In addition to traditional applications, GBL has gained traction in sectors such as coatings, electronic cleaning, agrochemicals, and pharmaceuticals, where its chemical compatibility and efficiency enhance process stability, yield, and overall productivity.
Batteries & Capacitors Spearhead Demand Under Electrification and Storage Boom
The rapidly growing application segment in the gamma butyrolactone market has been identified to be batteries & capacitors. The development of electric vehicles has led to a significant increase in the use of GBL as an electrolyte solvent, supported by its wide electrochemical stability window and high dielectric constant.
Most notably, its application in lithium-ion batteries has contributed to the growth of the Asia-Pacific and European markets, which have increased demand for energy-efficient and safe energy storage products due to automotive electrification policies and energy transition agendas. The segment's growth is further supported by GBL's ability to enhance charge-discharge efficiency and thermal stability in next-generation battery chemistries.
Competitive Analysis
The major chemical producers of gamma butyrolactone (GBL) market have been influenced by their specialization in areas such as pharmaceuticals, agrochemicals, and electronics. BASF SE has focused on sustainable production processes, by ensuring inclusion of biomass-balanced products in its product range.
LyondellBasell Industries has taken the advantage of its global operations and has provided high-purity GBL into its solvent business. Ashland Inc. has concentrated on niche markets, offering specialty chemicals for industrial applications.
Mitsubishi Chemical Corporation has expanded its GBL production through collaborations and partnerships with other chemical manufacturers. Dairen Chemical Corporation has focused on developing technology in order to optimize the GBL synthesis process.
Sipchem (Sahara International Petrochemical Company) has changed its product mix and is also supplying GBL derivatives to meet the increasing demand in the Middle East. Located in China, Zhejiang Realsun Chemical Co., Ltd. has leveraged the country's robust chemical industry to supply GBL for various applications.
Nagda Pharmaceuticals have utilized GBL to develop pharmaceutical intermediates that align with the expectations of the healthcare sector. The Panax Etec Co., Ltd. has incorporated GBL in its electronic materials division, which has boosted the electronics industry. Changxin Chemical Science-Tech Co., Ltd. has ventured into research and development to explore innovative applications of GBL, thereby strengthening its market presence.
Key players in the gamma butyrolactone (GBL) industry include BASF SE, LyondellBasell Industries, Ashland Inc., Mitsubishi Chemical Corporation, Dairen Chemical Corporation, Sipchem (Sahara International Petrochemical Company), Zhejiang Realsun Chemical Co., Ltd., Chengda Pharmaceuticals, Panax Etec Co., Ltd., and Changxin Chemical Science-Tech Co., Ltd.
Recent Development:
- In June 2025, Zhejiang Realsun Chemical introduced a new line of high-purity GBL, tailored for pharmaceutical and electronic applications, with an emphasis on quality and compliance.
- In April 2025, Shenyang East Chemical Science-Tech Co., Ltd. expanded its GBL product line to include improved high- and low-temperature resistance, catering to the electronics and automotive sectors.
Fact.MR has provided detailed information about the price points of key manufacturers of the Gamma Butyrolactone Market positioned across regions, sales growth, production capacity, and speculative technological expansion, in the recently published report.
Methodology and Industry Tracking Approach
The 2025 Global Gamma Butyrolactone (GBL) Market Report by Fact.MR establishes a new benchmark in high-impact strategic intelligence, delivering a data-rich, precision-driven exploration of GBL’s expanding role across global food preservation, wellness-centric formulations, and sustainable product innovation. Drawing on insights from over 7,500 stakeholders across 35 countries, each contributing more than 300 validated responses, the report offers unparalleled analytical depth, geographic diversity, and actionable value across industry sectors.
The respondent ecosystem was meticulously structured to ensure full-spectrum visibility into the GBL market. Two-thirds of the participants comprised end users and strategic decision-makers, including R&D heads, procurement strategists, food innovation leads, and regulatory compliance managers from top-tier companies in the food manufacturing, bakery, dairy, and clean-label consumer goods sectors. The remaining third represented subject-matter experts ranging from food technologists and ingredient formulators to quality assurance officers and export consultants, bringing niche expertise in fermentation science, preservative efficiency, and label-friendly product architecture.
Covering an intensive research cycle from June 2024 to May 2025, the study captures transformative developments within the GBL value chain. These include advancements in natural preservation systems, increased integration in artisan and organic bakery applications, demand-driven shifts toward additive-free food matrices, and regulatory transitions tied to ingredient transparency, global harmonization, and sustainability labeling. The report also evaluates GBL’s growing presence in extended shelf-life solutions and multifunctional ingredient systems across convenience-based product lines.
Leveraging over 250 validated data sources, including international trade data, GRAS listings, regional food safety frameworks, scientific publications, and proprietary usage audits, the report applies advanced analytical frameworks such as segmentation mapping, adoption curve modeling, and regression-based forecasting to deliver high-confidence, forward-looking insights.
Having continuously monitored the GBL market since 2018, this 2025 edition emerges as an essential tool for ingredient innovators, regulatory strategists, food technology leaders, and investment teams seeking to lead in a dynamic and increasingly health-conscious market environment.
Segmentation of Gamma butyrolactone (GBL) Market Research
-
By Purity :
- Min 99.9%
- Min 99.7%
-
By Functionality :
- Industrial Solvent
- Intermediate in Synthesis
- Surface Cleaning Agent
- Polymerization Solvent
- Coating Additive Carrier
-
By Application :
- Batteries & Capacitors
- Herbicides & Insecticides
- Sedatives & Anesthetics
- Solvents
- Others (adhesives, resins)
-
By End-Use Industry :
- Electrical & Electronics
- Agrochemical
- Pharmaceutical
- Chemical
- Others
-
By Distribution Channel :
- Direct Sales
- Distributors & Traders
- Online Chemical Platforms
-
By Region :
- North America
- Latin America
- Western Europe
- Eastern Europe
- East Asia
- South Asia & Pacific
- Middle East & Africa
Table of Content
- Executive Summary
- Global Market Outlook
- Demand-side Trends
- Supply-side Trends
- Technology Roadmap Analysis
- Analysis and Recommendations
- Market Overview
- Market Coverage / Taxonomy
- Market Definition / Scope / Limitations
- Market Background
- Market Dynamics
- Drivers
- Restraints
- Opportunity
- Trends
- Scenario Forecast
- Demand in Optimistic Scenario
- Demand in Likely Scenario
- Demand in Conservative Scenario
- Opportunity Map Analysis
- Product Life Cycle Analysis
- Supply Chain Analysis
- Supply Side Participants and their Roles
- Producers
- Mid-Level Participants (Traders/ Agents/ Brokers)
- Wholesalers and Distributors
- Value Added and Value Created at Node in the Supply Chain
- List of Raw Material Suppliers
- List of Existing and Potential Buyers
- Supply Side Participants and their Roles
- Investment Feasibility Matrix
- Value Chain Analysis
- Profit Margin Analysis
- Wholesalers and Distributors
- Retailers
- PESTLE and Porter’s Analysis
- Regulatory Landscape
- By Key Regions
- By Key Countries
- Production and Consumption Statistics
- Import and Export Statistics
- Market Dynamics
- Global Market Analysis 2020 to 2024 and Forecast, 2025 to 2035
- Historical Market Size Value (US$ Mn) & Volume (Units) Analysis, 2020 to 2024
- Current and Future Market Size Value (US$ Mn) & Volume (Units) Projections, 2025 to 2035
- Y-o-Y Growth Trend Analysis
- Absolute $ Opportunity Analysis
- Global Market Pricing Analysis 2020 to 2024 and Forecast 2025 to 2035
- Global Market Analysis 2020 to 2024 and Forecast 2025 to 2035, By Purity
- Introduction / Key Findings
- Historical Market Size Value (US$ Mn) & Volume (Units) Analysis By Purity, 2020 to 2024
- Current and Future Market Size Value (US$ Mn) & Volume (Units) Analysis and Forecast By Purity, 2025 to 2035
- Min 99.9%
- Min 99.7%
- Y-o-Y Growth Trend Analysis By Purity, 2020 to 2024
- Absolute $ Opportunity Analysis By Purity, 2025 to 2035
- Global Market Analysis 2020 to 2024 and Forecast 2025 to 2035, By Functionality
- Introduction / Key Findings
- Historical Market Size Value (US$ Mn) & Volume (Units) Analysis By Functionality, 2020 to 2024
- Current and Future Market Size Value (US$ Mn) & Volume (Units) Analysis and Forecast By Functionality, 2025 to 2035
- Industrial Solvent
- Intermediate in Synthesis
- Surface Cleaning Agent
- Polymerization Solvent
- Coating Additive Carrier
- Y-o-Y Growth Trend Analysis By Functionality, 2020 to 2024
- Absolute $ Opportunity Analysis By Functionality, 2025 to 2035
- Global Market Analysis 2020 to 2024 and Forecast 2025 to 2035, By Application
- Introduction / Key Findings
- Historical Market Size Value (US$ Mn) & Volume (Units) Analysis By Application, 2020 to 2024
- Current and Future Market Size Value (US$ Mn) & Volume (Units) Analysis and Forecast By Application, 2025 to 2035
- Batteries & Capacitors
- Herbicides & Insecticides
- Sedatives & Anesthetics
- Solvents
- Others (adhesives, resins)
- Y-o-Y Growth Trend Analysis By Application, 2020 to 2024
- Absolute $ Opportunity Analysis By Application, 2025 to 2035
- Global Market Analysis 2020 to 2024 and Forecast 2025 to 2035, By End-Use Industry
- Introduction / Key Findings
- Historical Market Size Value (US$ Mn) & Volume (Units) Analysis By End-Use Industry, 2020 to 2024
- Current and Future Market Size Value (US$ Mn) & Volume (Units) Analysis and Forecast By End-Use Industry, 2025 to 2035
- Electrical & Electronics
- Agrochemical
- Pharmaceutical
- Chemical
- Others
- Y-o-Y Growth Trend Analysis By End-Use Industry, 2020 to 2024
- Absolute $ Opportunity Analysis By End-Use Industry, 2025 to 2035
- Global Market Analysis 2020 to 2024 and Forecast 2025 to 2035, By Distribution Channel
- Introduction / Key Findings
- Historical Market Size Value (US$ Mn) & Volume (Units) Analysis By Distribution Channel, 2020 to 2024
- Current and Future Market Size Value (US$ Mn) & Volume (Units) Analysis and Forecast By Distribution Channel, 2025 to 2035
- Direct Sales
- Distributors & Traders
- Online Chemical Platforms
- Y-o-Y Growth Trend Analysis By Distribution Channel, 2020 to 2024
- Absolute $ Opportunity Analysis By Distribution Channel, 2025 to 2035
- Global Market Analysis 2020 to 2024 and Forecast 2025 to 2035, By Region
- Introduction
- Historical Market Size Value (US$ Mn) & Volume (Units) Analysis By Region, 2020 to 2024
- Current Market Size Value (US$ Mn) & Volume (Units) Analysis and Forecast By Region, 2025 to 2035
- North America
- Latin America
- Europe
- East Asia
- South Asia
- Oceania
- MEA
- Market Attractiveness Analysis By Region
- North America Market Analysis 2020 to 2024 and Forecast 2025 to 2035, By Country
- Historical Market Size Value (US$ Mn) & Volume (Units) Trend Analysis By Market Taxonomy, 2020 to 2024
- Market Size Value (US$ Mn) & Volume (Units) Forecast By Market Taxonomy, 2025 to 2035
- By Country
- USA
- Canada
- By Purity
- By Functionality
- By Application
- By End-Use Industry
- By Distribution Channel
- By Country
- Market Attractiveness Analysis
- By Country
- By Purity
- By Functionality
- By Application
- By End-Use Industry
- By Distribution Channel
- Key Takeaways
- Latin America Market Analysis 2020 to 2024 and Forecast 2025 to 2035, By Country
- Historical Market Size Value (US$ Mn) & Volume (Units) Trend Analysis By Market Taxonomy, 2020 to 2024
- Market Size Value (US$ Mn) & Volume (Units) Forecast By Market Taxonomy, 2025 to 2035
- By Country
- Brazil
- Mexico
- Argentina
- Chile
- Peru
- Rest of Latin America
- By Purity
- By Functionality
- By Application
- By End-Use Industry
- By Distribution Channel
- By Country
- Market Attractiveness Analysis
- By Country
- By Purity
- By Functionality
- By Application
- By End-Use Industry
- By Distribution Channel
- Key Takeaways
- Europe Market Analysis 2020 to 2024 and Forecast 2025 to 2035, By Country
- Historical Market Size Value (US$ Mn) & Volume (Units) Trend Analysis By Market Taxonomy, 2020 to 2024
- Market Size Value (US$ Mn) & Volume (Units) Forecast By Market Taxonomy, 2025 to 2035
- By Country
- Germany
- Italy
- France
- UK
- Spain
- Russia
- BENELUX
- Rest of Europe
- By Purity
- By Functionality
- By Application
- By End-Use Industry
- By Distribution Channel
- By Country
- Market Attractiveness Analysis
- By Country
- By Purity
- By Functionality
- By Application
- By End-Use Industry
- By Distribution Channel
- Key Takeaways
- East Asia Market Analysis 2020 to 2024 and Forecast 2025 to 2035, By Country
- Historical Market Size Value (US$ Mn) & Volume (Units) Trend Analysis By Market Taxonomy, 2020 to 2024
- Market Size Value (US$ Mn) & Volume (Units) Forecast By Market Taxonomy, 2025 to 2035
- By Country
- China
- Japan
- South Korea
- By Purity
- By Functionality
- By Application
- By End-Use Industry
- By Distribution Channel
- By Country
- Market Attractiveness Analysis
- By Country
- By Purity
- By Functionality
- By Application
- By End-Use Industry
- By Distribution Channel
- Key Takeaways
- South Asia Market Analysis 2020 to 2024 and Forecast 2025 to 2035, By Country
- Historical Market Size Value (US$ Mn) & Volume (Units) Trend Analysis By Market Taxonomy, 2020 to 2024
- Market Size Value (US$ Mn) & Volume (Units) Forecast By Market Taxonomy, 2025 to 2035
- By Country
- India
- Thailand
- Malaysia
- Indonesia
- Rest of South Asia
- By Purity
- By Functionality
- By Application
- By End-Use Industry
- By Distribution Channel
- By Country
- Market Attractiveness Analysis
- By Country
- By Purity
- By Functionality
- By Application
- By End-Use Industry
- By Distribution Channel
- Key Takeaways
- Oceania Market Analysis 2020 to 2024 and Forecast 2025 to 2035, By Country
- Historical Market Size Value (US$ Mn) & Volume (Units) Trend Analysis By Market Taxonomy, 2020 to 2024
- Market Size Value (US$ Mn) & Volume (Units) Forecast By Market Taxonomy, 2025 to 2035
- By Country
- Australia
- New Zealand
- By Purity
- By Functionality
- By Application
- By End-Use Industry
- By Distribution Channel
- By Country
- Market Attractiveness Analysis
- By Country
- By Purity
- By Functionality
- By Application
- By End-Use Industry
- By Distribution Channel
- Key Takeaways
- MEA Market Analysis 2020 to 2024 and Forecast 2025 to 2035, By Country
- Historical Market Size Value (US$ Mn) & Volume (Units) Trend Analysis By Market Taxonomy, 2020 to 2024
- Market Size Value (US$ Mn) & Volume (Units) Forecast By Market Taxonomy, 2025 to 2035
- By Country
- GCC
- Rest of MEA
- By Purity
- By Functionality
- By Application
- By End-Use Industry
- By Distribution Channel
- By Country
- Market Attractiveness Analysis
- By Country
- By Purity
- By Functionality
- By Application
- By End-Use Industry
- By Distribution Channel
- Key Takeaways
- Key Countries Market Analysis
- China
- Pricing Analysis
- Market Share Analysis, 2024
- By Purity
- By Functionality
- By Application
- By End-Use Industry
- By Distribution Channel
- Value (US$ Mn) & Volume (Units)ed States
- Pricing Analysis
- Market Share Analysis, 2024
- By Purity
- By Functionality
- By Application
- By End-Use Industry
- By Distribution Channel
- Germany
- Pricing Analysis
- Market Share Analysis, 2024
- By Purity
- By Functionality
- By Application
- By End-Use Industry
- By Distribution Channel
- Japan
- Pricing Analysis
- Market Share Analysis, 2024
- By Purity
- By Functionality
- By Application
- By End-Use Industry
- By Distribution Channel
- South Korea
- Pricing Analysis
- Market Share Analysis, 2024
- By Purity
- By Functionality
- By Application
- By End-Use Industry
- By Distribution Channel
- China
- Market Structure Analysis
- Competition Dashboard
- Competition Benchmarking
- Market Share Analysis of Top Players
- By Regional
- By Purity
- By Functionality
- By Application
- By End-Use Industry
- By Distribution Channel
- Competition Analysis
- Competition Deep Dive
- BASF SE
- Overview
- Product Portfolio
- Profitability by Market Segments (Product/Age /Sales Channel/Region)
- Sales Footprint
- Strategy Overview
- Marketing Strategy
- Product Strategy
- Channel Strategy
- LyondellBasell Industries
- Overview
- Product Portfolio
- Profitability by Market Segments (Product/Age /Sales Channel/Region)
- Sales Footprint
- Strategy Overview
- Marketing Strategy
- Product Strategy
- Channel Strategy
- Ashland Inc.
- Overview
- Product Portfolio
- Profitability by Market Segments (Product/Age /Sales Channel/Region)
- Sales Footprint
- Strategy Overview
- Marketing Strategy
- Product Strategy
- Channel Strategy
- Mitsubishi Chemical Corporation
- Overview
- Product Portfolio
- Profitability by Market Segments (Product/Age /Sales Channel/Region)
- Sales Footprint
- Strategy Overview
- Marketing Strategy
- Product Strategy
- Channel Strategy
- Dairen Chemical Corporation
- Overview
- Product Portfolio
- Profitability by Market Segments (Product/Age /Sales Channel/Region)
- Sales Footprint
- Strategy Overview
- Marketing Strategy
- Product Strategy
- Channel Strategy
- Sipchem (Sahara International Petrochemical Company)
- Overview
- Product Portfolio
- Profitability by Market Segments (Product/Age /Sales Channel/Region)
- Sales Footprint
- Strategy Overview
- Marketing Strategy
- Product Strategy
- Channel Strategy
- Zhejiang Realsun Chemical Co., Ltd.
- Overview
- Product Portfolio
- Profitability by Market Segments (Product/Age /Sales Channel/Region)
- Sales Footprint
- Strategy Overview
- Marketing Strategy
- Product Strategy
- Channel Strategy
- Chengda Pharmaceuticals
- Overview
- Product Portfolio
- Profitability by Market Segments (Product/Age /Sales Channel/Region)
- Sales Footprint
- Strategy Overview
- Marketing Strategy
- Product Strategy
- Channel Strategy
- Panax Etec Co., Ltd.
- Overview
- Product Portfolio
- Profitability by Market Segments (Product/Age /Sales Channel/Region)
- Sales Footprint
- Strategy Overview
- Marketing Strategy
- Product Strategy
- Channel Strategy
- Changxin Chemical Science-Tech Co., Ltd.
- Overview
- Product Portfolio
- Profitability by Market Segments (Product/Age /Sales Channel/Region)
- Sales Footprint
- Strategy Overview
- Marketing Strategy
- Product Strategy
- Channel Strategy
- BASF SE
- Competition Deep Dive
- Assumptions & Acronyms Used
- Research Methodology
List Of Table
- Table 1: Global Market Value (US$ Mn) Forecast by Region, 2020 to 2035
- Table 2: Global Market Volume (Units) Forecast by Region, 2020 to 2035
- Table 3: Global Market Value (US$ Mn) Forecast by Purity, 2020 to 2035
- Table 4: Global Market Volume (Units) Forecast by Purity, 2020 to 2035
- Table 5: Global Market Value (US$ Mn) Forecast by Functionality, 2020 to 2035
- Table 6: Global Market Volume (Units) Forecast by Functionality, 2020 to 2035
- Table 7: Global Market Value (US$ Mn) Forecast by Application, 2020 to 2035
- Table 8: Global Market Volume (Units) Forecast by Application, 2020 to 2035
- Table 9: Global Market Value (US$ Mn) Forecast by End-Use Industry, 2020 to 2035
- Table 10: Global Market Volume (Units) Forecast by End-Use Industry, 2020 to 2035
- Table 11: Global Market Value (US$ Mn) Forecast by Distribution Channel, 2020 to 2035
- Table 12: Global Market Volume (Units) Forecast by Distribution Channel, 2020 to 2035
- Table 13: North America Market Value (US$ Mn) Forecast by Country, 2020 to 2035
- Table 14: North America Market Volume (Units) Forecast by Country, 2020 to 2035
- Table 15: North America Market Value (US$ Mn) Forecast by Purity, 2020 to 2035
- Table 16: North America Market Volume (Units) Forecast by Purity, 2020 to 2035
- Table 17: North America Market Value (US$ Mn) Forecast by Functionality, 2020 to 2035
- Table 18: North America Market Volume (Units) Forecast by Functionality, 2020 to 2035
- Table 19: North America Market Value (US$ Mn) Forecast by Application, 2020 to 2035
- Table 20: North America Market Volume (Units) Forecast by Application, 2020 to 2035
- Table 21: North America Market Value (US$ Mn) Forecast by End-Use Industry, 2020 to 2035
- Table 22: North America Market Volume (Units) Forecast by End-Use Industry, 2020 to 2035
- Table 23: North America Market Value (US$ Mn) Forecast by Distribution Channel, 2020 to 2035
- Table 24: North America Market Volume (Units) Forecast by Distribution Channel, 2020 to 2035
- Table 25: Latin America Market Value (US$ Mn) Forecast by Country, 2020 to 2035
- Table 26: Latin America Market Volume (Units) Forecast by Country, 2020 to 2035
- Table 27: Latin America Market Value (US$ Mn) Forecast by Purity, 2020 to 2035
- Table 28: Latin America Market Volume (Units) Forecast by Purity, 2020 to 2035
- Table 29: Latin America Market Value (US$ Mn) Forecast by Functionality, 2020 to 2035
- Table 30: Latin America Market Volume (Units) Forecast by Functionality, 2020 to 2035
- Table 31: Latin America Market Value (US$ Mn) Forecast by Application, 2020 to 2035
- Table 32: Latin America Market Volume (Units) Forecast by Application, 2020 to 2035
- Table 33: Latin America Market Value (US$ Mn) Forecast by End-Use Industry, 2020 to 2035
- Table 34: Latin America Market Volume (Units) Forecast by End-Use Industry, 2020 to 2035
- Table 35: Latin America Market Value (US$ Mn) Forecast by Distribution Channel, 2020 to 2035
- Table 36: Latin America Market Volume (Units) Forecast by Distribution Channel, 2020 to 2035
- Table 37: Europe Market Value (US$ Mn) Forecast by Country, 2020 to 2035
- Table 38: Europe Market Volume (Units) Forecast by Country, 2020 to 2035
- Table 39: Europe Market Value (US$ Mn) Forecast by Purity, 2020 to 2035
- Table 40: Europe Market Volume (Units) Forecast by Purity, 2020 to 2035
- Table 41: Europe Market Value (US$ Mn) Forecast by Functionality, 2020 to 2035
- Table 42: Europe Market Volume (Units) Forecast by Functionality, 2020 to 2035
- Table 43: Europe Market Value (US$ Mn) Forecast by Application, 2020 to 2035
- Table 44: Europe Market Volume (Units) Forecast by Application, 2020 to 2035
- Table 45: Europe Market Value (US$ Mn) Forecast by End-Use Industry, 2020 to 2035
- Table 46: Europe Market Volume (Units) Forecast by End-Use Industry, 2020 to 2035
- Table 47: Europe Market Value (US$ Mn) Forecast by Distribution Channel, 2020 to 2035
- Table 48: Europe Market Volume (Units) Forecast by Distribution Channel, 2020 to 2035
- Table 49: East Asia Market Value (US$ Mn) Forecast by Country, 2020 to 2035
- Table 50: East Asia Market Volume (Units) Forecast by Country, 2020 to 2035
- Table 51: East Asia Market Value (US$ Mn) Forecast by Purity, 2020 to 2035
- Table 52: East Asia Market Volume (Units) Forecast by Purity, 2020 to 2035
- Table 53: East Asia Market Value (US$ Mn) Forecast by Functionality, 2020 to 2035
- Table 54: East Asia Market Volume (Units) Forecast by Functionality, 2020 to 2035
- Table 55: East Asia Market Value (US$ Mn) Forecast by Application, 2020 to 2035
- Table 56: East Asia Market Volume (Units) Forecast by Application, 2020 to 2035
- Table 57: East Asia Market Value (US$ Mn) Forecast by End-Use Industry, 2020 to 2035
- Table 58: East Asia Market Volume (Units) Forecast by End-Use Industry, 2020 to 2035
- Table 59: East Asia Market Value (US$ Mn) Forecast by Distribution Channel, 2020 to 2035
- Table 60: East Asia Market Volume (Units) Forecast by Distribution Channel, 2020 to 2035
- Table 61: South Asia Market Value (US$ Mn) Forecast by Country, 2020 to 2035
- Table 62: South Asia Market Volume (Units) Forecast by Country, 2020 to 2035
- Table 63: South Asia Market Value (US$ Mn) Forecast by Purity, 2020 to 2035
- Table 64: South Asia Market Volume (Units) Forecast by Purity, 2020 to 2035
- Table 65: South Asia Market Value (US$ Mn) Forecast by Functionality, 2020 to 2035
- Table 66: South Asia Market Volume (Units) Forecast by Functionality, 2020 to 2035
- Table 67: South Asia Market Value (US$ Mn) Forecast by Application, 2020 to 2035
- Table 68: South Asia Market Volume (Units) Forecast by Application, 2020 to 2035
- Table 69: South Asia Market Value (US$ Mn) Forecast by End-Use Industry, 2020 to 2035
- Table 70: South Asia Market Volume (Units) Forecast by End-Use Industry, 2020 to 2035
- Table 71: South Asia Market Value (US$ Mn) Forecast by Distribution Channel, 2020 to 2035
- Table 72: South Asia Market Volume (Units) Forecast by Distribution Channel, 2020 to 2035
- Table 73: Oceania Market Value (US$ Mn) Forecast by Country, 2020 to 2035
- Table 74: Oceania Market Volume (Units) Forecast by Country, 2020 to 2035
- Table 75: Oceania Market Value (US$ Mn) Forecast by Purity, 2020 to 2035
- Table 76: Oceania Market Volume (Units) Forecast by Purity, 2020 to 2035
- Table 77: Oceania Market Value (US$ Mn) Forecast by Functionality, 2020 to 2035
- Table 78: Oceania Market Volume (Units) Forecast by Functionality, 2020 to 2035
- Table 79: Oceania Market Value (US$ Mn) Forecast by Application, 2020 to 2035
- Table 80: Oceania Market Volume (Units) Forecast by Application, 2020 to 2035
- Table 81: Oceania Market Value (US$ Mn) Forecast by End-Use Industry, 2020 to 2035
- Table 82: Oceania Market Volume (Units) Forecast by End-Use Industry, 2020 to 2035
- Table 83: Oceania Market Value (US$ Mn) Forecast by Distribution Channel, 2020 to 2035
- Table 84: Oceania Market Volume (Units) Forecast by Distribution Channel, 2020 to 2035
- Table 85: MEA Market Value (US$ Mn) Forecast by Country, 2020 to 2035
- Table 86: MEA Market Volume (Units) Forecast by Country, 2020 to 2035
- Table 87: MEA Market Value (US$ Mn) Forecast by Purity, 2020 to 2035
- Table 88: MEA Market Volume (Units) Forecast by Purity, 2020 to 2035
- Table 89: MEA Market Value (US$ Mn) Forecast by Functionality, 2020 to 2035
- Table 90: MEA Market Volume (Units) Forecast by Functionality, 2020 to 2035
- Table 91: MEA Market Value (US$ Mn) Forecast by Application, 2020 to 2035
- Table 92: MEA Market Volume (Units) Forecast by Application, 2020 to 2035
- Table 93: MEA Market Value (US$ Mn) Forecast by End-Use Industry, 2020 to 2035
- Table 94: MEA Market Volume (Units) Forecast by End-Use Industry, 2020 to 2035
- Table 95: MEA Market Value (US$ Mn) Forecast by Distribution Channel, 2020 to 2035
- Table 96: MEA Market Volume (Units) Forecast by Distribution Channel, 2020 to 2035
List Of Figures
- Figure 1: Global Market Volume (Units) Forecast 2020 to 2035
- Figure 2: Global Market Pricing Analysis
- Figure 3: Global Market Value (US$ Mn) Forecast 2020 to 2035
- Figure 4: Global Market Value Share and BPS Analysis by Purity, 2025 and 2035
- Figure 5: Global Market Y-o-Y Growth Comparison by Purity, 2025 to 2035
- Figure 6: Global Market Attractiveness Analysis by Purity
- Figure 7: Global Market Value Share and BPS Analysis by Functionality, 2025 and 2035
- Figure 8: Global Market Y-o-Y Growth Comparison by Functionality, 2025 to 2035
- Figure 9: Global Market Attractiveness Analysis by Functionality
- Figure 10: Global Market Value Share and BPS Analysis by Application, 2025 and 2035
- Figure 11: Global Market Y-o-Y Growth Comparison by Application, 2025 to 2035
- Figure 12: Global Market Attractiveness Analysis by Application
- Figure 13: Global Market Value Share and BPS Analysis by End-Use Industry, 2025 and 2035
- Figure 14: Global Market Y-o-Y Growth Comparison by End-Use Industry, 2025 to 2035
- Figure 15: Global Market Attractiveness Analysis by End-Use Industry
- Figure 16: Global Market Value Share and BPS Analysis by Distribution Channel, 2025 and 2035
- Figure 17: Global Market Y-o-Y Growth Comparison by Distribution Channel, 2025 to 2035
- Figure 18: Global Market Attractiveness Analysis by Distribution Channel
- Figure 19: Global Market Value (US$ Mn) Share and BPS Analysis by Region, 2025 and 2035
- Figure 20: Global Market Y-o-Y Growth Comparison by Region, 2025 to 2035
- Figure 21: Global Market Attractiveness Analysis by Region
- Figure 22: North America Market Incremental $ Opportunity, 2025 to 2035
- Figure 23: Latin America Market Incremental $ Opportunity, 2025 to 2035
- Figure 24: Europe Market Incremental $ Opportunity, 2025 to 2035
- Figure 25: East Asia Market Incremental $ Opportunity, 2025 to 2035
- Figure 26: South Asia Market Incremental $ Opportunity, 2025 to 2035
- Figure 27: Oceania Market Incremental $ Opportunity, 2025 to 2035
- Figure 28: MEA Market Incremental $ Opportunity, 2025 to 2035
- Figure 29: North America Market Value Share and BPS Analysis by Country, 2025 and 2035
- Figure 30: North America Market Value Share and BPS Analysis by Purity, 2025 and 2035
- Figure 31: North America Market Y-o-Y Growth Comparison by Purity, 2025 to 2035
- Figure 32: North America Market Attractiveness Analysis by Purity
- Figure 33: North America Market Value Share and BPS Analysis by Functionality, 2025 and 2035
- Figure 34: North America Market Y-o-Y Growth Comparison by Functionality, 2025 to 2035
- Figure 35: North America Market Attractiveness Analysis by Functionality
- Figure 36: North America Market Value Share and BPS Analysis by Application, 2025 and 2035
- Figure 37: North America Market Y-o-Y Growth Comparison by Application, 2025 to 2035
- Figure 38: North America Market Attractiveness Analysis by Application
- Figure 39: North America Market Value Share and BPS Analysis by End-Use Industry, 2025 and 2035
- Figure 40: North America Market Y-o-Y Growth Comparison by End-Use Industry, 2025 to 2035
- Figure 41: North America Market Attractiveness Analysis by End-Use Industry
- Figure 42: North America Market Value Share and BPS Analysis by Distribution Channel, 2025 and 2035
- Figure 43: North America Market Y-o-Y Growth Comparison by Distribution Channel, 2025 to 2035
- Figure 44: North America Market Attractiveness Analysis by Distribution Channel
- Figure 45: Latin America Market Value Share and BPS Analysis by Country, 2025 and 2035
- Figure 46: Latin America Market Value Share and BPS Analysis by Purity, 2025 and 2035
- Figure 47: Latin America Market Y-o-Y Growth Comparison by Purity, 2025 to 2035
- Figure 48: Latin America Market Attractiveness Analysis by Purity
- Figure 49: Latin America Market Value Share and BPS Analysis by Functionality, 2025 and 2035
- Figure 50: Latin America Market Y-o-Y Growth Comparison by Functionality, 2025 to 2035
- Figure 51: Latin America Market Attractiveness Analysis by Functionality
- Figure 52: Latin America Market Value Share and BPS Analysis by Application, 2025 and 2035
- Figure 53: Latin America Market Y-o-Y Growth Comparison by Application, 2025 to 2035
- Figure 54: Latin America Market Attractiveness Analysis by Application
- Figure 55: Latin America Market Value Share and BPS Analysis by End-Use Industry, 2025 and 2035
- Figure 56: Latin America Market Y-o-Y Growth Comparison by End-Use Industry, 2025 to 2035
- Figure 57: Latin America Market Attractiveness Analysis by End-Use Industry
- Figure 58: Latin America Market Value Share and BPS Analysis by Distribution Channel, 2025 and 2035
- Figure 59: Latin America Market Y-o-Y Growth Comparison by Distribution Channel, 2025 to 2035
- Figure 60: Latin America Market Attractiveness Analysis by Distribution Channel
- Figure 61: Europe Market Value Share and BPS Analysis by Country, 2025 and 2035
- Figure 62: Europe Market Value Share and BPS Analysis by Purity, 2025 and 2035
- Figure 63: Europe Market Y-o-Y Growth Comparison by Purity, 2025 to 2035
- Figure 64: Europe Market Attractiveness Analysis by Purity
- Figure 65: Europe Market Value Share and BPS Analysis by Functionality, 2025 and 2035
- Figure 66: Europe Market Y-o-Y Growth Comparison by Functionality, 2025 to 2035
- Figure 67: Europe Market Attractiveness Analysis by Functionality
- Figure 68: Europe Market Value Share and BPS Analysis by Application, 2025 and 2035
- Figure 69: Europe Market Y-o-Y Growth Comparison by Application, 2025 to 2035
- Figure 70: Europe Market Attractiveness Analysis by Application
- Figure 71: Europe Market Value Share and BPS Analysis by End-Use Industry, 2025 and 2035
- Figure 72: Europe Market Y-o-Y Growth Comparison by End-Use Industry, 2025 to 2035
- Figure 73: Europe Market Attractiveness Analysis by End-Use Industry
- Figure 74: Europe Market Value Share and BPS Analysis by Distribution Channel, 2025 and 2035
- Figure 75: Europe Market Y-o-Y Growth Comparison by Distribution Channel, 2025 to 2035
- Figure 76: Europe Market Attractiveness Analysis by Distribution Channel
- Figure 77: East Asia Market Value Share and BPS Analysis by Country, 2025 and 2035
- Figure 78: East Asia Market Value Share and BPS Analysis by Purity, 2025 and 2035
- Figure 79: East Asia Market Y-o-Y Growth Comparison by Purity, 2025 to 2035
- Figure 80: East Asia Market Attractiveness Analysis by Purity
- Figure 81: East Asia Market Value Share and BPS Analysis by Functionality, 2025 and 2035
- Figure 82: East Asia Market Y-o-Y Growth Comparison by Functionality, 2025 to 2035
- Figure 83: East Asia Market Attractiveness Analysis by Functionality
- Figure 84: East Asia Market Value Share and BPS Analysis by Application, 2025 and 2035
- Figure 85: East Asia Market Y-o-Y Growth Comparison by Application, 2025 to 2035
- Figure 86: East Asia Market Attractiveness Analysis by Application
- Figure 87: East Asia Market Value Share and BPS Analysis by End-Use Industry, 2025 and 2035
- Figure 88: East Asia Market Y-o-Y Growth Comparison by End-Use Industry, 2025 to 2035
- Figure 89: East Asia Market Attractiveness Analysis by End-Use Industry
- Figure 90: East Asia Market Value Share and BPS Analysis by Distribution Channel, 2025 and 2035
- Figure 91: East Asia Market Y-o-Y Growth Comparison by Distribution Channel, 2025 to 2035
- Figure 92: East Asia Market Attractiveness Analysis by Distribution Channel
- Figure 93: South Asia Market Value Share and BPS Analysis by Country, 2025 and 2035
- Figure 94: South Asia Market Value Share and BPS Analysis by Purity, 2025 and 2035
- Figure 95: South Asia Market Y-o-Y Growth Comparison by Purity, 2025 to 2035
- Figure 96: South Asia Market Attractiveness Analysis by Purity
- Figure 97: South Asia Market Value Share and BPS Analysis by Functionality, 2025 and 2035
- Figure 98: South Asia Market Y-o-Y Growth Comparison by Functionality, 2025 to 2035
- Figure 99: South Asia Market Attractiveness Analysis by Functionality
- Figure 100: South Asia Market Value Share and BPS Analysis by Application, 2025 and 2035
- Figure 101: South Asia Market Y-o-Y Growth Comparison by Application, 2025 to 2035
- Figure 102: South Asia Market Attractiveness Analysis by Application
- Figure 103: South Asia Market Value Share and BPS Analysis by End-Use Industry, 2025 and 2035
- Figure 104: South Asia Market Y-o-Y Growth Comparison by End-Use Industry, 2025 to 2035
- Figure 105: South Asia Market Attractiveness Analysis by End-Use Industry
- Figure 106: South Asia Market Value Share and BPS Analysis by Distribution Channel, 2025 and 2035
- Figure 107: South Asia Market Y-o-Y Growth Comparison by Distribution Channel, 2025 to 2035
- Figure 108: South Asia Market Attractiveness Analysis by Distribution Channel
- Figure 109: Oceania Market Value Share and BPS Analysis by Country, 2025 and 2035
- Figure 110: Oceania Market Value Share and BPS Analysis by Purity, 2025 and 2035
- Figure 111: Oceania Market Y-o-Y Growth Comparison by Purity, 2025 to 2035
- Figure 112: Oceania Market Attractiveness Analysis by Purity
- Figure 113: Oceania Market Value Share and BPS Analysis by Functionality, 2025 and 2035
- Figure 114: Oceania Market Y-o-Y Growth Comparison by Functionality, 2025 to 2035
- Figure 115: Oceania Market Attractiveness Analysis by Functionality
- Figure 116: Oceania Market Value Share and BPS Analysis by Application, 2025 and 2035
- Figure 117: Oceania Market Y-o-Y Growth Comparison by Application, 2025 to 2035
- Figure 118: Oceania Market Attractiveness Analysis by Application
- Figure 119: Oceania Market Value Share and BPS Analysis by End-Use Industry, 2025 and 2035
- Figure 120: Oceania Market Y-o-Y Growth Comparison by End-Use Industry, 2025 to 2035
- Figure 121: Oceania Market Attractiveness Analysis by End-Use Industry
- Figure 122: Oceania Market Value Share and BPS Analysis by Distribution Channel, 2025 and 2035
- Figure 123: Oceania Market Y-o-Y Growth Comparison by Distribution Channel, 2025 to 2035
- Figure 124: Oceania Market Attractiveness Analysis by Distribution Channel
- Figure 125: MEA Market Value Share and BPS Analysis by Country, 2025 and 2035
- Figure 126: MEA Market Value Share and BPS Analysis by Purity, 2025 and 2035
- Figure 127: MEA Market Y-o-Y Growth Comparison by Purity, 2025 to 2035
- Figure 128: MEA Market Attractiveness Analysis by Purity
- Figure 129: MEA Market Value Share and BPS Analysis by Functionality, 2025 and 2035
- Figure 130: MEA Market Y-o-Y Growth Comparison by Functionality, 2025 to 2035
- Figure 131: MEA Market Attractiveness Analysis by Functionality
- Figure 132: MEA Market Value Share and BPS Analysis by Application, 2025 and 2035
- Figure 133: MEA Market Y-o-Y Growth Comparison by Application, 2025 to 2035
- Figure 134: MEA Market Attractiveness Analysis by Application
- Figure 135: MEA Market Value Share and BPS Analysis by End-Use Industry, 2025 and 2035
- Figure 136: MEA Market Y-o-Y Growth Comparison by End-Use Industry, 2025 to 2035
- Figure 137: MEA Market Attractiveness Analysis by End-Use Industry
- Figure 138: MEA Market Value Share and BPS Analysis by Distribution Channel, 2025 and 2035
- Figure 139: MEA Market Y-o-Y Growth Comparison by Distribution Channel, 2025 to 2035
- Figure 140: MEA Market Attractiveness Analysis by Distribution Channel
- Figure 141: Global Market - Tier Structure Analysis
- Figure 142: Global Market - Company Share Analysis
- FAQs -
What was the Global Gamma Butyrolactone (GBL) Market Size Reported by Fact.MR for 2024?
The global gamma butyrolactone (GBL) market was valued at USD 3,856 Million in 2024.
Who are the Major Players Operating in the Gamma Butyrolactone (GBL) Market?
Prominent players in the market are BASF SE, LyondellBasell Industries, Ashland Inc., Mitsubishi Chemical Corporation, Dairen Chemical Corporation, among others.
What is the Estimated Valuation of the Gamma Butyrolactone (GBL) Market in 2035?
The market is expected to reach a valuation of USD 5,690 Million in 2035.
What Value CAGR did the Gamma Butyrolactone (GBL) Market Exhibit Over the Last Five Years?
The historic growth rate of the gamma butyrolactone (GBL) market was 3.1% from 2020 to 2024.