


- Base Value(2025): 117.5 Bn
- Forecast Value (2035): 333.6 Bn
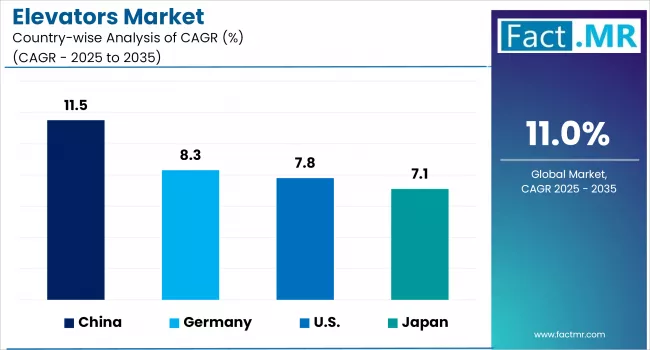
- CAGR (2035): 11.0%
Elevators Market Outlook (2025 to 2035)
The global elevators market is projected to increase from USD 117.5 billion in 2025 to USD 333.6 billion by 2035, with a CAGR of 11.0% during the forecast period. Growth is driven by rapid urbanization and high-rise construction. The integration of smart technologies and energy-efficient systems is fueling innovation and accelerating the modernization of elevators.
-Analysis-2025-to-2035.webp)
What are the Drivers of the Elevators Market?
The elevators market growth is driven by rapid urbanization and increasing construction of high-rise buildings in developing economies. As cities continue to expand vertically to accommodate growing populations, the need for efficient vertical transportation systems has become essential. Urban infrastructure development projects such as residential towers, commercial skyscrapers, shopping malls, and metro stations, are significantly boosting the installation of elevators. In countries like India, China, and Indonesia, large-scale housing schemes and smart city initiatives are contributing substantially to the rising demand.
Technological advancements are another critical factor accelerating market growth. Modern elevators are no longer just transport mechanisms but are increasingly integrated with smart technologies such as IoT sensors, AI-based predictive maintenance, biometric access, and touchless controls. These innovations are not only improving the user experience but also enhancing operational efficiency and safety. For commercial buildings, hotels, and hospitals, the adoption of smart elevators has become a value-add, aligning with the broader trend of intelligent building systems and automation.
The growing emphasis on energy efficiency and sustainability is also shaping the future of elevator industry. Developers and building owners are now seeking eco-friendly elevator systems that consume less power, generate lower emissions, and support green building certifications like LEED and BREEAM. Features such as regenerative drives, compact machine-room-less (MRL) designs, and energy-efficient lighting are increasingly in demand. This trend is particularly strong in regions with strict environmental regulations, such as Europe and North America, where sustainable construction is a high priority.
The need to modernize aging elevator infrastructure in developed markets is creating new opportunities for growth. Many older buildings, especially in Europe and North America, are equipped with outdated elevator systems that lack modern safety features and technological capabilities.
Upgrading these systems is crucial not only for compliance with new safety regulations but also for improving accessibility and energy performance. As a result, modernization and retrofit projects are becoming an important revenue stream for elevator manufacturers and service providers, further contributing to the market expansion.
What are the Regional Trends of Elevators Market?
Asia Pacific region dominates the global elevators market, both in terms of revenue and installation volume, and continues to be the fastest-growing region. This growth is largely fueled by rapid urbanization, large-scale residential and commercial construction, and government-backed infrastructure projects.
Countries such as China and India are at the forefront, with increasing demand driven by expanding cities, rising middle-class populations, and mega initiatives like China’s urban transit expansion and India’s Smart Cities Mission. Moreover, Japan and South Korea contribute significantly through the modernization of aging elevator systems and early adoption of smart technologies.
North America is witnessing steady growth, with a major focus on modernization, smart elevators, and code-compliant upgrades. The U.S. and Canada have a large number of older buildings that require retrofitting to meet evolving safety and energy regulations.
Moreover, the growing adoption of AI-powered maintenance systems, destination dispatch technology, and IoT-enabled elevators is reshaping the market landscape. Demand is particularly strong in urban commercial hubs, healthcare institutions, and mixed-use developments, where building owners are investing in smart and sustainable mobility solutions to enhance property value and tenant experience.
In Europe, the market is characterized by a strong emphasis on sustainability, safety, and modernization. As most of the elevator infrastructure in Western Europe is already well-established, current trends focus on retrofitting and upgrading old systems to meet the EU's stringent safety and energy-efficiency standards. Countries such as Germany, France, Italy, and the UK are experiencing significant investments in eco-friendly, smart elevators with regenerative drives and predictive maintenance technologies.
The Middle East region is emerging as a promising market, driven by ambitious urban development projects and smart city initiatives. In the Middle East, countries like Saudi Arabia, the UAE, and Qatar are investing heavily in skyscrapers, luxury hotels, and transport hubs as a part of their economic diversification efforts. Projects like NEOM City in Saudi Arabia and various infrastructure developments in the UAE are accelerating demand for advanced elevator systems.
What are the Challenges and Restraining Factors of the Elevators Market?
One of the primary restraints is high initial investment and installation cost associated with advanced elevator systems, particularly those integrated with smart technologies and energy-efficient components. In many developing economies, elevated costs of smart elevators can limit the adoption. Moreover, installing elevators in existing buildings for retrofitting purposes may require significant structural modifications, which further increases project costs and complexity.
Another significant challenge is the strict regulatory compliance and varying building codes across different countries and regions. Elevator manufacturers and service providers must adhere to diverse safety, design, and energy-efficiency regulations, which often change over time. This makes global standardization difficult and increases R&D and compliance costs for companies. For instance, compliance with EU EN 81 standards or ASME codes in the U.S. necessitates continuous product adjustments and documentation. Any failure to meet these requirements can lead to installation delays or legal consequences.
Maintenance and operational downtime pose additional concerns, especially for smart and IoT-enabled elevators. Although these technologies offer enhanced performance, they require continuous connectivity, software updates, and regular servicing, which can be resource-intensive.
In regions where trained technicians or digital infrastructure are lacking, particularly in rural areas or developing nations, maintaining modern elevators can be a challenge. Frequent maintenance issues or poor after-sales support can also affect customer satisfaction and hinder market growth.
Economic fluctuations and construction sector slowdowns can significantly impact the elevator demand. The market is closely tied to real estate and infrastructure industries, which are sensitive to changes in economic conditions, interest rates, and government policies. Periods of recession, housing crises, or reduced public infrastructure budgets can delay or cancel construction projects, reducing the need for new elevator installations.
Country-Wise Outlook
The U.S. Elevators Market sees Growth Driven by Modernization of Aging Infrastructure
The U.S. elevators market is experiencing moderate but steady growth, primarily driven by the modernization of aging infrastructure, increasing demand for smart elevator solutions, and ongoing urban development in major metropolitan areas.
A key growth factor is the need to modernize and retrofit existing elevator systems in older buildings, particularly in dense urban centers like New York City, Chicago, and San Francisco.Many of these buildings are decades old and do not meet current safety, energy efficiency, or accessibility standards. Building owners are increasingly investing in upgrades to comply with local building codes, improve tenant experience, and reduce maintenance costs. The integration of smart technologies such as IoT-enabled diagnostics, destination dispatch, and touchless controls, is further boosting modernization efforts across both commercial and residential sectors.
-Analysis-2025-to-2035.webp)
The market is also supported by growing investments in healthcare facilities, airports, mixed-use developments, and high-rise commercial buildings, especially in states like Texas, Florida, and California. These sectors require efficient and reliable vertical mobility solutions to handle high foot traffic and support building functionality. Moreover, the push for green buildings and sustainable construction practices is increasing the demand for energy-efficient elevators with regenerative drives and compact machine-room-less (MRL) designs.
However, despite these positive trends, market growth is somewhat restrained by high capital costs for advanced elevator systems and labor shortages in skilled maintenance personnel. Moreover, regulatory variations across states can make nationwide implementation of certain technologies or design standards more complex. Nevertheless, with a strong focus on urban renewal, technological innovation, and safety compliance, the U.S. elevators market is expected to continue on a stable upward trajectory through the end of the decade.
China witnesses Rapid Market Growth Backed by Growing Urbanization
The rapid growth of the elevator market in China is primarily driven by aggressive urbanization, with second- and third-tier cities developing high-rise residential and commercial infrastructure to support expanding urban populations. According to industry reports, over 60% of new high-rise buildings in China now incorporate advanced vertical transportation systems, highlighting the country’s strong reliance on elevator solutions for modern city planning.
A major contributor to this growth is the Chinese government’s substantial investment in infrastructure development and smart city initiatives. Ambitious projects such as railway expansions, airport terminals, hospitals, and metro stations across cities like Shanghai, Beijing, Chengdu, and Wuhan are driving large-scale elevator and escalator installations. Furthermore, China’s Five-Year Plans include strong provisions for sustainable urban development and digital infrastructure, encouraging the deployment of smart elevators equipped with IoT, AI, and cloud-based maintenance systems. This has led to a notable shift toward intelligent and energy-efficient elevator technologies.
Technological innovation is a key driver shaping the evolution of the market. China is increasingly adopting smart elevator systems that feature predictive maintenance, real-time monitoring, biometric access, and destination dispatch control. Both global giants like OTIS, KONE, and Schindler and domestic manufacturers are competing aggressively by offering tailored smart elevator solutions designed for the local market.
The growing adoption of machine-room-less (MRL) elevators and regenerative drive systems is also helping to reduce energy consumption, in line with China’s goals for carbon neutrality and green building standards. In 2024 alone, nearly half of new elevator installations in urban centers featured some form of energy-saving technology.
The modernization of aging elevator infrastructure is also a significant growth driver, particularly in older residential and public buildings. With the government promoting elevator retrofitting programs in older mid-rise housing, opportunities are expanding for upgrading outdated systems with safer, more efficient models.
The elevator market in China faces challenges such as strong competition and pricing pressure. However, supportive government policies, rising middle-class housing demand, and smart technology adoption continue to strengthen its position as a global market leader.
Expansion in the construction industry to propel the market growth in Japan
The Japan’s elevator and escalator market is driven by construction expansion, urban redevelopment, and infrastructure investments. Projects such as the Redevelopment of Shibuya, preparations for the Osaka Expo 2025, and major urban transit developments like the Chūō Shinkansen maglev line are boosting demand for both new installations and modernization services.
Aging infrastructure and Japan’s rapidly aging population are fueling demand for modernization and accessibility enhancements. Retrofits and safety upgrades are especially vital to meet evolving regulatory requirements and improve compliance in medical institutions, residential homes, and public buildings. Furthermore, seismic safety standards in regions like Kansai and Kanto are prompting updates to elevator systems and controls in high-density zones like Tokyo and Osaka.
Technological innovation is reshaping the market with the rollout of smart and energy-efficient elevator solutions. The adoption of IoT-enabled predictive maintenance, destination dispatch, touchless panels, and regenerative drives is becoming widespread, particularly in new commercial and premium residential developments. For example, Nippon Otis installed specially designed smart elevators in the Tokyo Azabudai Hills project, while Hitachi experimented with touchless controls in Tokyo Midtown Yaesu.
Japan’s market continues to expand moderately, blending steady growth in new builds with a strong push for modernization, safety, and advanced technology. Aging infrastructure and seismic regulations provide significant retrofit opportunities, while developers in urban centers increasingly demand efficient, connected, and eco-friendly vertical transportation systems.
Category-wise Analysis
Single Deck to Exhibit Leading by Deck Type
The single deck segment dominates the global elevators market due to its widespread application in residential and mid-rise commercial buildings, driven by its cost-effectiveness, ease of installation, and lower maintenance requirements. These elevators are ideal for buildings with moderate traffic flow and standard floor heights, making them a preferred choice in both developing and developed regions.
Moreover, the lower structural and operational complexity of single deck systems enables quicker installation and easier integration, further supporting their widespread adoption. The continued construction of mid-rise apartment blocks and offices, continues to strengthen the segment's position.
The double deck segment is expected to witness the fastest growth during the forecast period. This growth is primarily driven by the rising demand for space optimization and improved traffic management in high-rise commercial buildings, particularly in densely populated metropolitan cities. Double deck elevators, which feature two vertically attached cabins operating simultaneously, can transport more passengers efficiently by serving two floors at once, thus reducing wait times and increasing throughput.
Their growing adoption in skyscrapers, corporate headquarters, and transportation hubs such as airports and metro stations, is a key factor accelerating segment growth. Technological advancements in control systems and increased high-rise developments in Asia Pacific and the Middle East further contribute to the rapid expansion of this segment.
Smart to Exhibit leading by Destination Control
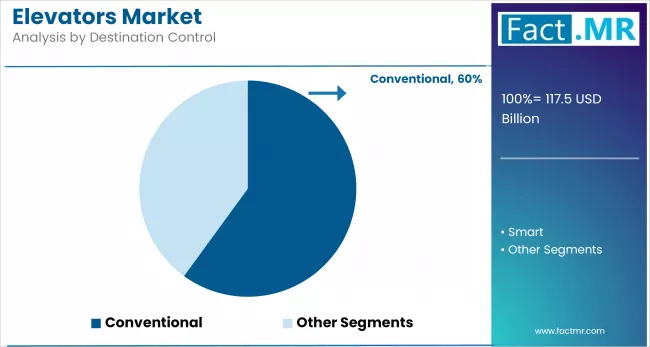
The conventional destination control segment holds the dominant share in the global elevators market. These systems, where passengers select their desired floor inside the elevator car, have long been the industry standard and are commonly used in residential buildings, low- to mid-rise commercial complexes, and public infrastructure.
Their simplicity, affordability, and broad compatibility with traditional elevator designs make them the preferred choice in both developing and cost-sensitive markets. Moreover, for smaller buildings with moderate traffic, conventional control systems offer sufficient efficiency without requiring the complexity or investment of advanced technologies.
The smart destination control segment is anticipated to be the fastest-growing over the forecast period, fueled by the rising demand for intelligent building solutions and efficient vertical traffic management. Smart destination control systems use algorithms, AI, and IoT technologies to group passengers going to the same or nearby floors, significantly reducing waiting and travel times, especially in high-rise buildings, corporate headquarters, hotels, and airports. These systems improve energy efficiency, optimize elevator usage, and enhance the passenger experience.
The increasing focus on smart city projects, energy efficiency mandates, and premium building developments across regions like North America, the Middle East, and Asia Pacific is further accelerating the adoption of smart destination control systems in the market.
Passenger Elevator to Exhibit Leading by Application
The passenger elevator segment dominates the global elevators market due to its extensive usage in residential buildings, commercial offices, shopping malls, airports, hotels, and hospitals.
This segment benefits significantly from urbanization, population growth, and vertical expansion in cities, which drive the construction of mid- to high-rise structures requiring efficient vertical transportation for people. The increasing focus on safety, comfort, and aesthetics, combined with growing demand for smart, energy-efficient, and touchless technologies, is further supporting the widespread adoption of passenger elevators.
The freight elevator segment is projected to witness the fastest growth over the forecast period, primarily driven by the expanding logistics, industrial, manufacturing, and warehouse sectors. These elevators are specifically designed for transporting heavy goods, machinery, and materials across floors in factories, retail distribution centers, and hospitals. The rising demand for automated and heavy-duty vertical transportation solutions, especially in large-scale retail and industrial settings, is fueling the growth of this segment.
Low-Rise to Exhibit Leading by Building Height
The low-rise building segment dominates the market due to its widespread use in suburban and semi-urban developments, driven by affordable housing projects, rapid population growth. The structure of these buildings typically includes up to four stories, commonly used for residential homes, small offices, and retail spaces. These buildings require less complex construction systems, leading to faster project completion and lower costs. Demand is high in suburban and rural areas due to population spread and affordable housing initiatives.
High-rise buildings, often exceeding 10 stories, are primarily found in urban centers and metros where land availability is limited. These structures are used for commercial offices, luxury apartments, and mixed-use complexes. Growth is driven by rapid urbanization, vertical city planning, and the demand for efficient land use in high-density areas. Technological advancements in elevators, building materials, and energy-efficient systems further fuel development.
1 to 3 m/s to Exhibit Leading by Speed
Elevators with speeds between 1 to 3 m/s dominate the global market, driven by their widespread use in mid-rise residential and commercial buildings. This speed range offers an optimal balance between energy efficiency, passenger comfort, and cost, making it ideal for urban developments and office complexes. As urbanization rises and infrastructure expands in developing regions, this segment continues to lead in both volume and revenue across the elevator industry.
While the 1 to 3 m/s segment dominates, elevators with speeds above 10 m/s are gaining traction in supertall skyscrapers and high-density business hubs. These ultra-high-speed elevators are essential in megacities like Shanghai, Dubai, and Tokyo, where fast vertical transportation is critical. Another growing category is the 4 to 6 m/s segment, used in premium commercial buildings and hotels, offering faster service without the infrastructure demands of ultra-high-speed systems.
Residential to Exhibit Leading by End-Use
The residential segment leads the elevators market, driven by rapid urbanization, rising apartment construction, and the growing need for accessible vertical mobility in multi-story housing. Government-backed affordable housing projects and increased adoption of elevators in mid-rise and high-rise residential complexes further fuel this demand. In both developing and developed countries, the surge in vertical living spaces makes residential use the most dominant end-use segment in terms of volume and installations.
The commercial segment is witnessing steady growth due to the increasing construction of office buildings, malls, hotels, and healthcare facilities. Demand for faster, smarter, and more energy-efficient elevator systems is rising as businesses prioritize convenience and customer experience. Commercial spaces often require high-capacity, high-speed elevators equipped with modern safety and smart access features, especially in metro cities and business districts.
Competitive Analysis
The global elevators market is becoming increasingly competitive, with a mix of established multinational corporations and regional players striving for market dominance through innovation, service expansion, and strategic partnerships.
The key players compete across parameters such as technological innovation, product quality, energy efficiency, safety features, after-sales services, and global reach. A few major companies hold a significant share of the global market, leveraging their extensive distribution networks, R&D investments, and long-term service contracts to maintain leadership positions.
The top market leaders include KONE Corporation (Finland), Schindler Group (Switzerland), Mitsubishi Electric Corporation (Japan), and Hitachi Ltd. (Japan). These players dominate both new installations and modernization services. Otis, for example, leads in global unit volume and has focused heavily on digitization and connected services like its Gen2 and Otis One platforms. KONE is known for its eco-efficient solutions and smart elevator systems, including its AI-based predictive maintenance service, KONE 24/7 Connected Services. Schindler and Mitsubishi are strong in both Western and Asian markets, offering advanced vertical mobility solutions tailored to regional preferences.
Several regional and local players are emerging strongly, particularly in Asia-Pacific, where markets like China and India show high volume growth. Companies such as Toshiba Elevator and Building Systems, Fujitec, Hyundai Elevator, and local Chinese brands (e.g., Canny Elevator, Shenyang Yuanda) are gaining ground by offering cost-effective and locally tailored solutions. These companies typically target government projects, residential developments, and industrial applications, emphasizing customization and competitive pricing.
To maintain competitiveness, companies are increasingly investing in R&D and digital transformation. Key trends shaping competition include the adoption of smart technologies (IoT, AI, predictive analytics), machine-room-less (MRL) systems, energy-efficient designs, and touchless or voice-activated controls. Strategic partnerships, mergers & acquisitions, and long-term maintenance contracts are also common competitive strategies. For instance, Otis's acquisition of Bay State Elevator and KONE’s collaborations with smart building companies illustrate moves to expand both market share and technical capabilities.
Key players in the market are Mitsubishi Electric Corporation, KONE Oyj, The Schindler Group, Fujitec, Hitachi Ltd., Hyundai Elevator, Canny Elevator, Orona, and other players.
Recent Development
- In April 2024, Mitsubishi Electric announced a deal to deliver 125 next-generation elevators for Vietnam’s Grand Tower, marking the country’s first deployment of their “Elevator of the Future” technology.
- In March 2024, ThyssenKrupp secured a contract to supply 105 high-speed elevators, capable of speeds up to 21 m/s, for the upcoming Jeddah Tower in Saudi Arabia.
Segmentation of the Elevators Market
-
By Deck Type :
- Single Deck
- Double Deck
-
By Building Height :
- Low Rise
- High Rise
- Mid Rise
-
By Speed :
- Less than 1 m/s
- Between 1 to 3 m/s
- Between 4 to 6 m/s
- Between 7 to 10 m/s
- Above 10 m/s
-
By Destination Control :
- Smart
- Conventional
-
By Application :
- Passengers
- Freight
-
By End-Use :
- Commercial
- Residential
- Mix Blocks
-
By Region :
- North America
- Latin America
- Western Europe
- Eastern Europe
- East Asia
- South Asia & Pacific
- Middle East & Africa
- Frequently Asked Questions -
What is the Global Elevators Market size in 2025?
The elevators market is valued at USD 117.5 billion in 2025.
Who are the Major Players Operating in the Elevators Market?
Prominent players in the market include Mitsubishi Electric Corporation, KONE Oyj, The Schindler Group, Fujitec, Hitachi Ltd., and Hyundai Elevator.
What is the Estimated Valuation of the Elevators Market by 2035?
The market is expected to reach a valuation of USD 333.6 billion by 2035.
At what CAGR is the Elevators Market slated to grow during the study period?
The growth rate of the elevators market is 11.0% from 2025-2035.