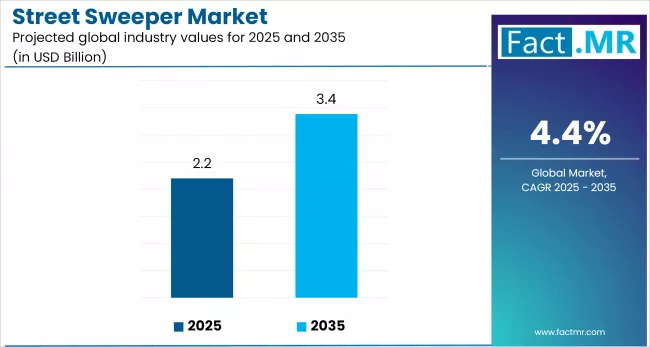
Street Sweeper Market

Street Sweeper Market Analysis, By Product, By End-Use, By Propulsion, and Region - Market Insights 2025 to 2035

Analysis of Street Sweeper Market Covering 30+ Countries Including Analysis of US, Canada, UK, Germany, France, Nordics, GCC countries, Japan, Korea and many more.

Street Sweeper Market Outlook (2025 to 2035)

The global street sweeper market is projected to increase from USD 2.2 billion in 2025 to USD 3.4 billion by 2035, with a CAGR of 4.4%, driven by strict environmental regulations encouraging the adoption of low-emission street cleaning equipment. Their use makes them ideal for urban environments that prioritize sustainability and efficiency, particularly within smart city infrastructure that incorporates IoT-based systems.

Street Sweeper Market

What are the Drivers of the Street Sweeper Market?

The expansion of road networks, driven by the need for improved urban mobility and economic activity, is a key growth driver for the street sweeper market. As interconnected roads facilitate greater movement of people and vehicles, the demand for regular cleaning and maintenance rises, prompting increased adoption of professional street sweepers to ensure cleanliness, safety, and adherence to environmental standards.

In May 2024, the Bureau of Transportation Statistics reported that the Infrastructure Investment and Jobs Act allocated USD 673.8 billion for transportation, with USD 379.3 billion, or 56%, going to highways, distributed equally over five years from 2022 to 2026.

Government regulations aimed at reducing air pollution and particulate matter emissions are prompting cities to upgrade their street cleaning equipment. Traditional diesel-powered sweepers are being replaced with electric and hybrid models in order to reduce noise and environmental impact. This shift is consistent with broader sustainability and carbon reduction goals.

Advancements in telematics, GPS tracking, and automation technologies are also propelling the market. Smart sweepers equipped with route optimization and remote diagnostics enhance operational efficiency while reducing fuel consumption. These innovations are particularly appealing in cities that have implemented smart infrastructure and digital fleet management systems.

In addition to municipalities, demand from the private sector is increasing. Airports, industrial parks, and commercial zones all require regular maintenance to ensure safety and compliance with relevant regulations. The combination of growing cities, policy support, technological innovation, and health awareness is driving global demand for advanced, efficient, and long-term street sweeping solutions.

What are the Regional Trends of the Street Sweeper Market?

North America's strong market position is due to its well-developed urban infrastructure, stringent environmental regulations, and high levels of urbanization. The region includes countries such as the U.S. and Canada, where municipalities and organizations are increasing their investments in advanced street cleaning solutions to improve urban cleanliness and air quality.

The European Union's significant investment in infrastructure development, such as the Next Generation EU recovery plan, is having an impact on the increasing demand for street sweepers to clean roads and public areas. This is especially evident in Eastern Europe, where public sanitation equipment is being modernized.

The increased number of compact street sweeper manufacturers in China and Hong Kong has contributed to the growth of the Asia-Pacific region. Increased urbanization, particularly in India and China, has driven up demand for a clean environment, creating new market opportunities.

The LAMEA region is expected to grow at a healthy rate in the coming years, primarily driven by Dubai Municipality's superior hygiene services for cleaning roads and highways. Large airport and road networks in countries such as Brazil and Mexico help to expand the regional market.

What are the Challenges and Restraining Factors of the Street Sweeper Market?

A major constraint is the high capital cost of advanced sweepers, particularly electric and hybrid models, which can cost 30-50% more than traditional diesel models. This poses a challenge for smaller municipalities and low-income areas, where budgets are limited and cleaning operations continue to rely heavily on manual labour or outdated equipment. Manual sweeping is still common in Africa and Southeast Asia due to economic constraints.

The lack of charging infrastructure and skilled maintenance support for electric sweepers. Despite the growing interest in low-emission solutions, many cities in developing and emerging economies lack the infrastructure to support electric vehicles. While Western European countries have begun to phase in electric sweepers as a part of their green mobility policies, cities in South America and Asia are experiencing delays in implementation due to infrastructure gaps and a lack of trained operators.

A shortage of skilled labour causes operational inefficiencies as well. Advanced sweepers with GPS integration, automation features, and onboard diagnostics necessitate trained personnel, but many municipalities face labour shortages. According to a 2023 survey by North America's Municipal Equipment Maintenance Association, 38% of respondents cited operator shortages as a barrier to implementing newer technologies.

Emissions and safety standards vary widely across regions, complicating production and raising costs. Manufacturers must customize products to meet a variety of local regulations, which limits economies of scale.

Country-Wise Outlook

U.S. Street Sweeper Innovation Through Urbanization and Smart City Integration

Street Sweeper Market Cagr Analysis By Country

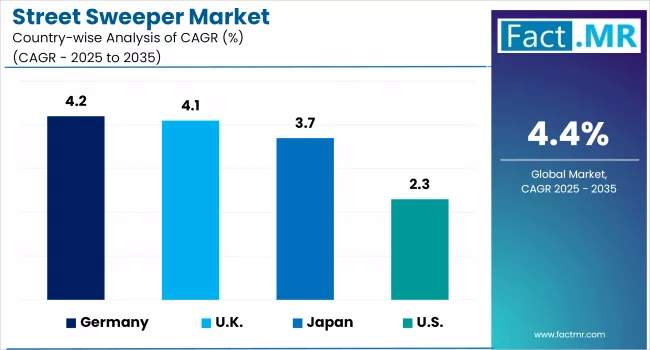
The growth of the street sweeper industry in the U.S. is primarily driven by urbanization and the transition of smart programs to electric and hybrid technologies.

States across the U.S. are rapidly urbanizing and investing in advanced infrastructure. Along with smart city initiatives, emerging trends are driving the development of smart street sweepers that produce minimal noise. Many municipalities are integrating street sweepers into smart city programs, utilizing data analytics and GPS tracking to optimize routes and manage fleets.

United States Street Sweeper Market Value Analysis

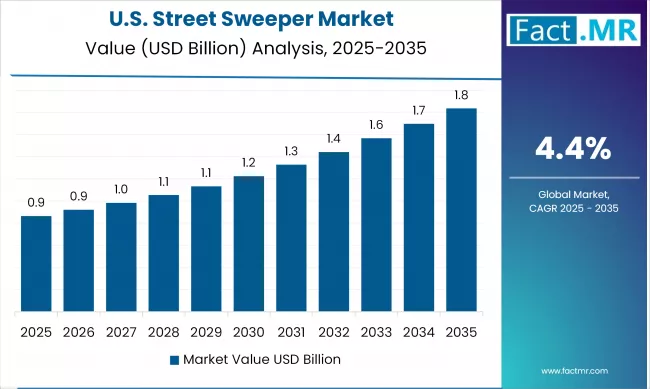
There is an increase in demand for street sweepers that emit no pollution and are environmentally friendly. Municipalities throughout the city are investing in electric street sweepers to reduce carbon footprints and noise pollution.

The Federal Emergency Management Agency (FEMA) provided nearly $2.6 million to restore critical roads and bridges in Barranquitas and Caguas municipalities after Hurricane María. This helped restore road infrastructure and minimize future damage in the region.

U.K. Accelerates Investment in Clean and Sustainable Street Sweeping Solutions

The U.K. street sweeper market is expanding due to rising demand for cleaner urban infrastructure and a growing public focus on environmental quality. Local governments are prioritizing investments in modern sweepers to combat particulate pollution, urban litter, and climate change.

The U.K.'s emphasis is on lowering PM2.5 and PM10 levels. According to DEFRA (Department for Environment, Food, and Rural Affairs), road dust contributes significantly to urban air pollution. As a result, municipalities are turning to high-efficiency vacuum sweepers to collect finer particulates, particularly in areas with heavy pedestrian and bicycle traffic.

A significant trend is the shift to zero-emission fleets. Councils in Sheffield and Leeds have tested hydrogen-powered sweepers, funded by the U.K.'s Hydrogen for Transport Programme. This establishes the U.K. as an early adopter of alternative fuel technologies in municipal services.

Government regulations actively shape market behaviour. The Air Quality Standards Regulations of 2010, along with the implementation of Local Air Quality Management (LAQM), have made clean road surfaces a legal requirement. Furthermore, the ULEZ expansion in Greater London (2023) now imposes strict emissions rules on operational vehicles, including sweepers, requiring councils and contractors to adopt compliant models.

The U.K. also offers unique opportunities for retrofitting and refurbishing older machines. Programs such as the Clean Vehicle Retrofit Accreditation Scheme (CVRAS) help convert diesel-powered sweepers to low-emission systems, creating a market for retrofit solution providers.

Japan’s Focus on Low-Noise Cleaning Technologies

Japan's maturing infrastructure needs efficient, low-noise operations in residential zones. Cities prioritize quiet, non-intrusive cleaning methods, as more than 28% of Japan's population is 65 and older. This has resulted in the use of electric sweepers with low decibel ratings, particularly during nighttime operations.

The growing use of autonomous and semi-autonomous sweepers reflects Japan's strong tradition of technological innovation. Trials in cities such as Tsukuba, a smart city testbed, have demonstrated that AI-powered sweepers can be deployed successfully when combined with obstacle avoidance and route optimization technology.

Environmental regulations are also crucial. Municipal governments in Japan are encouraged to use low-emission public service vehicles under the Air Pollution Control Law and the Low Carbon City Promotion Act. The Tokyo Metropolitan Government has mandated the use of low-carbon vehicles for public cleaning, which has boosted demand for electric and hybrid sweepers.

Category-wise Analysis

Mechanical Broom Sweepers to Exhibit Leading by Product

Street Sweeper Market Analysis By Product

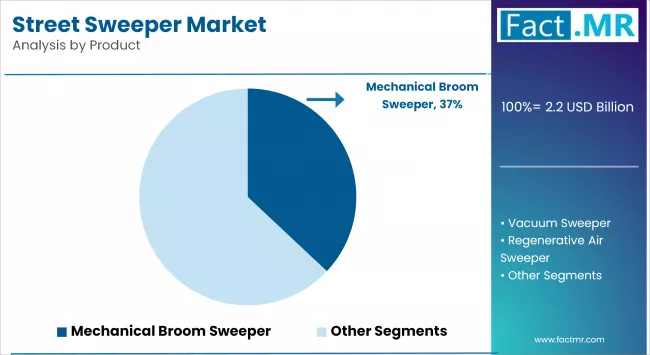
Mechanical broom sweepers are the most popular and well-established segment of the street sweeper market. These machines utilise rotating brooms and conveyor belts to collect larger debris, such as gravel, leaves, and sand, making them ideal for municipal roads, construction sites, and highways.

Their tough design, cost-effectiveness, and ability to handle heavy and coarse materials make them a popular choice, particularly in areas with frequent roadwork or seasonal debris. Their popularity is supported by their simplicity, durability, and lower maintenance requirements when compared to more complex sweeper types.

Regenerative air sweepers are an advanced and environmentally efficient solution for the street sweeper market. Unlike traditional vacuum sweepers, which rely solely on suction, regenerative air sweepers use a closed-loop air system. This system blasts air onto the surface to remove dirt and debris, then immediately vacuums it away with the same air stream. The regenerated air is continuously recycled within the system, saving energy and enhancing cleaning efficiency.

Municipal Corporations to Exhibit Leading by End-Use

Street Sweeper Market Analysis By End Use

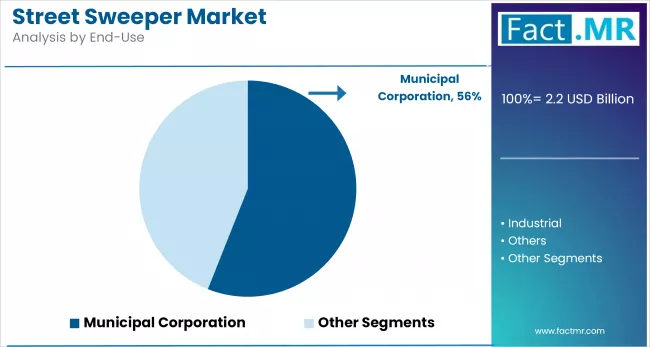
Municipalities are responsible for maintaining road cleanliness, ensuring public hygiene, and promoting environmental health, particularly in high-traffic urban areas. Every day, street sweepers remove dust, debris, and waste from roads, pavements, and public spaces. Municipalities are investing in electric, low-emission, data-integrated sweepers due to the rise of smart cities, environmental regulations, and increasing population density. Municipalities are street sweeper manufacturers' most reliable and high-demand customers, due to their budgetary stability, commitment to public safety, and sustainability goals.

Industrial street sweepers are gaining popularity as factories, warehouses, ports, and logistics hubs utilize them to maintain clean facilities. Sweepers manage fine dust, hazardous debris, and environmental compliance in manufacturing, mining, and petrochemical industries.

Advanced, high-capacity sweepers with dust control features and rugged designs are gaining popularity among industrial users as workplace safety and air quality regulations become more stringent. This segment also prefers small, portable models for indoor and confined areas. Industrial users account for a smaller market share than municipal users, but automation and regulation are driving growth.

Diesel-Powered Sweepers to Exhibit Leading by Propulsion

Diesel-powered street sweepers dominate the global market due to their power, durability, and ability to withstand heavy-duty operations over the long term. Municipalities and industrial operators use these machines to sweep large roads and heavy debris. Diesel sweepers are popular due to their availability, reliability, and compatibility with maintenance infrastructure. Diesel cars are affordable and often lack electric charging infrastructure in some areas, so many cities and towns continue to use them despite environmental concerns.

Electric street sweepers are gaining popularity due to global sustainability goals and stricter emission regulations. Governments in Europe, North America, and Asia are offering subsidies and incentives to promote the use of zero-emission street cleaning vehicles. Low noise and zero tailpipe emissions make these sweepers ideal for residential areas and nighttime operations in urban areas. Their initial costs and limited range have been issues, but technological advances and infrastructure development are increasing their use in smart city projects.

Competitive Analysis

The global street sweeper market is becoming increasingly competitive, with a mix of established equipment manufacturers, specialized environmental solution providers, and emerging tech-driven companies catering to municipalities, industrial facilities, and private contractors. This competitive environment is fueled by innovations in sweeping efficiency, emission reduction technologies, noise control, and the integration of smart features such as GPS tracking, telematics, and autonomous navigation.

Modern street sweepers are undergoing technological transformations. GPS-based tracking, real-time performance monitoring, and hybrid or electric propulsion systems are becoming increasingly common. These advancements not only enhance operational efficiency but also enable cities to achieve their sustainability and emission-reduction targets.

Automation and smart fleet integration are becoming critical competitive advantages. Players who provide autonomous sweepers with remote diagnostics, predictive maintenance, and efficient scheduling systems have a distinct advantage. The incorporation of data analytics and IoT platforms into sweeper fleets boosts productivity while lowering long-term operating costs.

Key players in the street sweeper industry are Elgin Sweeper Company, Bucher Municipal, Aebi Schmidt Holding AG., Alamo Group Inc., Johnston Sweepers Limited, Dulevo S.p.A., Global Environmental Products, REV Group, Tenax International S.r.l., Tennant Company, TYMCO Inc., Hako GmbH, Schwarze Industries, Orient Industrial Co. Ltd. and other players.

Recent Development

  • In March 2025, Nilfisk introduced the CS7500 Combination Sweeper-Scrubber, an advanced industrial cleaning solution that redefines efficiency, user accessibility, and sustainability. The CS7500 is designed for maximum performance in various environments, featuring an intuitive touchscreen, multilingual support, and an ergonomic design that makes it easy to use.
  • In January 2025, Boschung announced the launch of the Urban-Sweeper S2.0 MAX, marking the company's latest advancement in fully electric urban maintenance vehicles. This is the third electric machine in Boschung's portfolio, demonstrating the company's commitment to sustainable and innovative urban maintenance solutions.

Segmentation of Street Sweeper Market

  • By Product :

    • Mechanical Broom Sweeper
    • Vacuum Sweeper
    • Regenerative Air Sweeper
  • By End-Use :

    • Municipal Corporation
    • Industrial
    • Others
  • By Propulsion :

    • Diesel
    • Electric
    • CNG/Gasoline
  • By Region :

    • North America
    • Latin America
    • Western Europe
    • Eastern Europe
    • East Asia
    • South Asia & Pacific
    • Middle East & Africa

Table of Content

  1. Executive Summary
    • Global Market Outlook
    • Demand-side Trends
    • Supply-side Trends
    • Technology Roadmap Analysis
    • Analysis and Recommendations
  2. Market Overview
    • Market Coverage / Taxonomy
    • Market Definition / Scope / Limitations
  3. Market Background
    • Market Dynamics
      • Drivers
      • Restraints
      • Opportunity
      • Trends
    • Scenario Forecast
      • Demand in Optimistic Scenario
      • Demand in Likely Scenario
      • Demand in Conservative Scenario
    • Opportunity Map Analysis
    • Product Life Cycle Analysis
    • Supply Chain Analysis
      • Supply Side Participants and their Roles
        • Producers
        • Mid-Level Participants (Traders/ Agents/ Brokers)
        • Wholesalers and Distributors
      • Value Added and Value Created at Node in the Supply Chain
      • List of Component Suppliers
      • List of Existing and Potential Buyers
    • Investment Feasibility Matrix
    • Value Chain Analysis
      • Profit Margin Analysis
      • Wholesalers and Distributors
      • Retailers
    • PESTLE and Porter’s Analysis
    • Regulatory Landscape
      • By Key Regions
      • By Key Countries
    • Production and Consumption Statistics
    • Import and Export Statistics
  4. Global Market Analysis 2020 to 2024 and Forecast, 2025 to 2035
    • Historical Market Size Value (USD Bn) & Volume (Units) Analysis, 2020 to 2024
    • Current and Future Market Size Value (USD Bn) & Volume (Units) Projections, 2025 to 2035
      • Y-o-Y Growth Trend Analysis
      • Absolute $ Opportunity Analysis
  5. Global Market Pricing Analysis 2020 to 2024 and Forecast 2025 to 2035
  6. Global Market Analysis 2020 to 2024 and Forecast 2025 to 2035, By Product
    • Introduction / Key Findings
    • Historical Market Size Value (USD Bn) & Volume (Units) Analysis By Product, 2020 to 2024
    • Current and Future Market Size Value (USD Bn) & Volume (Units) Analysis and Forecast By Product, 2025 to 2035
      • Mechanical Broom Sweeper
      • Vacuum Sweeper
      • Regenerative Air Sweeper
    • Y-o-Y Growth Trend Analysis By Product, 2020 to 2024
    • Absolute $ Opportunity Analysis By Product, 2025 to 2035
  7. Global Market Analysis 2020 to 2024 and Forecast 2025 to 2035, By End-Use
    • Introduction / Key Findings
    • Historical Market Size Value (USD Bn) & Volume (Units) Analysis By End-Use, 2020 to 2024
    • Current and Future Market Size Value (USD Bn) & Volume (Units) Analysis and Forecast By End-Use, 2025 to 2035
      • Municipal Corporation
      • Industrial
      • Others
    • Y-o-Y Growth Trend Analysis By End-Use, 2020 to 2024
    • Absolute $ Opportunity Analysis By End-Use, 2025 to 2035
  8. Global Market Analysis 2020 to 2024 and Forecast 2025 to 2035, By Propulsion
    • Introduction / Key Findings
    • Historical Market Size Value (USD Bn) & Volume (Units) Analysis By Propulsion, 2020 to 2024
    • Current and Future Market Size Value (USD Bn) & Volume (Units) Analysis and Forecast By Propulsion, 2025 to 2035
      • Diesel
      • Electric
      • CNG/Gasoline
    • Y-o-Y Growth Trend Analysis By Propulsion, 2020 to 2024
    • Absolute $ Opportunity Analysis By Propulsion, 2025 to 2035
  9. Global Market Analysis 2020 to 2024 and Forecast 2025 to 2035, By Region
    • Introduction
    • Historical Market Size Value (USD Bn) & Volume (Units) Analysis By Region, 2020 to 2024
    • Current Market Size Value (USD Bn) & Volume (Units) Analysis and Forecast By Region, 2025 to 2035
      • North America
      • Latin America
      • Western Europe
      • East Asia
      • South Asia Pacific
      • Eastern Europe
      • Middle East & Africa
    • Market Attractiveness Analysis By Region
  10. North America Market Analysis 2020 to 2024 and Forecast 2025 to 2035, By Country
    • Historical Market Size Value (USD Bn) & Volume (Units) Trend Analysis By Market Taxonomy, 2020 to 2024
    • Market Size Value (USD Bn) & Volume (Units) Forecast By Market Taxonomy, 2025 to 2035
      • By Country
        • U.S.
        • Canada
        • Mexico
      • By Product
      • By End-Use
      • By Propulsion
    • Market Attractiveness Analysis
      • By Country
      • By Product
      • By End-Use
      • By Propulsion
    • Key Takeaways
  11. Latin America Market Analysis 2020 to 2024 and Forecast 2025 to 2035, By Country
    • Historical Market Size Value (USD Bn) & Volume (Units) Trend Analysis By Market Taxonomy, 2020 to 2024
    • Market Size Value (USD Bn) & Volume (Units) Forecast By Market Taxonomy, 2025 to 2035
      • By Country
        • Brazil
        • Chile
        • Rest of Latin America
      • By Product
      • By End-Use
      • By Propulsion
    • Market Attractiveness Analysis
      • By Country
      • By Product
      • By End-Use
      • By Propulsion
    • Key Takeaways
  12. Western Europe Market Analysis 2020 to 2024 and Forecast 2025 to 2035, By Country
    • Historical Market Size Value (USD Bn) & Volume (Units) Trend Analysis By Market Taxonomy, 2020 to 2024
    • Market Size Value (USD Bn) & Volume (Units) Forecast By Market Taxonomy, 2025 to 2035
      • By Country
        • Germany
        • Italy
        • France
        • U.K.
        • Spain
        • Russia
        • BENELUX
        • Rest of Europe
      • By Product
      • By End-Use
      • By Propulsion
    • Market Attractiveness Analysis
      • By Country
      • By Product
      • By End-Use
      • By Propulsion
    • Key Takeaways
  13. East Asia Market Analysis 2020 to 2024 and Forecast 2025 to 2035, By Country
    • Historical Market Size Value (USD Bn) & Volume (Units) Trend Analysis By Market Taxonomy, 2020 to 2024
    • Market Size Value (USD Bn) & Volume (Units) Forecast By Market Taxonomy, 2025 to 2035
      • By Country
        • China
        • Japan
        • South Korea
      • By Product
      • By End-Use
      • By Propulsion
    • Market Attractiveness Analysis
      • By Country
      • By Product
      • By End-Use
      • By Propulsion
    • Key Takeaways
  14. South Asia Pacific Market Analysis 2020 to 2024 and Forecast 2025 to 2035, By Country
    • Historical Market Size Value (USD Bn) & Volume (Units) Trend Analysis By Market Taxonomy, 2020 to 2024
    • Market Size Value (USD Bn) & Volume (Units) Forecast By Market Taxonomy, 2025 to 2035
      • By Country
        • India
        • ASEAN Countries
        • Australia & New Zealand
        • Rest of South Asia Pacific
      • By Product
      • By End-Use
      • By Propulsion
    • Market Attractiveness Analysis
      • By Country
      • By Product
      • By End-Use
      • By Propulsion
    • Key Takeaways
  15. Eastern Europe Market Analysis 2020 to 2024 and Forecast 2025 to 2035, By Country
    • Historical Market Size Value (USD Bn) & Volume (Units) Trend Analysis By Market Taxonomy, 2020 to 2024
    • Market Size Value (USD Bn) & Volume (Units) Forecast By Market Taxonomy, 2025 to 2035
      • By Country
        • Russia
        • Poland
        • Hungary
        • Balkan & Baltics
        • Rest of Eastern Europe
      • By Product
      • By End-Use
      • By Propulsion
    • Market Attractiveness Analysis
      • By Country
      • By Product
      • By End-Use
      • By Propulsion
    • Key Takeaways
  16. Middle East & Africa Market Analysis 2020 to 2024 and Forecast 2025 to 2035, By Country
    • Historical Market Size Value (USD Bn) & Volume (Units) Trend Analysis By Market Taxonomy, 2020 to 2024
    • Market Size Value (USD Bn) & Volume (Units) Forecast By Market Taxonomy, 2025 to 2035
      • By Country
        • KSA
        • Other GCC Countries
        • Turkiye
        • South Africa
        • Rest of MEA
      • By Product
      • By End-Use
      • By Propulsion
    • Market Attractiveness Analysis
      • By Country
      • By Product
      • By End-Use
      • By Propulsion
    • Key Takeaways
  17. Key Countries Market Analysis
    • United States
      • Pricing Analysis
      • Market Share Analysis, 2024
        • By Product
        • By End-Use
        • By Propulsion
    • Germany
      • Pricing Analysis
      • Market Share Analysis, 2024
        • By Product
        • By End-Use
        • By Propulsion
    • China
      • Pricing Analysis
      • Market Share Analysis, 2024
        • By Product
        • By End-Use
        • By Propulsion
    • United Kingdom
      • Pricing Analysis
      • Market Share Analysis, 2024
        • By Product
        • By End-Use
        • By Propulsion
    • France
      • Pricing Analysis
      • Market Share Analysis, 2024
        • By Product
        • By End-Use
        • By Propulsion
  18. Market Structure Analysis
    • Competition Dashboard
    • Competition Benchmarking
    • Market Share Analysis of Top Players
      • By Regional
      • By Product
      • By End-Use
      • By Propulsion
  19. Competition Analysis
    • Competition Deep Dive
      • Elgin Sweeper Company
        • Overview
        • Product Portfolio
        • Profitability by Market Segments (Product/Age /Sales Channel/Region)
        • Sales Footprint
        • Strategy Overview
          • Marketing Strategy
          • Product Strategy
          • Channel Strategy
      • Bucher Municipal
        • Overview
        • Product Portfolio
        • Profitability by Market Segments (Product/Age /Sales Channel/Region)
        • Sales Footprint
        • Strategy Overview
          • Marketing Strategy
          • Product Strategy
          • Channel Strategy
      • Aebi Schmidt Holding AG
        • Overview
        • Product Portfolio
        • Profitability by Market Segments (Product/Age /Sales Channel/Region)
        • Sales Footprint
        • Strategy Overview
          • Marketing Strategy
          • Product Strategy
          • Channel Strategy
      • Alamo Group Inc.
        • Overview
        • Product Portfolio
        • Profitability by Market Segments (Product/Age /Sales Channel/Region)
        • Sales Footprint
        • Strategy Overview
          • Marketing Strategy
          • Product Strategy
          • Channel Strategy
      • Johnston Sweepers Limited
        • Overview
        • Product Portfolio
        • Profitability by Market Segments (Product/Age /Sales Channel/Region)
        • Sales Footprint
        • Strategy Overview
          • Marketing Strategy
          • Product Strategy
          • Channel Strategy
      • Dulevo S.p.A.
        • Overview
        • Product Portfolio
        • Profitability by Market Segments (Product/Age /Sales Channel/Region)
        • Sales Footprint
        • Strategy Overview
          • Marketing Strategy
          • Product Strategy
          • Channel Strategy
      • Global Environmental Products
        • Overview
        • Product Portfolio
        • Profitability by Market Segments (Product/Age /Sales Channel/Region)
        • Sales Footprint
        • Strategy Overview
          • Marketing Strategy
          • Product Strategy
          • Channel Strategy
      • REV Group
        • Overview
        • Product Portfolio
        • Profitability by Market Segments (Product/Age /Sales Channel/Region)
        • Sales Footprint
        • Strategy Overview
          • Marketing Strategy
          • Product Strategy
          • Channel Strategy
      • Tenax International S.r.l.
        • Overview
        • Product Portfolio
        • Profitability by Market Segments (Product/Age /Sales Channel/Region)
        • Sales Footprint
        • Strategy Overview
          • Marketing Strategy
          • Product Strategy
          • Channel Strategy
      • Tennant Company
        • Overview
        • Product Portfolio
        • Profitability by Market Segments (Product/Age /Sales Channel/Region)
        • Sales Footprint
        • Strategy Overview
          • Marketing Strategy
          • Product Strategy
          • Channel Strategy
      • TYMCO Inc.
        • Overview
        • Product Portfolio
        • Profitability by Market Segments (Product/Age /Sales Channel/Region)
        • Sales Footprint
        • Strategy Overview
          • Marketing Strategy
          • Product Strategy
          • Channel Strategy
      • Hako GmbH
        • Overview
        • Product Portfolio
        • Profitability by Market Segments (Product/Age /Sales Channel/Region)
        • Sales Footprint
        • Strategy Overview
          • Marketing Strategy
          • Product Strategy
          • Channel Strategy
      • Schwarze Industries
        • Overview
        • Product Portfolio
        • Profitability by Market Segments (Product/Age /Sales Channel/Region)
        • Sales Footprint
        • Strategy Overview
          • Marketing Strategy
          • Product Strategy
          • Channel Strategy
      • Orient Industrial Co. Ltd.
        • Overview
        • Product Portfolio
        • Profitability by Market Segments (Product/Age /Sales Channel/Region)
        • Sales Footprint
        • Strategy Overview
          • Marketing Strategy
          • Product Strategy
          • Channel Strategy
  20. Assumptions & Acronyms Used
  21. Research Methodology

List Of Table

  • Table 1: Global Market Value (USD Bn) Forecast by Region, 2020 to 2035
  • Table 2: Global Market Volume (Units) Forecast by Region, 2020 to 2035
  • Table 3: Global Market Value (USD Bn) Forecast by Product, 2020 to 2035
  • Table 4: Global Market Volume (Units) Forecast by Product, 2020 to 2035
  • Table 5: Global Market Value (USD Bn) Forecast by End-Use, 2020 to 2035
  • Table 6: Global Market Volume (Units) Forecast by End-Use, 2020 to 2035
  • Table 7: Global Market Value (USD Bn) Forecast by Propulsion, 2020 to 2035
  • Table 8: Global Market Volume (Units) Forecast by Propulsion, 2020 to 2035
  • Table 9: North America Market Value (USD Bn) Forecast by Country, 2020 to 2035
  • Table 10: North America Market Volume (Units) Forecast by Country, 2020 to 2035
  • Table 11: North America Market Value (USD Bn) Forecast by Product, 2020 to 2035
  • Table 12: North America Market Volume (Units) Forecast by Product, 2020 to 2035
  • Table 13: North America Market Value (USD Bn) Forecast by End-Use, 2020 to 2035
  • Table 14: North America Market Volume (Units) Forecast by End-Use, 2020 to 2035
  • Table 15: North America Market Value (USD Bn) Forecast by Propulsion, 2020 to 2035
  • Table 16: North America Market Volume (Units) Forecast by Propulsion, 2020 to 2035
  • Table 17: Latin America Market Value (USD Bn) Forecast by Country, 2020 to 2035
  • Table 18: Latin America Market Volume (Units) Forecast by Country, 2020 to 2035
  • Table 19: Latin America Market Value (USD Bn) Forecast by Product, 2020 to 2035
  • Table 20: Latin America Market Volume (Units) Forecast by Product, 2020 to 2035
  • Table 21: Latin America Market Value (USD Bn) Forecast by End-Use, 2020 to 2035
  • Table 22: Latin America Market Volume (Units) Forecast by End-Use, 2020 to 2035
  • Table 23: Latin America Market Value (USD Bn) Forecast by Propulsion, 2020 to 2035
  • Table 24: Latin America Market Volume (Units) Forecast by Propulsion, 2020 to 2035
  • Table 25: Western Europe Market Value (USD Bn) Forecast by Country, 2020 to 2035
  • Table 26: Western Europe Market Volume (Units) Forecast by Country, 2020 to 2035
  • Table 27: Western Europe Market Value (USD Bn) Forecast by Product, 2020 to 2035
  • Table 28: Western Europe Market Volume (Units) Forecast by Product, 2020 to 2035
  • Table 29: Western Europe Market Value (USD Bn) Forecast by End-Use, 2020 to 2035
  • Table 30: Western Europe Market Volume (Units) Forecast by End-Use, 2020 to 2035
  • Table 31: Western Europe Market Value (USD Bn) Forecast by Propulsion, 2020 to 2035
  • Table 32: Western Europe Market Volume (Units) Forecast by Propulsion, 2020 to 2035
  • Table 33: East Asia Market Value (USD Bn) Forecast by Country, 2020 to 2035
  • Table 34: East Asia Market Volume (Units) Forecast by Country, 2020 to 2035
  • Table 35: East Asia Market Value (USD Bn) Forecast by Product, 2020 to 2035
  • Table 36: East Asia Market Volume (Units) Forecast by Product, 2020 to 2035
  • Table 37: East Asia Market Value (USD Bn) Forecast by End-Use, 2020 to 2035
  • Table 38: East Asia Market Volume (Units) Forecast by End-Use, 2020 to 2035
  • Table 39: East Asia Market Value (USD Bn) Forecast by Propulsion, 2020 to 2035
  • Table 40: East Asia Market Volume (Units) Forecast by Propulsion, 2020 to 2035
  • Table 41: South Asia Pacific Market Value (USD Bn) Forecast by Country, 2020 to 2035
  • Table 42: South Asia Pacific Market Volume (Units) Forecast by Country, 2020 to 2035
  • Table 43: South Asia Pacific Market Value (USD Bn) Forecast by Product, 2020 to 2035
  • Table 44: South Asia Pacific Market Volume (Units) Forecast by Product, 2020 to 2035
  • Table 45: South Asia Pacific Market Value (USD Bn) Forecast by End-Use, 2020 to 2035
  • Table 46: South Asia Pacific Market Volume (Units) Forecast by End-Use, 2020 to 2035
  • Table 47: South Asia Pacific Market Value (USD Bn) Forecast by Propulsion, 2020 to 2035
  • Table 48: South Asia Pacific Market Volume (Units) Forecast by Propulsion, 2020 to 2035
  • Table 49: Eastern Europe Market Value (USD Bn) Forecast by Country, 2020 to 2035
  • Table 50: Eastern Europe Market Volume (Units) Forecast by Country, 2020 to 2035
  • Table 51: Eastern Europe Market Value (USD Bn) Forecast by Product, 2020 to 2035
  • Table 52: Eastern Europe Market Volume (Units) Forecast by Product, 2020 to 2035
  • Table 53: Eastern Europe Market Value (USD Bn) Forecast by End-Use, 2020 to 2035
  • Table 54: Eastern Europe Market Volume (Units) Forecast by End-Use, 2020 to 2035
  • Table 55: Eastern Europe Market Value (USD Bn) Forecast by Propulsion, 2020 to 2035
  • Table 56: Eastern Europe Market Volume (Units) Forecast by Propulsion, 2020 to 2035
  • Table 57: Middle East & Africa Market Value (USD Bn) Forecast by Country, 2020 to 2035
  • Table 58: Middle East & Africa Market Volume (Units) Forecast by Country, 2020 to 2035
  • Table 59: Middle East & Africa Market Value (USD Bn) Forecast by Product, 2020 to 2035
  • Table 60: Middle East & Africa Market Volume (Units) Forecast by Product, 2020 to 2035
  • Table 61: Middle East & Africa Market Value (USD Bn) Forecast by End-Use, 2020 to 2035
  • Table 62: Middle East & Africa Market Volume (Units) Forecast by End-Use, 2020 to 2035
  • Table 63: Middle East & Africa Market Value (USD Bn) Forecast by Propulsion, 2020 to 2035
  • Table 64: Middle East & Africa Market Volume (Units) Forecast by Propulsion, 2020 to 2035

List Of Figures

  • Figure 1: Global Market Volume (Units) Forecast 2020 to 2035
  • Figure 2: Global Market Pricing Analysis
  • Figure 3: Global Market Value (USD Bn) Forecast 2020 to 2035
  • Figure 4: Global Market Value Share and BPS Analysis by Product, 2025 and 2035
  • Figure 5: Global Market Y-o-Y Growth Comparison by Product, 2025 to 2035
  • Figure 6: Global Market Attractiveness Analysis by Product
  • Figure 7: Global Market Value Share and BPS Analysis by End-Use, 2025 and 2035
  • Figure 8: Global Market Y-o-Y Growth Comparison by End-Use, 2025 to 2035
  • Figure 9: Global Market Attractiveness Analysis by End-Use
  • Figure 10: Global Market Value Share and BPS Analysis by Propulsion, 2025 and 2035
  • Figure 11: Global Market Y-o-Y Growth Comparison by Propulsion, 2025 to 2035
  • Figure 12: Global Market Attractiveness Analysis by Propulsion
  • Figure 13: Global Market Value (USD Bn) Share and BPS Analysis by Region, 2025 and 2035
  • Figure 14: Global Market Y-o-Y Growth Comparison by Region, 2025 to 2035
  • Figure 15: Global Market Attractiveness Analysis by Region
  • Figure 16: North America Market Incremental $ Opportunity, 2025 to 2035
  • Figure 17: Latin America Market Incremental $ Opportunity, 2025 to 2035
  • Figure 18: Western Europe Market Incremental $ Opportunity, 2025 to 2035
  • Figure 19: East Asia Market Incremental $ Opportunity, 2025 to 2035
  • Figure 20: South Asia Pacific Market Incremental $ Opportunity, 2025 to 2035
  • Figure 21: Eastern Europe Market Incremental $ Opportunity, 2025 to 2035
  • Figure 22: Middle East & Africa Market Incremental $ Opportunity, 2025 to 2035
  • Figure 23: North America Market Value Share and BPS Analysis by Country, 2025 and 2035
  • Figure 24: North America Market Value Share and BPS Analysis by Product, 2025 and 2035
  • Figure 25: North America Market Y-o-Y Growth Comparison by Product, 2025 to 2035
  • Figure 26: North America Market Attractiveness Analysis by Product
  • Figure 27: North America Market Value Share and BPS Analysis by End-Use, 2025 and 2035
  • Figure 28: North America Market Y-o-Y Growth Comparison by End-Use, 2025 to 2035
  • Figure 29: North America Market Attractiveness Analysis by End-Use
  • Figure 30: North America Market Value Share and BPS Analysis by Propulsion, 2025 and 2035
  • Figure 31: North America Market Y-o-Y Growth Comparison by Propulsion, 2025 to 2035
  • Figure 32: North America Market Attractiveness Analysis by Propulsion
  • Figure 33: Latin America Market Value Share and BPS Analysis by Country, 2025 and 2035
  • Figure 34: Latin America Market Value Share and BPS Analysis by Product, 2025 and 2035
  • Figure 35: Latin America Market Y-o-Y Growth Comparison by Product, 2025 to 2035
  • Figure 36: Latin America Market Attractiveness Analysis by Product
  • Figure 37: Latin America Market Value Share and BPS Analysis by End-Use, 2025 and 2035
  • Figure 38: Latin America Market Y-o-Y Growth Comparison by End-Use, 2025 to 2035
  • Figure 39: Latin America Market Attractiveness Analysis by End-Use
  • Figure 40: Latin America Market Value Share and BPS Analysis by Propulsion, 2025 and 2035
  • Figure 41: Latin America Market Y-o-Y Growth Comparison by Propulsion, 2025 to 2035
  • Figure 42: Latin America Market Attractiveness Analysis by Propulsion
  • Figure 43: Western Europe Market Value Share and BPS Analysis by Country, 2025 and 2035
  • Figure 44: Western Europe Market Value Share and BPS Analysis by Product, 2025 and 2035
  • Figure 45: Western Europe Market Y-o-Y Growth Comparison by Product, 2025 to 2035
  • Figure 46: Western Europe Market Attractiveness Analysis by Product
  • Figure 47: Western Europe Market Value Share and BPS Analysis by End-Use, 2025 and 2035
  • Figure 48: Western Europe Market Y-o-Y Growth Comparison by End-Use, 2025 to 2035
  • Figure 49: Western Europe Market Attractiveness Analysis by End-Use
  • Figure 50: Western Europe Market Value Share and BPS Analysis by Propulsion, 2025 and 2035
  • Figure 51: Western Europe Market Y-o-Y Growth Comparison by Propulsion, 2025 to 2035
  • Figure 52: Western Europe Market Attractiveness Analysis by Propulsion
  • Figure 53: East Asia Market Value Share and BPS Analysis by Country, 2025 and 2035
  • Figure 54: East Asia Market Value Share and BPS Analysis by Product, 2025 and 2035
  • Figure 55: East Asia Market Y-o-Y Growth Comparison by Product, 2025 to 2035
  • Figure 56: East Asia Market Attractiveness Analysis by Product
  • Figure 57: East Asia Market Value Share and BPS Analysis by End-Use, 2025 and 2035
  • Figure 58: East Asia Market Y-o-Y Growth Comparison by End-Use, 2025 to 2035
  • Figure 59: East Asia Market Attractiveness Analysis by End-Use
  • Figure 60: East Asia Market Value Share and BPS Analysis by Propulsion, 2025 and 2035
  • Figure 61: East Asia Market Y-o-Y Growth Comparison by Propulsion, 2025 to 2035
  • Figure 62: East Asia Market Attractiveness Analysis by Propulsion
  • Figure 63: South Asia Pacific Market Value Share and BPS Analysis by Country, 2025 and 2035
  • Figure 64: South Asia Pacific Market Value Share and BPS Analysis by Product, 2025 and 2035
  • Figure 65: South Asia Pacific Market Y-o-Y Growth Comparison by Product, 2025 to 2035
  • Figure 66: South Asia Pacific Market Attractiveness Analysis by Product
  • Figure 67: South Asia Pacific Market Value Share and BPS Analysis by End-Use, 2025 and 2035
  • Figure 68: South Asia Pacific Market Y-o-Y Growth Comparison by End-Use, 2025 to 2035
  • Figure 69: South Asia Pacific Market Attractiveness Analysis by End-Use
  • Figure 70: South Asia Pacific Market Value Share and BPS Analysis by Propulsion, 2025 and 2035
  • Figure 71: South Asia Pacific Market Y-o-Y Growth Comparison by Propulsion, 2025 to 2035
  • Figure 72: South Asia Pacific Market Attractiveness Analysis by Propulsion
  • Figure 73: Eastern Europe Market Value Share and BPS Analysis by Country, 2025 and 2035
  • Figure 74: Eastern Europe Market Value Share and BPS Analysis by Product, 2025 and 2035
  • Figure 75: Eastern Europe Market Y-o-Y Growth Comparison by Product, 2025 to 2035
  • Figure 76: Eastern Europe Market Attractiveness Analysis by Product
  • Figure 77: Eastern Europe Market Value Share and BPS Analysis by End-Use, 2025 and 2035
  • Figure 78: Eastern Europe Market Y-o-Y Growth Comparison by End-Use, 2025 to 2035
  • Figure 79: Eastern Europe Market Attractiveness Analysis by End-Use
  • Figure 80: Eastern Europe Market Value Share and BPS Analysis by Propulsion, 2025 and 2035
  • Figure 81: Eastern Europe Market Y-o-Y Growth Comparison by Propulsion, 2025 to 2035
  • Figure 82: Eastern Europe Market Attractiveness Analysis by Propulsion
  • Figure 83: Middle East & Africa Market Value Share and BPS Analysis by Country, 2025 and 2035
  • Figure 84: Middle East & Africa Market Value Share and BPS Analysis by Product, 2025 and 2035
  • Figure 85: Middle East & Africa Market Y-o-Y Growth Comparison by Product, 2025 to 2035
  • Figure 86: Middle East & Africa Market Attractiveness Analysis by Product
  • Figure 87: Middle East & Africa Market Value Share and BPS Analysis by End-Use, 2025 and 2035
  • Figure 88: Middle East & Africa Market Y-o-Y Growth Comparison by End-Use, 2025 to 2035
  • Figure 89: Middle East & Africa Market Attractiveness Analysis by End-Use
  • Figure 90: Middle East & Africa Market Value Share and BPS Analysis by Propulsion, 2025 and 2035
  • Figure 91: Middle East & Africa Market Y-o-Y Growth Comparison by Propulsion, 2025 to 2035
  • Figure 92: Middle East & Africa Market Attractiveness Analysis by Propulsion
  • Figure 93: Global Market - Tier Structure Analysis
  • Figure 94: Global Market - Company Share Analysis

- FAQs -

What is the global street sweeper market size in 2025?

The street sweeper market is projected to be valued at USD 2.2 billion by 2025.

Who are the major players operating in the street sweeper market?

Prominent players in the market include Johnston Sweepers Limited, Dulevo S.p.A., Global Environmental Products, REV Group, and Tenax International S.r.l.

What is the estimated valuation of the street sweeper market by 2035?

The market is expected to reach a valuation of USD 3.4 billion by 2035.

What value CAGR is the street sweeper market exhibit over the last five years?

The historic growth rate of the street sweeper market was 3.8% from 2020 to 2024.

Street Sweeper Market

Schedule a Call