Slip Ring Market

Slip Ring Market Analysis, By Product, By End-Use, and Region - Market Insights 2025 to 2035

Analysis Of Slip Ring Market Covering 30+ Countries Including Analysis Of US, Canada, UK, Germany, France, Nordics, GCC Countries, Japan, Korea And Many More

Slip Ring Market Outlook (2025 to 2035)

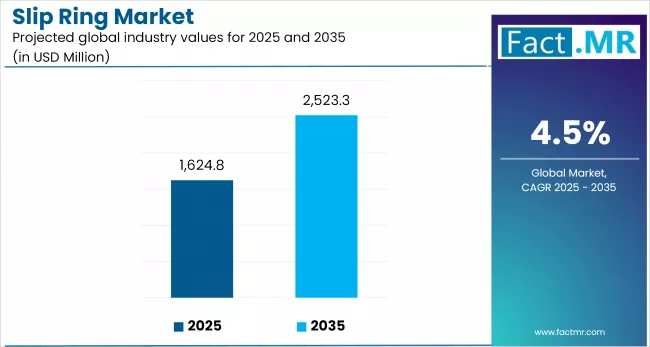
The global slip ring market is projected to increase from USD 1,624.8 million in 2025 to USD 2,523.3 million by 2035, with a CAGR of 4.5%, driven by increased use in automation, wind turbines, and high-speed rotating systems. Demand is rising across robotics, aerospace, and medical devices, supported by Industry 4.0 trends and renewable energy expansion.

Slip Ring Market

What are the Drivers of the Slip Ring Market?

A convergence of technological, industrial, and energy-related developments is driving the growth of the slip ring market. A major growth driver is the rapid adoption of industrial automation across various sectors, including manufacturing, packaging, and robotics, where slip rings play a crucial role in enabling continuous power and signal transmission in rotating equipment. As factories move toward fully automated systems under Industry 4.0, the need for reliable rotary connections has intensified.

Another critical factor is the global expansion of wind energy. Slip rings are essential components in wind turbines, facilitating communication and power transfer between the stationary nacelle and the rotating blades. With countries such as China, Germany, and the U.S. ramping up their renewable energy capacity, demand for high-durability slip rings in both onshore and offshore wind farms is increasing.

Medical equipment, especially advanced imaging systems such as CT and MRI scanners, also contributes to market growth. These devices require high-performance slip rings to ensure precise data transmission during rotational motion.

Additionally, increased investment in defense and aerospace technologies is driving demand for rugged slip ring designs used in radar systems, turrets, and satellite tracking equipment. The trend toward non-contact, fiber-optic, and hybrid slip rings is gaining traction, as industries seek longer service life, reduced maintenance, and high-speed data handling.

What are the Regional Trends of the Slip Ring Market?

The slip ring market displays distinct regional dynamics, shaped by differences in industrial maturity, energy infrastructure, and investment in automation technologies.

The Asia-Pacific region leads the global market, driven by rapid industrialization, the expansion of manufacturing hubs, and strong investment in wind energy projects in China and India. China's dominance in the wind power sector and its growing focus on smart factory development have significantly increased demand for high-performance slip rings across both energy and industrial applications. In Japan and South Korea, advanced robotics, semiconductor production, and precision medical devices shape demand.

Europe follows closely, supported by its leadership in renewable energy adoption, particularly in offshore wind installations in countries such as Germany, the UK, and Denmark. The region’s aerospace and defense industries also make notable contributions, requiring advanced slip ring assemblies for radar, satellite systems, and surveillance equipment. The European Union’s push for decarbonization and automation is further accelerating the uptake of smart slip ring technologies.

In North America, the U.S. is seeing stable growth, backed by a well-established aerospace and defense sector, ongoing modernization of industrial automation systems, and investment in grid-scale wind farms. The U.S. also leads in medical imaging equipment development, supporting demand for slip rings in high-precision CT and MRI systems.

The Middle East & Africa are witnessing gradual adoption, primarily through oil & gas operations and emerging infrastructure projects that require rugged, explosion-proof slip ring assemblies. Meanwhile, Latin America is experiencing increased demand in packaging, food processing, and energy as industrial activity expands.

What are the Challenges and Restraining Factors of the Slip Ring Market?

Despite steady demand across industries, the slip ring market faces challenges that may limit its growth trajectory. One of the key issues is the maintenance-intensive nature of traditional slip ring designs. Mechanical wear from continuous rotation often leads to brush and contact degradation, increasing the need for periodic servicing, downtime, and replacement in high-speed or harsh environments. This can deter adoption in industries that demand long operational life and minimal interruption.

Another significant restraint is the rising preference for non-contact alternatives, such as wireless power transmission, rotary transformers, and fiber-optic rotary joints. These technologies offer lower maintenance and longer lifespans, particularly in sensitive applications such as medical imaging and aerospace, where system reliability is crucial. Consequently, they are increasingly considered viable alternatives to conventional slip rings in certain high-performance settings.

Heat generation and signal noise are additional concerns in high-speed or high-current applications. Excessive heat can impact performance and reduce operational life, while electrical noise may compromise data integrity in digital signal transmission.

Cost remains a significant consideration. While basic slip rings are relatively affordable, high-end, custom-engineered solutions with multi-channel, hybrid, or fiber-optic features can be costly, limiting accessibility for small- and mid-sized enterprises.

Country-Wise Outlook

U.S. Slip Ring Market Sees Expansion in Automation, Wind Energy, and Aerospace Applications

Slip Ring Market By Company

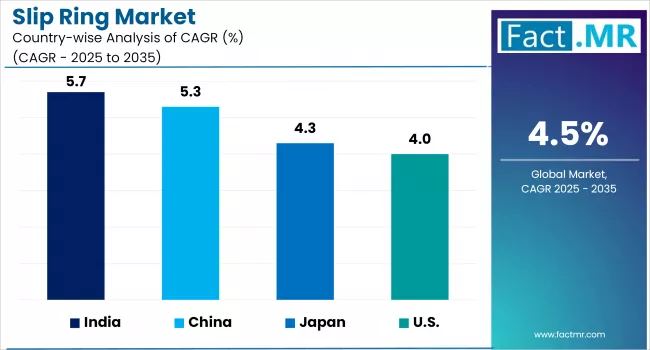
The U.S. slip ring market is expanding, driven by growth in the industrial automation, renewable energy, aerospace, and defense sectors. Industry 4.0 trends fuel demand for slip rings in robots and manufacturing machinery, where these components enable seamless power and signal transfer during continuous rotation.

The wind energy sector is another key driver, with slip rings playing a critical role in turbine hub-to-nacelle communication systems, reflecting the United States' increasing commitment to clean energy deployment.

Aerospace and defense applications also contribute, as radar systems, satellite-communication platforms, and guided weapons require ruggedized slip rings built for reliability in harsh conditions. Moreover, the booming medical imaging industry, CT and MRI systems, continues to depend on precision slip rings for consistent, high-speed data transmission.

USA Slip Ring Market Value (usd Billion) 2025 To 2035

China Strengthens Slip Ring Market Through Renewable Energy and Automation Push

China’s slip ring market is experiencing momentum, driven by its dominant role in the global wind energy sector and a rapid shift toward industrial automation. As a global leader in wind turbine deployment, China relies on slip rings to enable critical functions such as pitch control and signal transmission between moving turbine components. This demand is further amplified by the country’s aggressive renewable energy targets and expanding offshore wind installations.

In parallel, automation in sectors such as robotics, electronics, and CNC machining, especially in manufacturing hubs like Guangdong, Jiangsu, and Zhejiang, is pushing the adoption of compact, high-performance slip rings. The rise of smart factories and precision assembly lines has further cemented the role of slip rings in enabling seamless power and data transfer in rotational equipment.

China also plays a dual role as a leading producer and exporter of slip ring components, due to its cost-effective manufacturing, supportive policies, and a robust domestic supply chain. This combination of renewable energy development, automation investment, and manufacturing capacity positions China as a key driver in shaping the future of the global slip ring market.

Japan Embraces Advanced Slip Ring Technology Amid Automation and Renewable Energy Expansion

The Japan’s slip ring market is gaining traction, propelled by the country’s leading role in robotics, precision manufacturing, and renewable energy. As automation intensifies within automotive, semiconductor, and industrial sectors, high-performance slip rings are becoming essential for ensuring continuous electrical and signal transmission in rotating machinery.

The growing use of wind turbines and other clean energy installations is boosting demand for robust, low-maintenance slip rings that ensure reliable pitch control and data flow in harsh environments. Innovation in material science and miniaturization is enabling compact, durable designs suitable for both industrial and medical applications, such as robotic arms and imaging devices.

Japan's slip ring ecosystem benefits from a strong manufacturing base, supported by government investment in smart factories and Industry 4.0 initiatives. These efforts are reinforcing the adoption of contactless and fiber-optic slip ring solutions, designed to reduce maintenance needs and improve longevity. The country’s focus on precision, reliability, and cleanliness continues to underscore its central role in advancing slip ring technology.

Category-wise Analysis

Pancake to Exhibit Leading by Product

Slip Ring Market By Product

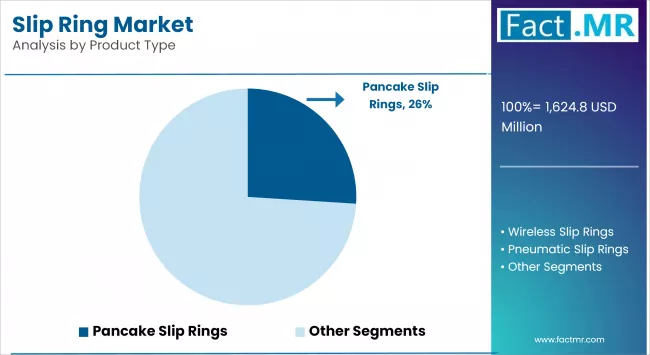
Pancake slip rings are gaining prominence as the preferred product type in applications where vertical space is limited and rotational motion is essential. Their flat, disc-like structure makes them ideal for integration into systems requiring minimal axial height, such as robotics, medical diagnostics, radar antennas, and automated machinery.

The demand is strong in industries such as semiconductor manufacturing, defense, and advanced imaging, where equipment designs prioritize compactness without compromising performance. These slip rings also support high-speed data and power transmission across multiple channels, which makes them highly suitable for precision operations in rotating platforms, turntables, and rotary sensors.

In robotics and automation, pancake slip rings are increasingly used in articulated joints and end-effectors, allowing for uninterrupted signal flow even during continuous movement. Their lightweight and space-efficient profile aligns well with the ongoing miniaturization of industrial equipment and the adoption of collaborative robots (cobots).

Additionally, ongoing innovations in material durability, noise reduction, and wear resistance are improving the lifespan and reliability of pancake slip rings, further solidifying their position as the leading choice in space-constrained, high-performance applications.

Others (Factory Automation, Wind, Medical, etc.) to Exhibit Leading by End-Use

Slip Ring Market End‑use Industry

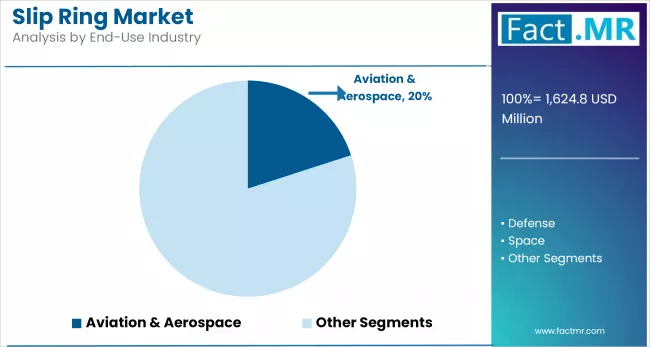
Slip rings are experiencing their highest uptake across a broad range of end-use industries, extending beyond the traditional telecom and aerospace sectors. Applications in factory automation, wind energy, medical imaging, and packaging machinery are increasingly dominating market share, driven by rising demand for uninterrupted signal and power transfer in rotating systems.

In industrial automation, slip rings are essential for robotic arms, rotary tables, and CNC machines, enabling smooth operations across high-speed, multi-axis environments. The surge in smart manufacturing and the integration of IoT in production lines has only strengthened their relevance in maintaining operational continuity.

The wind energy sector also contributes significantly to market demand, with the expansion of offshore wind farms. Slip rings are critical to turbine functionality, ensuring real-time communication and electrical transfer between the rotating blades and control systems housed in the nacelle.

In the medical field, slip rings power advanced diagnostic equipment such as CT and MRI scanners, where high-speed rotation and data accuracy are non-negotiable. Similarly, sectors such as defense, semiconductor fabrication, and renewable energy infrastructure rely on compact, low-maintenance slip ring assemblies to support increasingly sophisticated systems.

Competitive Analysis

The slip ring market is becoming increasingly competitive, with globally recognized manufacturers each focusing on advancing product performance, reliability, and customization to meet industry-specific demands. Key players, including Cobham Limited, Combinent Oy, Mersen Property, Moflon Technology, Moog Inc., and Pandect Precision Components Ltd., are investing in R&D, precision engineering, and international partnerships to gain market share.

Cobham Limited continues to innovate in aerospace-grade slip rings, supplying highly reliable rotary solutions for radar systems and satellite communication. Moog Inc., a leader in motion control technology, offers high-performance slip ring assemblies designed for medical imaging, defense, and wind turbine applications, often integrating fiber optics and fluid rotary unions for multifunctional capabilities.

Moflon Technology is expanding its global reach with customizable slip rings tailored for industrial automation, surveillance systems, and robotics. Pandect Precision Components Ltd. focuses on compact, low-noise solutions ideal for medical and semiconductor applications, aligning with miniaturization trends.

Combinent Oy and MERSEN Property contribute specialized slip ring technologies for harsh environments, including mining, marine, and renewable energy sectors, offering rugged designs with extended operational lifespans.

As demand grows for smart manufacturing and renewable energy integration, these companies are differentiating through enhanced signal quality, low-maintenance designs, and advanced sealing technologies. The market remains competitive as innovation, application-specific engineering, and geographic expansion continue to define strategic positioning.

Recent Development

  • In 2025, Moog Inc. was awarded a $28 million contract by the U.S. Navy to repair slip ring assemblies on the V-22 Osprey tiltrotor aircraft. The contract is a three-year agreement with all work to be performed in Blacksburg, Virginia. It is part of Moog’s ongoing support for the V-22 program, reinforcing the aircraft’s operational readiness and safety for military missions.
  • In 2024, Moog Inc. introduced a next-generation slip ring integrated with a fiber-optic rotary joint (FORJ) for GE wind turbines, specifically targeting 2.5 MW and larger models. This innovation replaces traditional carbon-brush slip rings, which are prone to generating dust, causing communication disruptions, and requiring frequent maintenance.

Segmentation of the Slip Ring Market

  • By Product :

    • Wireless Slip Rings
    • Pancake Slip Rings
    • Pneumatic Slip Rings
    • Miniature Slip Rings
    • Capsule Slip Rings
    • Molded Slip Rings
    • Others (Hybrid Slip Rings, etc.)
  • By End-Use :

    • Aviation & Aerospace
    • Defense
    • Space
    • Others (Factory Automation, etc.)
  • By Region :

    • North America
    • Latin America
    • Europe
    • Asia Pacific
    • Middle East & Africa (MEA)

Table of Content

  1. Executive Summary
    • Global Market Outlook
    • Demand-side Trends
    • Supply-side Trends
    • Technology Roadmap Analysis
    • Analysis and Recommendations
  2. Market Overview
    • Market Coverage / Taxonomy
    • Market Definition / Scope / Limitations
  3. Market Background
    • Market Dynamics
      • Drivers
      • Restraints
      • Opportunity
      • Trends
    • Scenario Forecast
      • Demand in Optimistic Scenario
      • Demand in Likely Scenario
      • Demand in Conservative Scenario
    • Opportunity Map Analysis
    • Product Life Cycle Analysis
    • Supply Chain Analysis
      • Supply Side Participants and their Roles
        • Producers
        • Mid-Level Participants (Traders/ Agents/ Brokers)
        • Wholesalers and Distributors
      • Value Added and Value Created at Node in the Supply Chain
      • List of Raw Material Suppliers
      • List of Existing and Potential Buyers
    • Investment Feasibility Matrix
    • Value Chain Analysis
      • Profit Margin Analysis
      • Wholesalers and Distributors
    • PESTLE and Porter’s Analysis
    • Regulatory Landscape
      • By Key Regions
      • By Key Countries
    • Production and Consumption Statistics
    • Import and Export Statistics
  4. Global Market Analysis 2020-2024 and Forecast, 2025-2035
    • Historical Market Size Value (US$ Bn) & Volume (Units) Analysis, 2020-2024
    • Current and Future Market Size Value (US$ Bn) & Volume (Units) Projections, 2025-2035
      • Y-o-Y Growth Trend Analysis
      • Absolute $ Opportunity Analysis
  5. Global Market Pricing Analysis 2020-2024 and Forecast 2025-2035
  6. Global Market Analysis 2020-2024 and Forecast 2025-2035, By Product
    • Introduction / Key Findings
    • Historical Market Size Value (US$ Bn) & Volume (Units) Analysis By Product, 2020-2024
    • Current and Future Market Size Value (US$ Bn) & Volume (Units) Analysis and Forecast By Product, 2025-2035
      • Wireless
      • Pancake
      • Pneumatic
      • Miniature
      • Capsule
      • Molded
      • Others
    • Y-o-Y Growth Trend Analysis By Product, 2020-2024
    • Absolute $ Opportunity Analysis By Product, 2025-2035
  7. Global Market Analysis 2020-2024 and Forecast 2025-2035, By End User
    • Introduction / Key Findings
    • Historical Market Size Value (US$ Bn) & Volume (Units) Analysis By End User, 2020-2024
    • Current and Future Market Size Value (US$ Bn) & Volume (Units) Analysis and Forecast By End User, 2025-2035
      • Aviation & Aerospace
      • Defense
      • Space
      • Others
    • Y-o-Y Growth Trend Analysis By End User, 2020-2024
    • Absolute $ Opportunity Analysis By End User, 2025-2035
  8. Global Market Analysis 2020-2024 and Forecast 2025-2035, By Region
    • Introduction
    • Historical Market Size Value (US$ Bn) & Volume (Units) Analysis By Region, 2020-2024
    • Current Market Size Value (US$ Bn) & Volume (Units) Analysis and Forecast By Region, 2025-2035
      • North America
      • Latin America
      • Europe
      • East Asia
      • South Asia
      • Oceania
      • MEA
    • Market Attractiveness Analysis By Region
  9. North America Market Analysis 2020-2024 and Forecast 2025-2035, By Country
    • Historical Market Size Value (US$ Bn) & Volume (Units) Trend Analysis By Market Taxonomy, 2020-2024
    • Market Size Value (US$ Bn) & Volume (Units) Forecast By Market Taxonomy, 2025-2035
      • By Country
        • U.S.
        • Canada
      • By Product
      • By End User
    • Market Attractiveness Analysis
      • By Country
      • By Product
      • By End User
    • Key Takeaways
  10. Latin America Market Analysis 2020-2024 and Forecast 2025-2035, By Country
    • Historical Market Size Value (US$ Bn) & Volume (Units) Trend Analysis By Market Taxonomy, 2020-2024
    • Market Size Value (US$ Bn) & Volume (Units) Forecast By Market Taxonomy, 2025-2035
      • By Country
        • Brazil
        • Mexico
        • Argentina
        • Chile
        • Peru
        • Rest of Latin America
      • By Product
      • By End User
    • Market Attractiveness Analysis
      • By Country
      • By Product
      • By End User
    • Key Takeaways
  11. Europe Market Analysis 2020-2024 and Forecast 2025-2035, By Country
    • Historical Market Size Value (US$ Bn) & Volume (Units) Trend Analysis By Market Taxonomy, 2020-2024
    • Market Size Value (US$ Bn) & Volume (Units) Forecast By Market Taxonomy, 2025-2035
      • By Country
        • Germany
        • Italy
        • France
        • U.K.
        • Spain
        • Russia
        • BENELUX
        • Rest of Europe
      • By Product
      • By End User
    • Market Attractiveness Analysis
      • By Country
      • By Product
      • By End User
    • Key Takeaways
  12. East Asia Market Analysis 2020-2024 and Forecast 2025-2035, By Country
    • Historical Market Size Value (US$ Bn) & Volume (Units) Trend Analysis By Market Taxonomy, 2020-2024
    • Market Size Value (US$ Bn) & Volume (Units) Forecast By Market Taxonomy, 2025-2035
      • By Country
        • China
        • Japan
        • South Korea
      • By Product
      • By End User
    • Market Attractiveness Analysis
      • By Country
      • By Product
      • By End User
    • Key Takeaways
  13. South Asia Market Analysis 2020-2024 and Forecast 2025-2035, By Country
    • Historical Market Size Value (US$ Bn) & Volume (Units) Trend Analysis By Market Taxonomy, 2020-2024
    • Market Size Value (US$ Bn) & Volume (Units) Forecast By Market Taxonomy, 2025-2035
      • By Country
        • India
        • Thailand
        • Malaysia
        • Indonesia
        • Rest of South Asia
      • By Product
      • By End User
    • Market Attractiveness Analysis
      • By Country
      • By Product
      • By End User
    • Key Takeaways
  14. Oceania Market Analysis 2020-2024 and Forecast 2025-2035, By Country
    • Historical Market Size Value (US$ Bn) & Volume (Units) Trend Analysis By Market Taxonomy, 2020-2024
    • Market Size Value (US$ Bn) & Volume (Units) Forecast By Market Taxonomy, 2025-2035
      • By Country
        • Australia
        • New Zealand
      • By Product
      • By End User
    • Market Attractiveness Analysis
      • By Country
      • By Product
      • By End User
    • Key Takeaways
  15. MEA Market Analysis 2020-2024 and Forecast 2025-2035, By Country
    • Historical Market Size Value (US$ Bn) & Volume (Units) Trend Analysis By Market Taxonomy, 2020-2024
    • Market Size Value (US$ Bn) & Volume (Units) Forecast By Market Taxonomy, 2025-2035
      • By Country
        • GCC
        • Rest of MEA
      • By Product
      • By End User
    • Market Attractiveness Analysis
      • By Country
      • By Product
      • By End User
    • Key Takeaways
  16. Key Countries Market Analysis
    • Value (US$ Bn) & Volume (Units)ed States
      • Pricing Analysis
      • Market Share Analysis, 2024
        • By Product
        • By End User
    • Germany
      • Pricing Analysis
      • Market Share Analysis, 2024
        • By Product
        • By End User
    • China
      • Pricing Analysis
      • Market Share Analysis, 2024
        • By Product
        • By End User
    • Japan
      • Pricing Analysis
      • Market Share Analysis, 2024
        • By Product
        • By End User
    • France
      • Pricing Analysis
      • Market Share Analysis, 2024
        • By Product
        • By End User
  17. Market Structure Analysis
    • Competition Dashboard
    • Competition Benchmarking
    • Market Share Analysis of Top Players
      • By Regional
      • By Product
      • By End User
  18. Competition Analysis
    • Competition Deep Dive
      • Cobham Limited
        • Overview
        • Product Portfolio
        • Profitability by Market Segments (Product/Age /Sales Channel/Region)
        • Sales Footprint
        • Strategy Overview
          • Marketing Strategy
          • Product Strategy
          • Channel Strategy
      • Combient Oy
        • Overview
        • Product Portfolio
        • Profitability by Market Segments (Product/Age /Sales Channel/Region)
        • Sales Footprint
        • Strategy Overview
          • Marketing Strategy
          • Product Strategy
          • Channel Strategy
      • MERSEN Property
        • Overview
        • Product Portfolio
        • Profitability by Market Segments (Product/Age /Sales Channel/Region)
        • Sales Footprint
        • Strategy Overview
          • Marketing Strategy
          • Product Strategy
          • Channel Strategy
      • Moflon Technology
        • Overview
        • Product Portfolio
        • Profitability by Market Segments (Product/Age /Sales Channel/Region)
        • Sales Footprint
        • Strategy Overview
          • Marketing Strategy
          • Product Strategy
          • Channel Strategy
      • Moog Inc.
        • Overview
        • Product Portfolio
        • Profitability by Market Segments (Product/Age /Sales Channel/Region)
        • Sales Footprint
        • Strategy Overview
          • Marketing Strategy
          • Product Strategy
          • Channel Strategy
      • Pandect Precision Components Ltd.
        • Overview
        • Product Portfolio
        • Profitability by Market Segments (Product/Age /Sales Channel/Region)
        • Sales Footprint
        • Strategy Overview
          • Marketing Strategy
          • Product Strategy
          • Channel Strategy
      • ROTAC Co. Ltd.
        • Overview
        • Product Portfolio
        • Profitability by Market Segments (Product/Age /Sales Channel/Region)
        • Sales Footprint
        • Strategy Overview
          • Marketing Strategy
          • Product Strategy
          • Channel Strategy
      • Schleifring GmbH
        • Overview
        • Product Portfolio
        • Profitability by Market Segments (Product/Age /Sales Channel/Region)
        • Sales Footprint
        • Strategy Overview
          • Marketing Strategy
          • Product Strategy
          • Channel Strategy
      • SPINNER GmbH
        • Overview
        • Product Portfolio
        • Profitability by Market Segments (Product/Age /Sales Channel/Region)
        • Sales Footprint
        • Strategy Overview
          • Marketing Strategy
          • Product Strategy
          • Channel Strategy
      • STEMMANN-TECHNIK
        • Overview
        • Product Portfolio
        • Profitability by Market Segments (Product/Age /Sales Channel/Region)
        • Sales Footprint
        • Strategy Overview
          • Marketing Strategy
          • Product Strategy
          • Channel Strategy
  19. Assumptions & Acronyms Used
  20. Research Methodology

List Of Table

  • Table 1: Global Market Value (US$ Bn) Forecast by Region, 2020 to 2035
  • Table 2: Global Market Volume (Units) Forecast by Region, 2020 to 2035
  • Table 3: Global Market Value (US$ Bn) Forecast by Product, 2020 to 2035
  • Table 4: Global Market Volume (Units) Forecast by Product, 2020 to 2035
  • Table 5: Global Market Value (US$ Bn) Forecast by End User, 2020 to 2035
  • Table 6: Global Market Volume (Units) Forecast by End User, 2020 to 2035
  • Table 7: North America Market Value (US$ Bn) Forecast by Country, 2020 to 2035
  • Table 8: North America Market Volume (Units) Forecast by Country, 2020 to 2035
  • Table 9: North America Market Value (US$ Bn) Forecast by Product, 2020 to 2035
  • Table 10: North America Market Volume (Units) Forecast by Product, 2020 to 2035
  • Table 11: North America Market Value (US$ Bn) Forecast by End User, 2020 to 2035
  • Table 12: North America Market Volume (Units) Forecast by End User, 2020 to 2035
  • Table 13: Latin America Market Value (US$ Bn) Forecast by Country, 2020 to 2035
  • Table 14: Latin America Market Volume (Units) Forecast by Country, 2020 to 2035
  • Table 15: Latin America Market Value (US$ Bn) Forecast by Product, 2020 to 2035
  • Table 16: Latin America Market Volume (Units) Forecast by Product, 2020 to 2035
  • Table 17: Latin America Market Value (US$ Bn) Forecast by End User, 2020 to 2035
  • Table 18: Latin America Market Volume (Units) Forecast by End User, 2020 to 2035
  • Table 19: Europe Market Value (US$ Bn) Forecast by Country, 2020 to 2035
  • Table 20: Europe Market Volume (Units) Forecast by Country, 2020 to 2035
  • Table 21: Europe Market Value (US$ Bn) Forecast by Product, 2020 to 2035
  • Table 22: Europe Market Volume (Units) Forecast by Product, 2020 to 2035
  • Table 23: Europe Market Value (US$ Bn) Forecast by End User, 2020 to 2035
  • Table 24: Europe Market Volume (Units) Forecast by End User, 2020 to 2035
  • Table 25: East Asia Market Value (US$ Bn) Forecast by Country, 2020 to 2035
  • Table 26: East Asia Market Volume (Units) Forecast by Country, 2020 to 2035
  • Table 27: East Asia Market Value (US$ Bn) Forecast by Product, 2020 to 2035
  • Table 28: East Asia Market Volume (Units) Forecast by Product, 2020 to 2035
  • Table 29: East Asia Market Value (US$ Bn) Forecast by End User, 2020 to 2035
  • Table 30: East Asia Market Volume (Units) Forecast by End User, 2020 to 2035
  • Table 31: South Asia Market Value (US$ Bn) Forecast by Country, 2020 to 2035
  • Table 32: South Asia Market Volume (Units) Forecast by Country, 2020 to 2035
  • Table 33: South Asia Market Value (US$ Bn) Forecast by Product, 2020 to 2035
  • Table 34: South Asia Market Volume (Units) Forecast by Product, 2020 to 2035
  • Table 35: South Asia Market Value (US$ Bn) Forecast by End User, 2020 to 2035
  • Table 36: South Asia Market Volume (Units) Forecast by End User, 2020 to 2035
  • Table 37: Oceania Market Value (US$ Bn) Forecast by Country, 2020 to 2035
  • Table 38: Oceania Market Volume (Units) Forecast by Country, 2020 to 2035
  • Table 39: Oceania Market Value (US$ Bn) Forecast by Product, 2020 to 2035
  • Table 40: Oceania Market Volume (Units) Forecast by Product, 2020 to 2035
  • Table 41: Oceania Market Value (US$ Bn) Forecast by End User, 2020 to 2035
  • Table 42: Oceania Market Volume (Units) Forecast by End User, 2020 to 2035
  • Table 43: MEA Market Value (US$ Bn) Forecast by Country, 2020 to 2035
  • Table 44: MEA Market Volume (Units) Forecast by Country, 2020 to 2035
  • Table 45: MEA Market Value (US$ Bn) Forecast by Product, 2020 to 2035
  • Table 46: MEA Market Volume (Units) Forecast by Product, 2020 to 2035
  • Table 47: MEA Market Value (US$ Bn) Forecast by End User, 2020 to 2035
  • Table 48: MEA Market Volume (Units) Forecast by End User, 2020 to 2035

List Of Figures

  • Figure 1: Global Market Volume (Units) Forecast 2020 to 2035
  • Figure 2: Global Market Pricing Analysis
  • Figure 3: Global Market Value (US$ Bn) Forecast 2020 to 2035
  • Figure 4: Global Market Value Share and BPS Analysis by Product, 2025 and 2035
  • Figure 5: Global Market Y-o-Y Growth Comparison by Product, 2025 to 2035
  • Figure 6: Global Market Attractiveness Analysis by Product
  • Figure 7: Global Market Value Share and BPS Analysis by End User, 2025 and 2035
  • Figure 8: Global Market Y-o-Y Growth Comparison by End User, 2025 to 2035
  • Figure 9: Global Market Attractiveness Analysis by End User
  • Figure 10: Global Market Value (US$ Bn) Share and BPS Analysis by Region, 2025 and 2035
  • Figure 11: Global Market Y-o-Y Growth Comparison by Region, 2025 to 2035
  • Figure 12: Global Market Attractiveness Analysis by Region
  • Figure 13: North America Market Incremental $ Opportunity, 2025 to 2035
  • Figure 14: Latin America Market Incremental $ Opportunity, 2025 to 2035
  • Figure 15: Europe Market Incremental $ Opportunity, 2025 to 2035
  • Figure 16: East Asia Market Incremental $ Opportunity, 2025 to 2035
  • Figure 17: South Asia Market Incremental $ Opportunity, 2025 to 2035
  • Figure 18: Oceania Market Incremental $ Opportunity, 2025 to 2035
  • Figure 19: MEA Market Incremental $ Opportunity, 2025 to 2035
  • Figure 20: North America Market Value Share and BPS Analysis by Country, 2025 and 2035
  • Figure 21: North America Market Value Share and BPS Analysis by Product, 2025 and 2035
  • Figure 22: North America Market Y-o-Y Growth Comparison by Product, 2025 to 2035
  • Figure 23: North America Market Attractiveness Analysis by Product
  • Figure 24: North America Market Value Share and BPS Analysis by End User, 2025 and 2035
  • Figure 25: North America Market Y-o-Y Growth Comparison by End User, 2025 to 2035
  • Figure 26: North America Market Attractiveness Analysis by End User
  • Figure 27: Latin America Market Value Share and BPS Analysis by Country, 2025 and 2035
  • Figure 28: Latin America Market Value Share and BPS Analysis by Product, 2025 and 2035
  • Figure 29: Latin America Market Y-o-Y Growth Comparison by Product, 2025 to 2035
  • Figure 30: Latin America Market Attractiveness Analysis by Product
  • Figure 31: Latin America Market Value Share and BPS Analysis by End User, 2025 and 2035
  • Figure 32: Latin America Market Y-o-Y Growth Comparison by End User, 2025 to 2035
  • Figure 33: Latin America Market Attractiveness Analysis by End User
  • Figure 34: Europe Market Value Share and BPS Analysis by Country, 2025 and 2035
  • Figure 35: Europe Market Value Share and BPS Analysis by Product, 2025 and 2035
  • Figure 36: Europe Market Y-o-Y Growth Comparison by Product, 2025 to 2035
  • Figure 37: Europe Market Attractiveness Analysis by Product
  • Figure 38: Europe Market Value Share and BPS Analysis by End User, 2025 and 2035
  • Figure 39: Europe Market Y-o-Y Growth Comparison by End User, 2025 to 2035
  • Figure 40: Europe Market Attractiveness Analysis by End User
  • Figure 41: East Asia Market Value Share and BPS Analysis by Country, 2025 and 2035
  • Figure 42: East Asia Market Value Share and BPS Analysis by Product, 2025 and 2035
  • Figure 43: East Asia Market Y-o-Y Growth Comparison by Product, 2025 to 2035
  • Figure 44: East Asia Market Attractiveness Analysis by Product
  • Figure 45: East Asia Market Value Share and BPS Analysis by End User, 2025 and 2035
  • Figure 46: East Asia Market Y-o-Y Growth Comparison by End User, 2025 to 2035
  • Figure 47: East Asia Market Attractiveness Analysis by End User
  • Figure 48: South Asia Market Value Share and BPS Analysis by Country, 2025 and 2035
  • Figure 49: South Asia Market Value Share and BPS Analysis by Product, 2025 and 2035
  • Figure 50: South Asia Market Y-o-Y Growth Comparison by Product, 2025 to 2035
  • Figure 51: South Asia Market Attractiveness Analysis by Product
  • Figure 52: South Asia Market Value Share and BPS Analysis by End User, 2025 and 2035
  • Figure 53: South Asia Market Y-o-Y Growth Comparison by End User, 2025 to 2035
  • Figure 54: South Asia Market Attractiveness Analysis by End User
  • Figure 55: Oceania Market Value Share and BPS Analysis by Country, 2025 and 2035
  • Figure 56: Oceania Market Value Share and BPS Analysis by Product, 2025 and 2035
  • Figure 57: Oceania Market Y-o-Y Growth Comparison by Product, 2025 to 2035
  • Figure 58: Oceania Market Attractiveness Analysis by Product
  • Figure 59: Oceania Market Value Share and BPS Analysis by End User, 2025 and 2035
  • Figure 60: Oceania Market Y-o-Y Growth Comparison by End User, 2025 to 2035
  • Figure 61: Oceania Market Attractiveness Analysis by End User
  • Figure 62: MEA Market Value Share and BPS Analysis by Country, 2025 and 2035
  • Figure 63: MEA Market Value Share and BPS Analysis by Product, 2025 and 2035
  • Figure 64: MEA Market Y-o-Y Growth Comparison by Product, 2025 to 2035
  • Figure 65: MEA Market Attractiveness Analysis by Product
  • Figure 66: MEA Market Value Share and BPS Analysis by End User, 2025 and 2035
  • Figure 67: MEA Market Y-o-Y Growth Comparison by End User, 2025 to 2035
  • Figure 68: MEA Market Attractiveness Analysis by End User
  • Figure 69: Global Market - Tier Structure Analysis
  • Figure 70: Global Market - Company Share Analysis

- FAQs -

What is the Global Slip Ring Market Size in 2025?

The slip ring market is valued at USD 1,624.8 million in 2025.

Who are the Major Players Operating in the Slip Ring Market?

Prominent players in the slip ring market include Cobham Limited, Combinent Oy, MERSEN Property, Moflon Technology, Moog Inc., and others.

What is the Estimated Valuation of the Slip Ring Market by 2035?

The slip ring market is expected to reach a valuation of USD 2,523.3 million by 2035.

What Value CAGR Did the Slip Ring Market Exhibit over the Last Five Years?

The historic growth rate of the slip ring market was 3.7% from 2020-2024.

Slip Ring Market

Schedule a Call