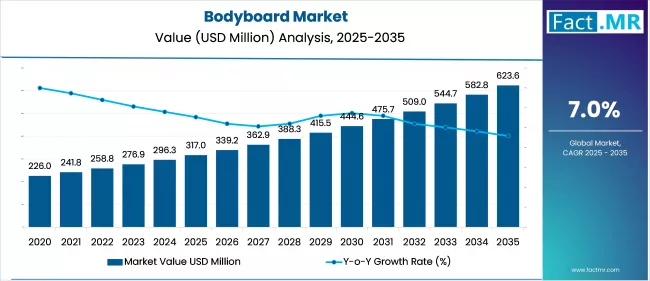
Bodyboard Market

Bodyboard Market Analysis, By Product Type, By Buyer Type, By Sales Channel, By Application, and By Region- Market Insights 2025 to 2035

The Conventional segment is projected to grow at a CAGR of 7.3%, whereas another segment 30.1

Bodyboard Market Outlook (2025 to 2035)

The global bodyboard market is expected to reach USD 623.6 million by 2035, up from USD 296.3 million in 2024. During the forecast period of 2025 to 2035, the industry is projected to expand at a CAGR of 7%, driven by the growth of coastal tourism, youth interest in water sports, affordability, and social media influence.

The presence of technological innovations and eco-conscious designs, along with surf schools and rental facilities, supports bodyboarding and contributes to its demand among recreational and semi-professional users.

Bodyboard Market

What are the drivers of the Bodyboard Market?

Increased coastal tourism and recreational beach activities, such as surfing and riding, contribute to the growing demand for bodyboards. Tourists are shifting from passive land-based activities to active, participatory experiences that can be achieved through bodyboarding, due to its low learning curve, safety, and affordability.

California, Portland, Australia, and Southeast Asia are popular tourist destinations that market water sports through surf camps, rental centers, and local activities. The governments and tourism boards are also investing in the beach infrastructure and adventure tourism, which further promotes their participation.

This expansion of tourist traffic at the coastline is a direct boost to bodyboard purchases, particularly among beginners and families seeking an easy-to-use water sport that involves minimal equipment.

The low barrier to entry, cost efficiency, and association with beach culture make the sport a suitable recreational activity for teenagers and young adults, offering shared experiences. Companies have released bright, youth-focused designs and featured young athletes to promote the product. The portrayal of the sport as energetic, accessible, and engaging supports its presence among younger markets globally.

The development of bodyboard technologies and materials continues to drive market growth. The manufacturers are also working on performance-enhancing features, such as contoured decks, strengthened stringers, and thermo-fused slick bottoms, to increase speed, control, and response to waves.

Recyclable and biobased materials have been incorporated, following current trends in eco-conscious consumers, creating sustainability as a functional value. Other aspects, such as a lightweight structure, customization options, and ergonomic design, are also receiving attention. These adjustments improve product life and appeal to both casual and competitive users seeking reliable equipment.

What are the regional trends of the Bodyboard Market?

North America is experiencing steady demand, supported by an established surf culture in the U.S., particularly on the California and Hawaii coasts. Tourism by season and surf schools also contribute to the growth of this market.

Portugal, France and Spain are emerging as areas of interest in Europe as surf tourism and international surf contests are raising awareness. Investment in coastal sports and youth involvement programs supports the growth.

Asia-Pacific is showing notable market activity, with expanding tourist destinations on beaches in Indonesia, Thailand, and Australia. Adoption is being enhanced by local manufacturing and improvements in infrastructure related to adventure tourism.

Latin America benefits from local tourism and the affordability of water sports in Brazil. Bodyboarding culture is popularized by coastal regions suitable for surfing and by community-led recreational events.

The region of the Middle East & Africa is developing gradually, with South Africa and the UAE being the primary tourist destinations. Government initiatives promote sports tourism and coastal recreation through targeted investments in select growth segments.

What are the challenges and restraining factors of the Bodyboard Market?

One issue bodyboard manufacturers encounter is the seasonal demands, which result in inconsistent sales patterns. The market is highly influenced by warmer periods and travel peaks, thus restricting year-round revenue generation in many regions.

The inventory turnover during these off-peak months is a significant problem for retailers and rental services, which can complicate their success and profitability in the long run. This is also cyclical, and therefore, smaller brands find it difficult to scale up consistently or invest regularly in product innovation.

The absence of organized training ecosystems and professional development platforms for bodyboarding is another notable problem. However, unlike surfing, bodyboarding lacks world federations, televised events or well-established sponsorship pipelines.

This impacts the aspirational nature of the sport and its competitive culture, particularly for young individuals seeking a career. The visibility and long-term participation of athletes are low without formal channels. A significant roadblock to the bodyboard market is the increased competition posed by other available water sports activities, such as stand-up paddleboarding and inflatable kayaking.

The target market for these alternatives is typically families, fitness enthusiasts, and leisure travelers, and they typically have a larger range of applications. Unless companies can differentiate between the improved experience and exhilaration that bodyboarding offers, it could lose market share as consumers shift toward more multipurpose equipment.

Country-Wise Insights

Adventure-Led Training Culture Boosting USA Bodyboard Market

Bodyboard Market Cagr Analysis By Country

The coastal lifestyle in the United States, particularly in California, Hawaii, and Florida, where communities have fostered a culture around wave sports, is the driving force behind the bodyboard industry.

Beginners and teenagers participating in after-school bodyboard clubs, community competitions, and youth surfing camps benefit from structured exposure to the sport.

To accommodate the varied wave conditions encountered across American coastlines, brands are adopting channeling system, lighter hydrodynamic curves, and the responsive crescent-shaped tails. Advanced features like ride trackers and grip-mapped deck textures are integrated, and the technology is becoming more popular in high-performance training locations like Huntington Beach.

United States Bodyboard Market Value Analysis

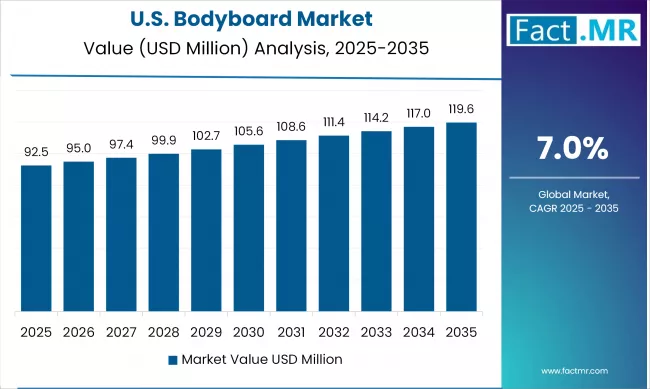
Virtual wave simulation and motion-responsive training suits are included in the athlete development programs and bodyboarders can practice more control and maneuverability of their bodies. The convergence of surf-focused travel, youth sports programs, and advancements in equipment manufacturing positions the United States as a center of innovation within the global bodyboard industry.

Wave Consistency and Coastal Integration Driving Australia Bodyboard Market

The bodyboard market in Australia is closely linked to the country's surf culture, supported by the consistent wave activity along the east and south coasts. Regional bodyboard leagues in New South Wales and Queensland as well as the surf safety programs in schools promote early adoption and the involvement of community activities.

Local manufacturers focus on producing high-resilience core, UV-resistant slicks, thermal-bond lamination against heavy sun and reef breaks of high impacts. Wave condition 24/7 sensing, integrated speed monitor, and flexible contoured tail curves are getting common in premium quality accessories used by athletes training at well-known beaches such as Cronulla and Margaret River.

The sports funding provisions that are state-based, beach-lifestyle promotion and sophisticated performance assessment buildings continue to position Australia as an international standard in bodyboarding skills and product sustainability.

Engineering precision and club-based training elevating Germany bodyboard market

The German bodyboard scene is evolving through precision engineering, sports science, and a newly developed club-based training system. The local innovation hubs are producing high efficiency board tool molds using thermoplastics core and interchangeable tail templates that are suitable for river surfing and indoor wave surfing.

Bodyboarding is gaining traction within grassroots surfing communities in urban areas such as Munich, home to the Eisbach River, where urban surf clubs are emerging with dedicated bodyboarding divisions.

Motion capture labs, along with the performance analysis of maneuver accuracies, help training academies in maintaining competitive standards, even when the access to the coastline is limited. The interest in biomechanics, the production of customized gears, and the organizational path in athletic growth in Germany is shaping a distinct inland approach to bodyboarding

Category-Wise Analysis

Durability-led development enhancing conventional bodyboard demand

Bodyboard Market Analysis By Apparel Type

Conventional bodyboards will continue to dominate the market due to their affordability, strength, and adaptability to varying wave conditions, making them well-suited for beginners and recreational users. To better balance, as well as to enhance contact with waves, brands are refining traditional models with high-density foam cores, reinforced slicks and decks which are contoured to best suit the body.

Enhancements focus on user comfort, extended product lifespan, and reduced learning curve. Other modular accessories offered by American firms include detachable fins, elbow supports, and other accessories designed to improve control without overcomplicating the experience.

Their cost-effectiveness and ease of use help keep traditional bodyboards in circulation, particularly through training camps, rental services, and surf club programs targeting entry-level users, as well as beach resort programs.

Recreation-led participation expanding market base in coastal communities

Bodyboard Market Analysis By Buyer Type

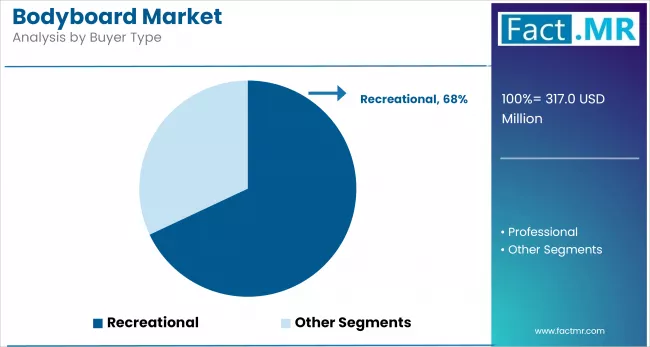
The bodyboard industry is predominantly driven by recreational users, including families spending time at the beach, water sports enthusiasts, and casual board riders. Lightweight boards, vibrant designs, and soft-edge features are being introduced to appeal to users of all ages, particularly in family-oriented resort areas.

Bodyboarding is commonly found in resorts and along coasts, often offered as a low-risk sport that requires minimal equipment and can be learned without specialized training. A number of state beaches in the U.S. have also introduced guided bodyboard days and kids' splash camps, which have given a further boost to this category of buyers.

To these users, the basic purchase considerations are comfort, portability and appearance. These remain the core features that domestic manufacturers continue to prioritize in their product offerings.

In-store trial and rental programs fuel offline channel sales

The offline retail channel remains essential to bodyboard distribution, which is fueled by the beachfront shops, surf school and sporting goods retailers. Direct board handling, personalized fitting guidance, and the availability of same-day rental services instill confidence in customers, which often leads to immediate purchases.

Physical outlets also provide seasonal deals, combo packages of gear, and custom-fitting services that are not typically available online. In an effort to attract visitors, brands are establishing micro-surf gear stores and hosting events, in addition to demo booths, at beach festivals and tourism events.

With coastal activity returning to pre-pandemic levels, physical retail has not only endured but benefited from experiential marketing and increased product exposure among first-time buyers and tourists.

Competitive Analysis

The bodyboard market represents a healthy competition between new, specialized brands that compete on board functionality, wear-and-tear resistance, and rider-oriented designs, and established competitors that produce water sports equipment.

Smaller businesses are competing for market share with eco-friendly constructions, minimalist cores, and custom shaping, while larger brands, such as long-standing partnerships with surf schools, retail establishments, and vacation rental resorts, continue to define their positioning. Their innovations cater to riders who prioritize smoother control, faster handling, and gear that aligns with their personal style and environmental concerns.

Competition remains active among recreational and semi-pro users, who demand ergonomic and aesthetically contrasting boards that incorporate add-ons such as sensitive fins, grip-designed deck topography, and tail designs suited to varying wave intensities.

Experiential retail strategies, coaching platforms that integrate technology, and AI-enabled wave analysis tools are contributing to the complexity of the market landscape.

Since performance and aesthetic standards shift rapidly across seasonal cycles, the bodyboard industry continually adjusts to meet the evolving needs of wave riders seeking intelligent, sport-ready equipment.

Key players in the bodyboard industry include Alder Sportswear Ltd., Catch Surfboard Co., Hubboards, Moreyboggie, Mikestewart Inc., and ES Water Sports, among others.

Recent Developments

  • In July 2025, Pride Bodyboards unveiled its latest collection featuring the Realest Bat Tail, Zippy, Koned, and Obsessor models. Engineered with Radial Flex®, Varial Mesh, and SDC+ technology, the lineup enhances speed, control, and durability. These performance-driven boards cater to a diverse range of riding styles, redefining precision and power in wave riding.

Fact.MR has provided detailed information about the price points of key manufacturers in the Bodyboard market, positioned across regions, as well as sales growth, production capacity, and speculative technological expansion, in its recently published report.

Methodology and Industry Tracking Approach

The global bodyboard market report 2025 presents insights from 10,500 respondents across 35 countries, with around 250 participants per regional subdivision. The study involved bodyboarders, surf instructors, hydrodynamic designers, and water sports gear specialists, as well as stakeholders such as surf school operators, coastal gear retailers, and training camp organizers.

Conducted between July 2024 and June 2025, it analyzed usage patterns, safety design, wave performance, and unmet market needs using structured, behavior-based questionnaires. Advanced statistical techniques, including wave-adaptive behavioral regression and weighted response modeling, were employed to address regional competitiveness, seasonal differences, and limited market sizes.

The findings provide valuable guidance for gear manufacturers, surf institutions, and product developers seeking to enhance performance, durability, and user-centric design. Supported by over 300 authoritative sources ranging from engineering periodicals to patent databases, the report delivers recommendations on materials, ergonomics, environmental compliance, and customization, with Fact.MR’s ongoing trend monitoring since 2018 makes this study a trusted resource for strategic market planning.

Segmentation of Bodyboard Market

  • By Product Type :

    • Conventional
      • 30.1" to 35"
      • 35.1" to 40"
      • 40.1" to 45"
      • Greater than 45"
    • Tandem
  • By Buyer Type :

    • Recreational
    • Professional
  • By Sales Channel :

    • Offline Sales Channel
      • Modern Trade
      • Sports Equipment Stores
      • Surfing Equipment Stores
      • Water Sports Stores
      • Brand Stores
    • Online Sales Channel
      • Company Websites
      • E-Commerce Platforms
  • By Application :

    • Commercial
    • Private
  • By Region :

    • North America
    • Latin America
    • Western Europe
    • Eastern Europe
    • East Asia
    • South Asia & Pacific
    • Middle East & Africa

Table of Content

  1. Executive Summary
    • Global Market Outlook
    • Demand-side Trends
    • Supply-side Trends
    • Technology Roadmap Analysis
    • Analysis and Recommendations
  2. Market Overview
    • Market Coverage / Taxonomy
    • Market Definition / Scope / Limitations
  3. Market Background
    • Market Dynamics
      • Drivers
      • Restraints
      • Opportunity
      • Trends
    • Scenario Forecast
      • Demand in Optimistic Scenario
      • Demand in Likely Scenario
      • Demand in Conservative Scenario
    • Opportunity Map Analysis
    • Product Life Cycle Analysis
    • Supply Chain Analysis
      • Supply Side Participants and their Roles
        • Producers
        • Mid-Level Participants (Traders/ Agents/ Brokers)
        • Wholesalers and Distributors
      • Value Added and Value Created at Node in the Supply Chain
      • List of Component Suppliers
      • List of Existing and Potential Buyers
    • Investment Feasibility Matrix
    • Value Chain Analysis
      • Profit Margin Analysis
      • Wholesalers and Distributors
      • Retailers
    • PESTLE and Porter’s Analysis
    • Regulatory Landscape
      • By Key Regions
      • By Key Countries
    • Production and Consumption Statistics
    • Import and Export Statistics
  4. Global Market Analysis 2020 to 2024 and Forecast, 2025 to 2035
    • Historical Market Size Value (USD Mn) & Volume (Units) Analysis, 2020 to 2024
    • Current and Future Market Size Value (USD Mn) & Volume (Units) Projections, 2025 to 2035
      • Y-o-Y Growth Trend Analysis
      • Absolute $ Opportunity Analysis
  5. Global Market Pricing Analysis 2020 to 2024 and Forecast 2025 to 2035
  6. Global Market Analysis 2020 to 2024 and Forecast 2025 to 2035, By Type
    • Introduction / Key Findings
    • Historical Market Size Value (USD Mn) & Volume (Units) Analysis By Type, 2020 to 2024
    • Current and Future Market Size Value (USD Mn) & Volume (Units) Analysis and Forecast By Type, 2025 to 2035
      • Conventional
        • 30.1" to 35"
        • 35.1" to 40"
        • 40.1" to 45"
        • Greater than 45"
      • Tandem
    • Y-o-Y Growth Trend Analysis By Type, 2020 to 2024
    • Absolute $ Opportunity Analysis By Type, 2025 to 2035
  7. Global Market Analysis 2020 to 2024 and Forecast 2025 to 2035, By Buyer Type
    • Introduction / Key Findings
    • Historical Market Size Value (USD Mn) & Volume (Units) Analysis By Buyer Type, 2020 to 2024
    • Current and Future Market Size Value (USD Mn) & Volume (Units) Analysis and Forecast By Buyer Type, 2025 to 2035
      • Recreational
      • Professional
    • Y-o-Y Growth Trend Analysis By Buyer Type, 2020 to 2024
    • Absolute $ Opportunity Analysis By Buyer Type, 2025 to 2035
  8. Global Market Analysis 2020 to 2024 and Forecast 2025 to 2035, By Sales Channel
    • Introduction / Key Findings
    • Historical Market Size Value (USD Mn) & Volume (Units) Analysis By Sales Channel, 2020 to 2024
    • Current and Future Market Size Value (USD Mn) & Volume (Units) Analysis and Forecast By Sales Channel, 2025 to 2035
      • Offline Sales Channel
        • Modern Trade
        • Sports Equipment Stores
        • Surfing Equipment Stores
        • Water Sports Stores
        • Brand Stores
      • Online Sales Channel
        • Company Websites
        • E-Commerce Platforms
    • Y-o-Y Growth Trend Analysis By Sales Channel, 2020 to 2024
    • Absolute $ Opportunity Analysis By Sales Channel, 2025 to 2035
  9. Global Market Analysis 2020 to 2024 and Forecast 2025 to 2035, By Application
    • Introduction / Key Findings
    • Historical Market Size Value (USD Mn) & Volume (Units) Analysis By Application, 2020 to 2024
    • Current and Future Market Size Value (USD Mn) & Volume (Units) Analysis and Forecast By Application, 2025 to 2035
      • Commercial
      • Private
    • Y-o-Y Growth Trend Analysis By Application, 2020 to 2024
    • Absolute $ Opportunity Analysis By Application, 2025 to 2035
  10. Global Market Analysis 2020 to 2024 and Forecast 2025 to 2035, By Region
    • Introduction
    • Historical Market Size Value (USD Mn) & Volume (Units) Analysis By Region, 2020 to 2024
    • Current Market Size Value (USD Mn) & Volume (Units) Analysis and Forecast By Region, 2025 to 2035
      • North America
      • Latin America
      • Western Europe
      • East Asia
      • South Asia Pacific
      • Eastern Europe
      • Middle East & Africa
    • Market Attractiveness Analysis By Region
  11. North America Market Analysis 2020 to 2024 and Forecast 2025 to 2035, By Country
    • Historical Market Size Value (USD Mn) & Volume (Units) Trend Analysis By Market Taxonomy, 2020 to 2024
    • Market Size Value (USD Mn) & Volume (Units) Forecast By Market Taxonomy, 2025 to 2035
      • By Country
        • U.S.
        • Canada
        • Mexico
      • By Type
      • By Buyer Type
      • By Sales Channel
      • By Application
    • Market Attractiveness Analysis
      • By Country
      • By Type
      • By Buyer Type
      • By Sales Channel
      • By Application
    • Key Takeaways
  12. Latin America Market Analysis 2020 to 2024 and Forecast 2025 to 2035, By Country
    • Historical Market Size Value (USD Mn) & Volume (Units) Trend Analysis By Market Taxonomy, 2020 to 2024
    • Market Size Value (USD Mn) & Volume (Units) Forecast By Market Taxonomy, 2025 to 2035
      • By Country
        • Brazil
        • Chile
        • Rest of Latin America
      • By Type
      • By Buyer Type
      • By Sales Channel
      • By Application
    • Market Attractiveness Analysis
      • By Country
      • By Type
      • By Buyer Type
      • By Sales Channel
      • By Application
    • Key Takeaways
  13. Western Europe Market Analysis 2020 to 2024 and Forecast 2025 to 2035, By Country
    • Historical Market Size Value (USD Mn) & Volume (Units) Trend Analysis By Market Taxonomy, 2020 to 2024
    • Market Size Value (USD Mn) & Volume (Units) Forecast By Market Taxonomy, 2025 to 2035
      • By Country
        • Germany
        • Italy
        • France
        • U.K.
        • Spain
        • Russia
        • BENELUX
        • Rest of Europe
      • By Type
      • By Buyer Type
      • By Sales Channel
      • By Application
    • Market Attractiveness Analysis
      • By Country
      • By Type
      • By Buyer Type
      • By Sales Channel
      • By Application
    • Key Takeaways
  14. East Asia Market Analysis 2020 to 2024 and Forecast 2025 to 2035, By Country
    • Historical Market Size Value (USD Mn) & Volume (Units) Trend Analysis By Market Taxonomy, 2020 to 2024
    • Market Size Value (USD Mn) & Volume (Units) Forecast By Market Taxonomy, 2025 to 2035
      • By Country
        • China
        • Japan
        • South Korea
      • By Type
      • By Buyer Type
      • By Sales Channel
      • By Application
    • Market Attractiveness Analysis
      • By Country
      • By Type
      • By Buyer Type
      • By Sales Channel
      • By Application
    • Key Takeaways
  15. South Asia Pacific Market Analysis 2020 to 2024 and Forecast 2025 to 2035, By Country
    • Historical Market Size Value (USD Mn) & Volume (Units) Trend Analysis By Market Taxonomy, 2020 to 2024
    • Market Size Value (USD Mn) & Volume (Units) Forecast By Market Taxonomy, 2025 to 2035
      • By Country
        • India
        • ASEAN Countries
        • Australia & New Zealand
        • Rest of South Asia Pacific
      • By Type
      • By Buyer Type
      • By Sales Channel
      • By Application
    • Market Attractiveness Analysis
      • By Country
      • By Type
      • By Buyer Type
      • By Sales Channel
      • By Application
    • Key Takeaways
  16. Eastern Europe Market Analysis 2020 to 2024 and Forecast 2025 to 2035, By Country
    • Historical Market Size Value (USD Mn) & Volume (Units) Trend Analysis By Market Taxonomy, 2020 to 2024
    • Market Size Value (USD Mn) & Volume (Units) Forecast By Market Taxonomy, 2025 to 2035
      • By Country
        • Russia
        • Poland
        • Hungary
        • Balkan & Baltics
        • Rest of Eastern Europe
      • By Type
      • By Buyer Type
      • By Sales Channel
      • By Application
    • Market Attractiveness Analysis
      • By Country
      • By Type
      • By Buyer Type
      • By Sales Channel
      • By Application
    • Key Takeaways
  17. Middle East & Africa Market Analysis 2020 to 2024 and Forecast 2025 to 2035, By Country
    • Historical Market Size Value (USD Mn) & Volume (Units) Trend Analysis By Market Taxonomy, 2020 to 2024
    • Market Size Value (USD Mn) & Volume (Units) Forecast By Market Taxonomy, 2025 to 2035
      • By Country
        • KSA
        • Other GCC Countries
        • Turkiye
        • South Africa
        • Rest of MEA
      • By Type
      • By Buyer Type
      • By Sales Channel
      • By Application
    • Market Attractiveness Analysis
      • By Country
      • By Type
      • By Buyer Type
      • By Sales Channel
      • By Application
    • Key Takeaways
  18. Key Countries Market Analysis
    • U.S.
      • Pricing Analysis
      • Market Share Analysis, 2024
        • By Type
        • By Buyer Type
        • By Sales Channel
        • By Application
    • Australia
      • Pricing Analysis
      • Market Share Analysis, 2024
        • By Type
        • By Buyer Type
        • By Sales Channel
        • By Application
    • Germany
      • Pricing Analysis
      • Market Share Analysis, 2024
        • By Type
        • By Buyer Type
        • By Sales Channel
        • By Application
    • Japan
      • Pricing Analysis
      • Market Share Analysis, 2024
        • By Type
        • By Buyer Type
        • By Sales Channel
        • By Application
    • Brazil
      • Pricing Analysis
      • Market Share Analysis, 2024
        • By Type
        • By Buyer Type
        • By Sales Channel
        • By Application
  19. Market Structure Analysis
    • Competition Dashboard
    • Competition Benchmarking
    • Market Share Analysis of Top Players
      • By Regional
      • By Type
      • By Buyer Type
      • By Sales Channel
      • By Application
  20. Competition Analysis
    • Competition Deep Dive
      • Agit Global, Inc
        • Overview
        • Product Portfolio
        • Profitability by Market Segments (Product/Age /Sales Channel/Region)
        • Sales Footprint
        • Strategy Overview
          • Marketing Strategy
          • Product Strategy
          • Channel Strategy
      • Ballistic Boards
        • Overview
        • Product Portfolio
        • Profitability by Market Segments (Product/Age /Sales Channel/Region)
        • Sales Footprint
        • Strategy Overview
          • Marketing Strategy
          • Product Strategy
          • Channel Strategy
      • CustomX
        • Overview
        • Product Portfolio
        • Profitability by Market Segments (Product/Age /Sales Channel/Region)
        • Sales Footprint
        • Strategy Overview
          • Marketing Strategy
          • Product Strategy
          • Channel Strategy
      • Alder Sportswear Ltd.
        • Overview
        • Product Portfolio
        • Profitability by Market Segments (Product/Age /Sales Channel/Region)
        • Sales Footprint
        • Strategy Overview
          • Marketing Strategy
          • Product Strategy
          • Channel Strategy
      • Catch Surfboard Co.
        • Overview
        • Product Portfolio
        • Profitability by Market Segments (Product/Age /Sales Channel/Region)
        • Sales Footprint
        • Strategy Overview
          • Marketing Strategy
          • Product Strategy
          • Channel Strategy
      • Hubboards
        • Overview
        • Product Portfolio
        • Profitability by Market Segments (Product/Age /Sales Channel/Region)
        • Sales Footprint
        • Strategy Overview
          • Marketing Strategy
          • Product Strategy
          • Channel Strategy
      • Moreyboggie
        • Overview
        • Product Portfolio
        • Profitability by Market Segments (Product/Age /Sales Channel/Region)
        • Sales Footprint
        • Strategy Overview
          • Marketing Strategy
          • Product Strategy
          • Channel Strategy
      • Mikestewart Inc,
        • Overview
        • Product Portfolio
        • Profitability by Market Segments (Product/Age /Sales Channel/Region)
        • Sales Footprint
        • Strategy Overview
          • Marketing Strategy
          • Product Strategy
          • Channel Strategy
      • ES Water Sports
        • Overview
        • Product Portfolio
        • Profitability by Market Segments (Product/Age /Sales Channel/Region)
        • Sales Footprint
        • Strategy Overview
          • Marketing Strategy
          • Product Strategy
          • Channel Strategy
      • Hardy Shapes
        • Overview
        • Product Portfolio
        • Profitability by Market Segments (Product/Age /Sales Channel/Region)
        • Sales Footprint
        • Strategy Overview
          • Marketing Strategy
          • Product Strategy
          • Channel Strategy
      • Nomad Bodyboards
        • Overview
        • Product Portfolio
        • Profitability by Market Segments (Product/Age /Sales Channel/Region)
        • Sales Footprint
        • Strategy Overview
          • Marketing Strategy
          • Product Strategy
          • Channel Strategy
      • Sniper Bodyboards
        • Overview
        • Product Portfolio
        • Profitability by Market Segments (Product/Age /Sales Channel/Region)
        • Sales Footprint
        • Strategy Overview
          • Marketing Strategy
          • Product Strategy
          • Channel Strategy
  21. Assumptions & Acronyms Used
  22. Research Methodology

List Of Table

  • Table 1: Global Market Value (USD Mn) Forecast by Region, 2020 to 2035
  • Table 2: Global Market Volume (Units) Forecast by Region, 2020 to 2035
  • Table 3: Global Market Value (USD Mn) Forecast by Type, 2020 to 2035
  • Table 4: Global Market Volume (Units) Forecast by Type, 2020 to 2035
  • Table 5: Global Market Value (USD Mn) Forecast by Buyer Type, 2020 to 2035
  • Table 6: Global Market Volume (Units) Forecast by Buyer Type, 2020 to 2035
  • Table 7: Global Market Value (USD Mn) Forecast by Sales Channel, 2020 to 2035
  • Table 8: Global Market Volume (Units) Forecast by Sales Channel, 2020 to 2035
  • Table 9: Global Market Value (USD Mn) Forecast by Application, 2020 to 2035
  • Table 10: Global Market Volume (Units) Forecast by Application, 2020 to 2035
  • Table 11: North America Market Value (USD Mn) Forecast by Country, 2020 to 2035
  • Table 12: North America Market Volume (Units) Forecast by Country, 2020 to 2035
  • Table 13: North America Market Value (USD Mn) Forecast by Type, 2020 to 2035
  • Table 14: North America Market Volume (Units) Forecast by Type, 2020 to 2035
  • Table 15: North America Market Value (USD Mn) Forecast by Buyer Type, 2020 to 2035
  • Table 16: North America Market Volume (Units) Forecast by Buyer Type, 2020 to 2035
  • Table 17: North America Market Value (USD Mn) Forecast by Sales Channel, 2020 to 2035
  • Table 18: North America Market Volume (Units) Forecast by Sales Channel, 2020 to 2035
  • Table 19: North America Market Value (USD Mn) Forecast by Application, 2020 to 2035
  • Table 20: North America Market Volume (Units) Forecast by Application, 2020 to 2035
  • Table 21: Latin America Market Value (USD Mn) Forecast by Country, 2020 to 2035
  • Table 22: Latin America Market Volume (Units) Forecast by Country, 2020 to 2035
  • Table 23: Latin America Market Value (USD Mn) Forecast by Type, 2020 to 2035
  • Table 24: Latin America Market Volume (Units) Forecast by Type, 2020 to 2035
  • Table 25: Latin America Market Value (USD Mn) Forecast by Buyer Type, 2020 to 2035
  • Table 26: Latin America Market Volume (Units) Forecast by Buyer Type, 2020 to 2035
  • Table 27: Latin America Market Value (USD Mn) Forecast by Sales Channel, 2020 to 2035
  • Table 28: Latin America Market Volume (Units) Forecast by Sales Channel, 2020 to 2035
  • Table 29: Latin America Market Value (USD Mn) Forecast by Application, 2020 to 2035
  • Table 30: Latin America Market Volume (Units) Forecast by Application, 2020 to 2035
  • Table 31: Western Europe Market Value (USD Mn) Forecast by Country, 2020 to 2035
  • Table 32: Western Europe Market Volume (Units) Forecast by Country, 2020 to 2035
  • Table 33: Western Europe Market Value (USD Mn) Forecast by Type, 2020 to 2035
  • Table 34: Western Europe Market Volume (Units) Forecast by Type, 2020 to 2035
  • Table 35: Western Europe Market Value (USD Mn) Forecast by Buyer Type, 2020 to 2035
  • Table 36: Western Europe Market Volume (Units) Forecast by Buyer Type, 2020 to 2035
  • Table 37: Western Europe Market Value (USD Mn) Forecast by Sales Channel, 2020 to 2035
  • Table 38: Western Europe Market Volume (Units) Forecast by Sales Channel, 2020 to 2035
  • Table 39: Western Europe Market Value (USD Mn) Forecast by Application, 2020 to 2035
  • Table 40: Western Europe Market Volume (Units) Forecast by Application, 2020 to 2035
  • Table 41: East Asia Market Value (USD Mn) Forecast by Country, 2020 to 2035
  • Table 42: East Asia Market Volume (Units) Forecast by Country, 2020 to 2035
  • Table 43: East Asia Market Value (USD Mn) Forecast by Type, 2020 to 2035
  • Table 44: East Asia Market Volume (Units) Forecast by Type, 2020 to 2035
  • Table 45: East Asia Market Value (USD Mn) Forecast by Buyer Type, 2020 to 2035
  • Table 46: East Asia Market Volume (Units) Forecast by Buyer Type, 2020 to 2035
  • Table 47: East Asia Market Value (USD Mn) Forecast by Sales Channel, 2020 to 2035
  • Table 48: East Asia Market Volume (Units) Forecast by Sales Channel, 2020 to 2035
  • Table 49: East Asia Market Value (USD Mn) Forecast by Application, 2020 to 2035
  • Table 50: East Asia Market Volume (Units) Forecast by Application, 2020 to 2035
  • Table 51: South Asia Pacific Market Value (USD Mn) Forecast by Country, 2020 to 2035
  • Table 52: South Asia Pacific Market Volume (Units) Forecast by Country, 2020 to 2035
  • Table 53: South Asia Pacific Market Value (USD Mn) Forecast by Type, 2020 to 2035
  • Table 54: South Asia Pacific Market Volume (Units) Forecast by Type, 2020 to 2035
  • Table 55: South Asia Pacific Market Value (USD Mn) Forecast by Buyer Type, 2020 to 2035
  • Table 56: South Asia Pacific Market Volume (Units) Forecast by Buyer Type, 2020 to 2035
  • Table 57: South Asia Pacific Market Value (USD Mn) Forecast by Sales Channel, 2020 to 2035
  • Table 58: South Asia Pacific Market Volume (Units) Forecast by Sales Channel, 2020 to 2035
  • Table 59: South Asia Pacific Market Value (USD Mn) Forecast by Application, 2020 to 2035
  • Table 60: South Asia Pacific Market Volume (Units) Forecast by Application, 2020 to 2035
  • Table 61: Eastern Europe Market Value (USD Mn) Forecast by Country, 2020 to 2035
  • Table 62: Eastern Europe Market Volume (Units) Forecast by Country, 2020 to 2035
  • Table 63: Eastern Europe Market Value (USD Mn) Forecast by Type, 2020 to 2035
  • Table 64: Eastern Europe Market Volume (Units) Forecast by Type, 2020 to 2035
  • Table 65: Eastern Europe Market Value (USD Mn) Forecast by Buyer Type, 2020 to 2035
  • Table 66: Eastern Europe Market Volume (Units) Forecast by Buyer Type, 2020 to 2035
  • Table 67: Eastern Europe Market Value (USD Mn) Forecast by Sales Channel, 2020 to 2035
  • Table 68: Eastern Europe Market Volume (Units) Forecast by Sales Channel, 2020 to 2035
  • Table 69: Eastern Europe Market Value (USD Mn) Forecast by Application, 2020 to 2035
  • Table 70: Eastern Europe Market Volume (Units) Forecast by Application, 2020 to 2035
  • Table 71: Middle East & Africa Market Value (USD Mn) Forecast by Country, 2020 to 2035
  • Table 72: Middle East & Africa Market Volume (Units) Forecast by Country, 2020 to 2035
  • Table 73: Middle East & Africa Market Value (USD Mn) Forecast by Type, 2020 to 2035
  • Table 74: Middle East & Africa Market Volume (Units) Forecast by Type, 2020 to 2035
  • Table 75: Middle East & Africa Market Value (USD Mn) Forecast by Buyer Type, 2020 to 2035
  • Table 76: Middle East & Africa Market Volume (Units) Forecast by Buyer Type, 2020 to 2035
  • Table 77: Middle East & Africa Market Value (USD Mn) Forecast by Sales Channel, 2020 to 2035
  • Table 78: Middle East & Africa Market Volume (Units) Forecast by Sales Channel, 2020 to 2035
  • Table 79: Middle East & Africa Market Value (USD Mn) Forecast by Application, 2020 to 2035
  • Table 80: Middle East & Africa Market Volume (Units) Forecast by Application, 2020 to 2035

List Of Figures

  • Figure 1: Global Market Volume (Units) Forecast 2020 to 2035
  • Figure 2: Global Market Pricing Analysis
  • Figure 3: Global Market Value (USD Mn) Forecast 2020 to 2035
  • Figure 4: Global Market Value Share and BPS Analysis by Type, 2025 and 2035
  • Figure 5: Global Market Y-o-Y Growth Comparison by Type, 2025 to 2035
  • Figure 6: Global Market Attractiveness Analysis by Type
  • Figure 7: Global Market Value Share and BPS Analysis by Buyer Type, 2025 and 2035
  • Figure 8: Global Market Y-o-Y Growth Comparison by Buyer Type, 2025 to 2035
  • Figure 9: Global Market Attractiveness Analysis by Buyer Type
  • Figure 10: Global Market Value Share and BPS Analysis by Sales Channel, 2025 and 2035
  • Figure 11: Global Market Y-o-Y Growth Comparison by Sales Channel, 2025 to 2035
  • Figure 12: Global Market Attractiveness Analysis by Sales Channel
  • Figure 13: Global Market Value Share and BPS Analysis by Application, 2025 and 2035
  • Figure 14: Global Market Y-o-Y Growth Comparison by Application, 2025 to 2035
  • Figure 15: Global Market Attractiveness Analysis by Application
  • Figure 16: Global Market Value (USD Mn) Share and BPS Analysis by Region, 2025 and 2035
  • Figure 17: Global Market Y-o-Y Growth Comparison by Region, 2025 to 2035
  • Figure 18: Global Market Attractiveness Analysis by Region
  • Figure 19: North America Market Incremental $ Opportunity, 2025 to 2035
  • Figure 20: Latin America Market Incremental $ Opportunity, 2025 to 2035
  • Figure 21: Western Europe Market Incremental $ Opportunity, 2025 to 2035
  • Figure 22: East Asia Market Incremental $ Opportunity, 2025 to 2035
  • Figure 23: South Asia Pacific Market Incremental $ Opportunity, 2025 to 2035
  • Figure 24: Eastern Europe Market Incremental $ Opportunity, 2025 to 2035
  • Figure 25: Middle East & Africa Market Incremental $ Opportunity, 2025 to 2035
  • Figure 26: North America Market Value Share and BPS Analysis by Country, 2025 and 2035
  • Figure 27: North America Market Value Share and BPS Analysis by Type, 2025 and 2035
  • Figure 28: North America Market Y-o-Y Growth Comparison by Type, 2025 to 2035
  • Figure 29: North America Market Attractiveness Analysis by Type
  • Figure 30: North America Market Value Share and BPS Analysis by Buyer Type, 2025 and 2035
  • Figure 31: North America Market Y-o-Y Growth Comparison by Buyer Type, 2025 to 2035
  • Figure 32: North America Market Attractiveness Analysis by Buyer Type
  • Figure 33: North America Market Value Share and BPS Analysis by Sales Channel, 2025 and 2035
  • Figure 34: North America Market Y-o-Y Growth Comparison by Sales Channel, 2025 to 2035
  • Figure 35: North America Market Attractiveness Analysis by Sales Channel
  • Figure 36: North America Market Value Share and BPS Analysis by Application, 2025 and 2035
  • Figure 37: North America Market Y-o-Y Growth Comparison by Application, 2025 to 2035
  • Figure 38: North America Market Attractiveness Analysis by Application
  • Figure 39: Latin America Market Value Share and BPS Analysis by Country, 2025 and 2035
  • Figure 40: Latin America Market Value Share and BPS Analysis by Type, 2025 and 2035
  • Figure 41: Latin America Market Y-o-Y Growth Comparison by Type, 2025 to 2035
  • Figure 42: Latin America Market Attractiveness Analysis by Type
  • Figure 43: Latin America Market Value Share and BPS Analysis by Buyer Type, 2025 and 2035
  • Figure 44: Latin America Market Y-o-Y Growth Comparison by Buyer Type, 2025 to 2035
  • Figure 45: Latin America Market Attractiveness Analysis by Buyer Type
  • Figure 46: Latin America Market Value Share and BPS Analysis by Sales Channel, 2025 and 2035
  • Figure 47: Latin America Market Y-o-Y Growth Comparison by Sales Channel, 2025 to 2035
  • Figure 48: Latin America Market Attractiveness Analysis by Sales Channel
  • Figure 49: Latin America Market Value Share and BPS Analysis by Application, 2025 and 2035
  • Figure 50: Latin America Market Y-o-Y Growth Comparison by Application, 2025 to 2035
  • Figure 51: Latin America Market Attractiveness Analysis by Application
  • Figure 52: Western Europe Market Value Share and BPS Analysis by Country, 2025 and 2035
  • Figure 53: Western Europe Market Value Share and BPS Analysis by Type, 2025 and 2035
  • Figure 54: Western Europe Market Y-o-Y Growth Comparison by Type, 2025 to 2035
  • Figure 55: Western Europe Market Attractiveness Analysis by Type
  • Figure 56: Western Europe Market Value Share and BPS Analysis by Buyer Type, 2025 and 2035
  • Figure 57: Western Europe Market Y-o-Y Growth Comparison by Buyer Type, 2025 to 2035
  • Figure 58: Western Europe Market Attractiveness Analysis by Buyer Type
  • Figure 59: Western Europe Market Value Share and BPS Analysis by Sales Channel, 2025 and 2035
  • Figure 60: Western Europe Market Y-o-Y Growth Comparison by Sales Channel, 2025 to 2035
  • Figure 61: Western Europe Market Attractiveness Analysis by Sales Channel
  • Figure 62: Western Europe Market Value Share and BPS Analysis by Application, 2025 and 2035
  • Figure 63: Western Europe Market Y-o-Y Growth Comparison by Application, 2025 to 2035
  • Figure 64: Western Europe Market Attractiveness Analysis by Application
  • Figure 65: East Asia Market Value Share and BPS Analysis by Country, 2025 and 2035
  • Figure 66: East Asia Market Value Share and BPS Analysis by Type, 2025 and 2035
  • Figure 67: East Asia Market Y-o-Y Growth Comparison by Type, 2025 to 2035
  • Figure 68: East Asia Market Attractiveness Analysis by Type
  • Figure 69: East Asia Market Value Share and BPS Analysis by Buyer Type, 2025 and 2035
  • Figure 70: East Asia Market Y-o-Y Growth Comparison by Buyer Type, 2025 to 2035
  • Figure 71: East Asia Market Attractiveness Analysis by Buyer Type
  • Figure 72: East Asia Market Value Share and BPS Analysis by Sales Channel, 2025 and 2035
  • Figure 73: East Asia Market Y-o-Y Growth Comparison by Sales Channel, 2025 to 2035
  • Figure 74: East Asia Market Attractiveness Analysis by Sales Channel
  • Figure 75: East Asia Market Value Share and BPS Analysis by Application, 2025 and 2035
  • Figure 76: East Asia Market Y-o-Y Growth Comparison by Application, 2025 to 2035
  • Figure 77: East Asia Market Attractiveness Analysis by Application
  • Figure 78: South Asia Pacific Market Value Share and BPS Analysis by Country, 2025 and 2035
  • Figure 79: South Asia Pacific Market Value Share and BPS Analysis by Type, 2025 and 2035
  • Figure 80: South Asia Pacific Market Y-o-Y Growth Comparison by Type, 2025 to 2035
  • Figure 81: South Asia Pacific Market Attractiveness Analysis by Type
  • Figure 82: South Asia Pacific Market Value Share and BPS Analysis by Buyer Type, 2025 and 2035
  • Figure 83: South Asia Pacific Market Y-o-Y Growth Comparison by Buyer Type, 2025 to 2035
  • Figure 84: South Asia Pacific Market Attractiveness Analysis by Buyer Type
  • Figure 85: South Asia Pacific Market Value Share and BPS Analysis by Sales Channel, 2025 and 2035
  • Figure 86: South Asia Pacific Market Y-o-Y Growth Comparison by Sales Channel, 2025 to 2035
  • Figure 87: South Asia Pacific Market Attractiveness Analysis by Sales Channel
  • Figure 88: South Asia Pacific Market Value Share and BPS Analysis by Application, 2025 and 2035
  • Figure 89: South Asia Pacific Market Y-o-Y Growth Comparison by Application, 2025 to 2035
  • Figure 90: South Asia Pacific Market Attractiveness Analysis by Application
  • Figure 91: Eastern Europe Market Value Share and BPS Analysis by Country, 2025 and 2035
  • Figure 92: Eastern Europe Market Value Share and BPS Analysis by Type, 2025 and 2035
  • Figure 93: Eastern Europe Market Y-o-Y Growth Comparison by Type, 2025 to 2035
  • Figure 94: Eastern Europe Market Attractiveness Analysis by Type
  • Figure 95: Eastern Europe Market Value Share and BPS Analysis by Buyer Type, 2025 and 2035
  • Figure 96: Eastern Europe Market Y-o-Y Growth Comparison by Buyer Type, 2025 to 2035
  • Figure 97: Eastern Europe Market Attractiveness Analysis by Buyer Type
  • Figure 98: Eastern Europe Market Value Share and BPS Analysis by Sales Channel, 2025 and 2035
  • Figure 99: Eastern Europe Market Y-o-Y Growth Comparison by Sales Channel, 2025 to 2035
  • Figure 100: Eastern Europe Market Attractiveness Analysis by Sales Channel
  • Figure 101: Eastern Europe Market Value Share and BPS Analysis by Application, 2025 and 2035
  • Figure 102: Eastern Europe Market Y-o-Y Growth Comparison by Application, 2025 to 2035
  • Figure 103: Eastern Europe Market Attractiveness Analysis by Application
  • Figure 104: Middle East & Africa Market Value Share and BPS Analysis by Country, 2025 and 2035
  • Figure 105: Middle East & Africa Market Value Share and BPS Analysis by Type, 2025 and 2035
  • Figure 106: Middle East & Africa Market Y-o-Y Growth Comparison by Type, 2025 to 2035
  • Figure 107: Middle East & Africa Market Attractiveness Analysis by Type
  • Figure 108: Middle East & Africa Market Value Share and BPS Analysis by Buyer Type, 2025 and 2035
  • Figure 109: Middle East & Africa Market Y-o-Y Growth Comparison by Buyer Type, 2025 to 2035
  • Figure 110: Middle East & Africa Market Attractiveness Analysis by Buyer Type
  • Figure 111: Middle East & Africa Market Value Share and BPS Analysis by Sales Channel, 2025 and 2035
  • Figure 112: Middle East & Africa Market Y-o-Y Growth Comparison by Sales Channel, 2025 to 2035
  • Figure 113: Middle East & Africa Market Attractiveness Analysis by Sales Channel
  • Figure 114: Middle East & Africa Market Value Share and BPS Analysis by Application, 2025 and 2035
  • Figure 115: Middle East & Africa Market Y-o-Y Growth Comparison by Application, 2025 to 2035
  • Figure 116: Middle East & Africa Market Attractiveness Analysis by Application
  • Figure 117: Global Market - Tier Structure Analysis
  • Figure 118: Global Market - Company Share Analysis

- FAQs -

What was the global bodyboard market size reported by Fact.MR for 2025?

The global bodyboard market was valued at USD 317 million in 2025.

Who are the major players operating in the bodyboard market?

Prominent players in the market are Ballistic Boards, CustomX, Alder Sportswear Ltd., Catch Surfboard Co., Hubboards and others.

What is the estimated valuation of the bodyboard market in 2035?

The market is expected to reach a valuation of USD 623.6 million in 2035.

What value CAGR did the bodyboard market exhibit over the last five years?

The historic growth rate of the bodyboard market was 6.5% from 2020 to 2024.

- Also of Interest -

Sports Compression Clothing Market

Sports Compression Clothing Market Analysis, By Product Type, By Activity (Cycling, Road Running, Trail Running, and Others), By Sales Channel, and Region - Market Insights 2025 to 2035

Rugby Protective Gears Market

Rugby Protective Gears Market Analysis, By Gear type (Mouth Guard, Headgear, Protection Vests, Gloves), By Sales Channels, By Buyer Type, and Region - Market Insights 2025 to 2035

Rock Sport Protection Products Market

Rock Sport Protection Products Market Analysis, By Product Type (Helmet, Climbing Shoes, Belay Gloves, Nuts, Hexes, Camming devices, Tricams), By Sales Channels, By Buyer Type, and Region - Market Insights 2025 to 2035

Smart Sports Textile Market

Smart Sports Textile Market Study by Apparel and Footwear with Actuators, Microcontrollers, and Sensors From 2025 to 2035

Bodyboard Market

Schedule a Call