Sports Compression Clothing Market

Sports Compression Clothing Market Analysis, By Product Type, By Activity (Cycling, Road Running, Trail Running, and Others), By Sales Channel, and Region - Market Insights 2025 to 2035

The Shirts segment projected to grow at a CAGR of 7.1%, whereas another segment Sleeves is likely to grow at 9.0%. In terms of countries, U.S. is projected to grow at 8.0%, followed by Germany at 9.1% and China to grow at 10.0%.

Sports Compression Clothing Market Outlook (2025 to 2035)

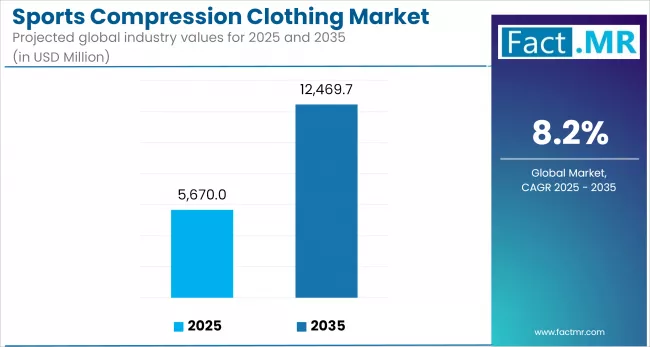
The global sports compression clothing market is expected to reach USD 12,470 million by 2035, up from USD 5,279 million in 2024. During the forecast period (2025 to 2035), the industry is projected to grow at a CAGR of 8.2%, driven by rising health consciousness, increased sports participation, advanced fabric innovations, influencer marketing, and expanding eCommerce capabilities.

Sports Compression Clothing Market

What are the drivers of sports compression clothing market?

An increase in the world health, fitness, and performance improvement market boosts the sports compression clothing industry. The growth of student and professional sports, along with an increase in the number of people joining gyms, is creating pressure on the demand for performance-enhancing clothing.

There are also further fabric developments, such as moisture-wicking, anti-bacterial, and heat-regulating fabrics, which add value to manufacturers. Brand awareness and consumer interaction are also being boosted by celebrity endorsements and the adoption of health and fitness techniques as advocated by influencers on social media platforms.

The other main driver is the consciousness of injury prevention and rapid recovery, particularly among elderly fitness demographics. E-commerce is additionally expanding, and the sales are expected to increase exponentially with the implementation of virtual try-ons and customization. New technologies, such as seamless garment construction and body-mapped zones of compression, are among the ways to distinguish high-end products in a congested market.

What are the regional trends of sports compression clothing market?

The North American region dominates the sports compression clothing market, driven by high rates of active sports participation, a robust sports association, and very high consumer demand for quality sports clothing. Compression gear is the norm in the U.S., where significant investments in sports science and the optimization of elite athletes' performance are a common trend.

In Europe, other nations, such as Germany, the UK, and France, are experiencing strong growth due to the increasing interest in running, cycling, and triathlon. The demand in the region for more functional and fashionable compression wear has driven the technical requirements market.

The Asia Pacific region is on track to become the most rapidly developing one, experiencing an increasing trend in sports attendance and the growing popularity of gym culture in China, India, Japan, and South Korea.

There are also niche development opportunities in Australia and Brazil, as they offer an active lifestyle and robust sports infrastructure. In the meantime, Middle East markets, such as the UAE and Saudi Arabia, are catching up as people become more conscious of their health and government-initiated measures promote fitness.

What are the challenges and restraining factors of sports compression clothing market?

The market for sports compression clothing has several limitations, despite its consistent growth. The major factors are the high pricing of premium compression sets, as people are price-conscious, particularly in countries where prices are sensitive. Consumers can choose lower prices and simple sports attire that provides no compression functions.

The absence of uniform claims and scientific evidence of performance-enhancing effects fosters cynicism among users. Other sportsmen challenge the physical advantage of compression gear, other than a sense of comfort and good appearance.

There are also a large number of players with similar-looking products flooding the market, which makes the price wars intense and brand differentiation increasingly weak. Consumers lose trust through counterfeit and low-quality product,s especially online.

Environmental issues related to Synthetic fibers, such as polyester and spandex, used in compression wear, are driving a shift towards sustainable solutions. However, scaling up affordable, eco-friendly options is a challenge that most brands cannot afford to undertake. Finally, penetrating cold areas is restrained by thermal discomfort and insufficient development of sports infrastructure in some emerging economies.

Country-Wise Outlook

Elite Performance Backed by Innovation and Regulation

Sports Compression Clothing Market Country Wise Analysis Of CAGR 2025 2035

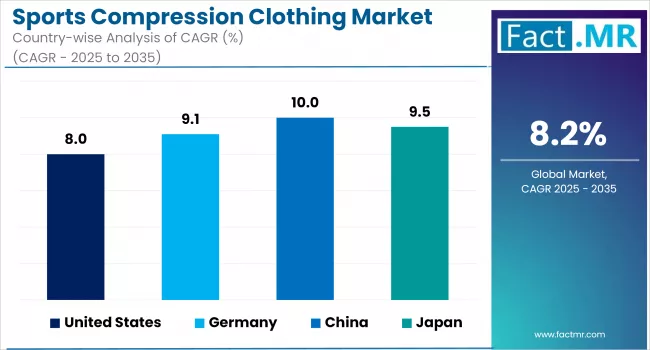
The sports compression clothing market is dominated by the United States, primarily due to a well-established fitness culture, professional sporting facilities, and increasing adoption among amateur athletes. The high demand for such performance gear can be attributed to the rise in popularity of CrossFit, marathons, and sports played at the collegiate level.

The technological front is a major area of interest, as most leading brands are incorporating moisture-wicking fabric, zoned graduated compression, and smart clothes with in-built sensors to monitor muscle recovery. The quality and compliance of medical-grade variants applied to wounds during the recovery process are ensured by regulatory control, which the FDA and ASTM provide. U.S.-based companies are also leveraging direct-to-consumer (DTC) e-commerce and branding through influencers to enhance domestic expansion.

Germany’s Science-Led Approach to Compression Excellence

Germany is a European leader in the sports compression garment industry, supported by its long tradition in medical textiles and a robust high-performance sports science infrastructure. The compression gear has been clinically proven in the country as particularly advantageous in rehabilitation and long-distance athletic pursuits, therefore forcing its use in football, cycling and athletics.

German manufacturers focus on medical-grade compression (Class I & II) and biomechanical accuracy. Organizations such as the German Sport University Cologne are going out of their way to collaborate with clothing companies in testing efficiency and durability. The heavy application of antibacterial, breathable materials and seamless knitting technology symbolizes a trend to ergonomic and skin-friendly equipment. Sport is not the only area that benefits from hybrid application enhancements through public healthcare endorsements of therapeutic compression garments.

China Blends Mass Fitness with High-Tech Compression Manufacturing

China is not only becoming a manufacturing center but also a significant consumer market for sports compression wear. It is driven by domestic demand stimulated by the government's Healthy China 2030 initiative and the increased consideration of fitness among the middle classes. Gym-goers, urban runners, and basketball enthusiasts are using compression garments, particularly on their muscles.

Chinese companies are investing in automated circular knitting equipment and 3D body scans to increase production scale and achieve precision fit. The introduction of wearables, such as biomonitoring in compression sleeves, is starting to emerge at higher-tier levels. The country's powerful e-commerce channels enable aggressive expansion in Tier 2 and Tier 3 cities. Consumer trust and trial are also expedited through strategic partnerships with sports KOLs (key opinion leaders).


Category-Wise Analysis

Shirts dominate as the go-to compression gear for performance and recovery

Sports Compression Clothing Market Analysis By Product Type

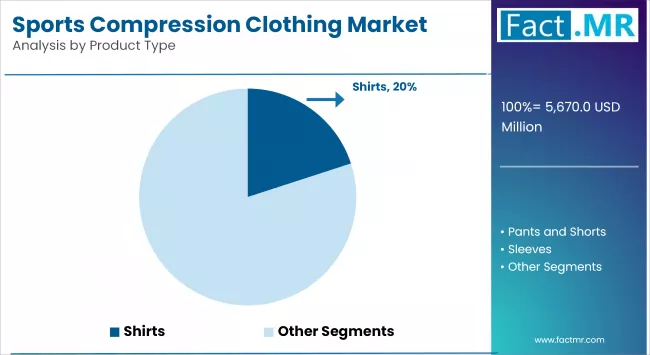
The type of product leading the market is compression shirts, as they have gained widespread application among both professional and amateur athletes. Such clothes provide muscular support, enhance circulation, and aid in recovery after exercise, thereby reducing muscle oscillation and fatigue.

Improvements in fabric technology, including moisture-wicking properties, antimicrobial treatments, and seamless designs, provide greater comfort and enhanced performance. Shirts offer an example of a high-volume category in retailing and online compression products, as they are often the entry point for consumers venturing into compression.

Cycling drives demand for targeted compression apparel

Sports Compression Clothing Market Analysis By Activity

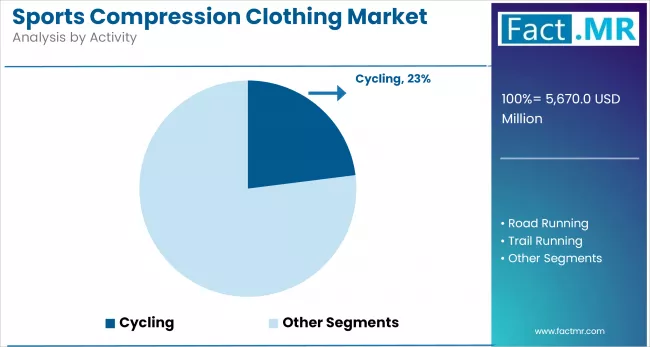
Regardless of the numerous activities, cycling is primarily considered a significant force behind specialized compression wear. The compression apparel worn by cyclists helps them endure long rides by aiding blood flow to the legs and core, and thus helps, to some extent, in diminishing lactic acid build-up.

With a growing interest in cycling, whether as a sport or a means of recreation, especially in Europe and North America, the demand for engineered compression shirts, bibs, and sleeves made for aerodynamic performance is on the rise. The use of innovative new lightweight and breathable textile fabrics could further facilitate uptake in hot-weather conditions.

Sports variety stores anchor offline sales with expert-led buying experiences

Sports variety stores remain a crucial sales channel, offering consumers the ability to physically evaluate fit, fabric, and functionality vital factors in performance apparel like compression clothing. These retail outlets often offer expert guidance, a wide variety of brands, and loyalty programs, making them attractive to both beginners and seasoned athletes.

The presence of trained staff and in-store trial options helps build consumer trust, especially for premium-priced compression shirts. As e-commerce continues to grow, brick-and-mortar sports stores remain a vital part of product discovery and brand positioning.


Competitive Analysis

The compression wear market for sports is characterized as moderately competitive, with firms focusing on performance enhancement, product differentiation, and effective distribution strategies.

Thus, innovations in fabric technology, such as graduated compression, moisture-wicking, and thermal regulation, should be the core focus to get attention in this market. Most competitors are designing sports-specific apparel to enhance athletes' performance and reduce muscle fatigue.

Digital engagement is vital, whereby brands use social media marketing, athlete endorsements, and fitness influencers to generate consumer interest. E-commerce has emerged as a big sales channel with retail stores and specialty sports outlets still playing a significant role in product experience delivery.

The market is slowly expanding from serving athletes also to include fitness enthusiasts and consumers focused on wellbeing. This change pushed many businesses to develop everyday compression apparel that combines functionality and style. Athleisure, in particular, has blurred the lines between performance and fashion, creating a new front in the competition.

Sustainability is increasing as a form of differentiation, with environment-friendly materials and ethical sourcing gaining traction among consumers. Furthermore, distinct customer loyalty is reinforced through personalized services, wearable tech integration, and targeted product suggestions, to deepen the relationship between consumers and brands in an oversaturated market.

Key players in the sports compression clothing industry include Vim & Vigr, CW X, Under Armor, Nike Inc., VIRUS Performance, MudGear, Zensah, Pacterra Athletics, Brooks Sports Inc., WOLACO, 2XU, Asics, Adidas AG, and other players.

Recent Development

  • In March 2025, Lululemon announced a multi-year collaboration with biotechnology company ZymoChem to develop and scale the use of bio-based nylon. This partnership focuses on creating sustainable alternatives to traditional nylon, aligning with Lululemon's environmental objectives and commitment to sustainable innovation.
  • In April 2024, Under Armour continues to integrate its UA RUSH™ technology into performance apparel. This infrared technology reflects the body's energy, helping athletes work harder and recover faster. Notably, elite marathoner Sharon Lokedi wore the UA Pro Runner Crop Top featuring UA RUSH™ during a major race in April 2024.

Fact.MR has provided detailed information about the price points of key manufacturers of the Sports Compression Clothing Market positioned across regions, sales growth, production capacity, and speculative technological expansion, in the recently published report.

Methodology and Industry Tracking Approach

In 2025, Fact.MR surveyed approximately 4,250 registered stakeholders concerning sports compression clothing across 21 countries. The survey, which concluded in October 2020, targeted input from at least 100 expert respondents per nation, including elite sports physiologists, textile technologists, and innovators in smart wearables and sustainable performance fabrics. Key verticals represented included recovery-focused compression zoning, thermoregulation textiles, and hybrid designs for competitive and recreational athletes.

Among notable trends tracked between June 2024 and May 2025 were the rapid adoption of biodegradable compression fabrics, AI-enabled fit personalization apps, and seamless compression wear integrated with biometric sensors. Emerging models such as athlete-to-athlete resale platforms and circular textile recovery programs are also gaining traction. Regions such as Europe and East Asia are driving the shift toward energy-efficient garment production and tech-integrated performance apparel.

Fact.MR has monitored this ecosystem since 2018, with focus areas including fiber elasticity retention, compression performance ratings, and dual-layered sports and medical applications. Recent industry intersections include modular apparel construction, dynamic compression response for varying training loads, and next-gen UV-protective yarns aligned with athlete sustainability and longevity goals.

Segmentation of Sports compression clothing market

  • By Product Type :

    • Shirts
    • Pants and Shorts
    • Sleeves
    • Socks
    • Tops
    • Others Clothing Types
  • By Activity :

    • Cycling
    • Road Running
    • Trail Running
    • Triathlon
    • Other Activities
  • By Sales Channel :

    • Sports Variety Stores
    • Franchise Sports Stores
    • Online Retail
    • Other Sales Channels
  • By Region :

    • North America
    • Latin America
    • Western Europe
    • Eastern Europe
    • East Asia
    • South Asia & Pacific
    • Middle East & Africa

Table of Content

  1. Executive Summary
    • Global Market Outlook
    • Demand-side Trends
    • Supply-side Trends
    • Technology Roadmap Analysis
    • Analysis and Recommendations
  2. Market Overview
    • Market Coverage / Taxonomy
    • Market Definition / Scope / Limitations
  3. Market Background
    • Market Dynamics
      • Drivers
      • Restraints
      • Opportunity
      • Trends
    • Scenario Forecast
      • Demand in Optimistic Scenario
      • Demand in Likely Scenario
      • Demand in Conservative Scenario
    • Opportunity Map Analysis
    • Product Life Cycle Analysis
    • Supply Chain Analysis
      • Supply Side Participants and their Roles
        • Producers
        • Mid-Level Participants (Traders/ Agents/ Brokers)
        • Wholesalers and Distributors
      • Value Added and Value Created at Node in the Supply Chain
      • List of Raw Material Suppliers
      • List of Existing and Potential Buyers
    • Investment Feasibility Matrix
    • Value Chain Analysis
      • Profit Margin Analysis
      • Wholesalers and Distributors
      • Retailers
    • PESTLE and Porter’s Analysis
    • Regulatory Landscape
      • By Key Regions
      • By Key Countries
    • Production and Consumption Statistics
    • Import and Export Statistics
  4. Global Market Analysis 2020 to 2024 and Forecast, 2025 to 2035
    • Historical Market Size Value (USD Mn) & Volume (Units) Analysis, 2020 to 2024
    • Current and Future Market Size Value (USD Mn) & Volume (Units) Projections, 2025 to 2035
      • Y-o-Y Growth Trend Analysis
      • Absolute $ Opportunity Analysis
  5. Global Market Pricing Analysis 2020 to 2024 and Forecast 2025 to 2035
  6. Global Market Analysis 2020 to 2024 and Forecast 2025 to 2035, By Product Type
    • Introduction / Key Findings
    • Historical Market Size Value (USD Mn) & Volume (Units) Analysis By Product Type, 2020 to 2024
    • Current and Future Market Size Value (USD Mn) & Volume (Units) Analysis and Forecast By Product Type, 2025 to 2035
      • Shirts
      • Pants and Shorts
      • Sleeves
      • Socks
      • Tops
      • Others Clothing Types
    • Y-o-Y Growth Trend Analysis By Product Type, 2020 to 2024
    • Absolute $ Opportunity Analysis By Product Type, 2025 to 2035
  7. Global Market Analysis 2020 to 2024 and Forecast 2025 to 2035, By Activity
    • Introduction / Key Findings
    • Historical Market Size Value (USD Mn) & Volume (Units) Analysis By Activity, 2020 to 2024
    • Current and Future Market Size Value (USD Mn) & Volume (Units) Analysis and Forecast By Activity, 2025 to 2035
      • Cycling
      • Road Running
      • Trail Running
      • Triathlon
      • Other Activities
    • Y-o-Y Growth Trend Analysis By Activity, 2020 to 2024
    • Absolute $ Opportunity Analysis By Activity, 2025 to 2035
  8. Global Market Analysis 2020 to 2024 and Forecast 2025 to 2035, By Sales Channel
    • Introduction / Key Findings
    • Historical Market Size Value (USD Mn) & Volume (Units) Analysis By Sales Channel, 2020 to 2024
    • Current and Future Market Size Value (USD Mn) & Volume (Units) Analysis and Forecast By Sales Channel, 2025 to 2035
      • Sports Variety Stores
      • Franchise Sports Stores
      • Online Retail
      • Other Sales Channels
    • Y-o-Y Growth Trend Analysis By Sales Channel, 2020 to 2024
    • Absolute $ Opportunity Analysis By Sales Channel, 2025 to 2035
  9. Global Market Analysis 2020 to 2024 and Forecast 2025 to 2035, By Region
    • Introduction
    • Historical Market Size Value (USD Mn) & Volume (Units) Analysis By Region, 2020 to 2024
    • Current Market Size Value (USD Mn) & Volume (Units) Analysis and Forecast By Region, 2025 to 2035
      • North America
      • Latin America
      • Europe
      • East Asia
      • South Asia
      • Oceania
      • MEA
    • Market Attractiveness Analysis By Region
  10. North America Market Analysis 2020 to 2024 and Forecast 2025 to 2035, By Country
    • Historical Market Size Value (USD Mn) & Volume (Units) Trend Analysis By Market Taxonomy, 2020 to 2024
    • Market Size Value (USD Mn) & Volume (Units) Forecast By Market Taxonomy, 2025 to 2035
      • By Country
        • U.S.
        • Canada
      • By Product Type
      • By Activity
      • By Sales Channel
    • Market Attractiveness Analysis
      • By Country
      • By Product Type
      • By Activity
      • By Sales Channel
    • Key Takeaways
  11. Latin America Market Analysis 2020 to 2024 and Forecast 2025 to 2035, By Country
    • Historical Market Size Value (USD Mn) & Volume (Units) Trend Analysis By Market Taxonomy, 2020 to 2024
    • Market Size Value (USD Mn) & Volume (Units) Forecast By Market Taxonomy, 2025 to 2035
      • By Country
        • Brazil
        • Mexico
        • Argentina
        • Chile
        • Peru
        • Rest of Latin America
      • By Product Type
      • By Activity
      • By Sales Channel
    • Market Attractiveness Analysis
      • By Country
      • By Product Type
      • By Activity
      • By Sales Channel
    • Key Takeaways
  12. Europe Market Analysis 2020 to 2024 and Forecast 2025 to 2035, By Country
    • Historical Market Size Value (USD Mn) & Volume (Units) Trend Analysis By Market Taxonomy, 2020 to 2024
    • Market Size Value (USD Mn) & Volume (Units) Forecast By Market Taxonomy, 2025 to 2035
      • By Country
        • Germany
        • Italy
        • France
        • U.K.
        • Spain
        • Russia
        • BENELUX
        • Rest of Europe
      • By Product Type
      • By Activity
      • By Sales Channel
    • Market Attractiveness Analysis
      • By Country
      • By Product Type
      • By Activity
      • By Sales Channel
    • Key Takeaways
  13. East Asia Market Analysis 2020 to 2024 and Forecast 2025 to 2035, By Country
    • Historical Market Size Value (USD Mn) & Volume (Units) Trend Analysis By Market Taxonomy, 2020 to 2024
    • Market Size Value (USD Mn) & Volume (Units) Forecast By Market Taxonomy, 2025 to 2035
      • By Country
        • China
        • Japan
        • South Korea
      • By Product Type
      • By Activity
      • By Sales Channel
    • Market Attractiveness Analysis
      • By Country
      • By Product Type
      • By Activity
      • By Sales Channel
    • Key Takeaways
  14. South Asia Market Analysis 2020 to 2024 and Forecast 2025 to 2035, By Country
    • Historical Market Size Value (USD Mn) & Volume (Units) Trend Analysis By Market Taxonomy, 2020 to 2024
    • Market Size Value (USD Mn) & Volume (Units) Forecast By Market Taxonomy, 2025 to 2035
      • By Country
        • India
        • Thailand
        • Malaysia
        • Indonesia
        • Rest of South Asia
      • By Product Type
      • By Activity
      • By Sales Channel
    • Market Attractiveness Analysis
      • By Country
      • By Product Type
      • By Activity
      • By Sales Channel
    • Key Takeaways
  15. Oceania Market Analysis 2020 to 2024 and Forecast 2025 to 2035, By Country
    • Historical Market Size Value (USD Mn) & Volume (Units) Trend Analysis By Market Taxonomy, 2020 to 2024
    • Market Size Value (USD Mn) & Volume (Units) Forecast By Market Taxonomy, 2025 to 2035
      • By Country
        • Australia
        • New Zealand
      • By Product Type
      • By Activity
      • By Sales Channel
    • Market Attractiveness Analysis
      • By Country
      • By Product Type
      • By Activity
      • By Sales Channel
    • Key Takeaways
  16. MEA Market Analysis 2020 to 2024 and Forecast 2025 to 2035, By Country
    • Historical Market Size Value (USD Mn) & Volume (Units) Trend Analysis By Market Taxonomy, 2020 to 2024
    • Market Size Value (USD Mn) & Volume (Units) Forecast By Market Taxonomy, 2025 to 2035
      • By Country
        • GCC
        • Rest of MEA
      • By Product Type
      • By Activity
      • By Sales Channel
    • Market Attractiveness Analysis
      • By Country
      • By Product Type
      • By Activity
      • By Sales Channel
    • Key Takeaways
  17. Key Countries Market Analysis
    • Value (USD Mn) & Volume (Units)ed States
      • Pricing Analysis
      • Market Share Analysis, 2024
        • By Product Type
        • By Activity
        • By Sales Channel
    • Germany
      • Pricing Analysis
      • Market Share Analysis, 2024
        • By Product Type
        • By Activity
        • By Sales Channel
    • China
      • Pricing Analysis
      • Market Share Analysis, 2024
        • By Product Type
        • By Activity
        • By Sales Channel
    • France
      • Pricing Analysis
      • Market Share Analysis, 2024
        • By Product Type
        • By Activity
        • By Sales Channel
  18. Market Structure Analysis
    • Competition Dashboard
    • Competition Benchmarking
    • Market Share Analysis of Top Players
      • By Regional
      • By Product Type
      • By Activity
      • By Sales Channel
  19. Competition Analysis
    • Competition Deep Dive
      • Vim & Vigr
        • Overview
        • Product Portfolio
        • Profitability by Market Segments (Product/Age /Sales Channel/Region)
        • Sales Footprint
        • Strategy Overview
          • Marketing Strategy
          • Product Strategy
          • Channel Strategy
      • CW X
        • Overview
        • Product Portfolio
        • Profitability by Market Segments (Product/Age /Sales Channel/Region)
        • Sales Footprint
        • Strategy Overview
          • Marketing Strategy
          • Product Strategy
          • Channel Strategy
      • Under Armor
        • Overview
        • Product Portfolio
        • Profitability by Market Segments (Product/Age /Sales Channel/Region)
        • Sales Footprint
        • Strategy Overview
          • Marketing Strategy
          • Product Strategy
          • Channel Strategy
      • Nike Inc.
        • Overview
        • Product Portfolio
        • Profitability by Market Segments (Product/Age /Sales Channel/Region)
        • Sales Footprint
        • Strategy Overview
          • Marketing Strategy
          • Product Strategy
          • Channel Strategy
      • VIRUS Performance
        • Overview
        • Product Portfolio
        • Profitability by Market Segments (Product/Age /Sales Channel/Region)
        • Sales Footprint
        • Strategy Overview
          • Marketing Strategy
          • Product Strategy
          • Channel Strategy
      • MudGear
        • Overview
        • Product Portfolio
        • Profitability by Market Segments (Product/Age /Sales Channel/Region)
        • Sales Footprint
        • Strategy Overview
          • Marketing Strategy
          • Product Strategy
          • Channel Strategy
      • Zensah
        • Overview
        • Product Portfolio
        • Profitability by Market Segments (Product/Age /Sales Channel/Region)
        • Sales Footprint
        • Strategy Overview
          • Marketing Strategy
          • Product Strategy
          • Channel Strategy
      • Pacterra Athletics
        • Overview
        • Product Portfolio
        • Profitability by Market Segments (Product/Age /Sales Channel/Region)
        • Sales Footprint
        • Strategy Overview
          • Marketing Strategy
          • Product Strategy
          • Channel Strategy
      • Brooks Sports Inc.
        • Overview
        • Product Portfolio
        • Profitability by Market Segments (Product/Age /Sales Channel/Region)
        • Sales Footprint
        • Strategy Overview
          • Marketing Strategy
          • Product Strategy
          • Channel Strategy
      • WOLACO
        • Overview
        • Product Portfolio
        • Profitability by Market Segments (Product/Age /Sales Channel/Region)
        • Sales Footprint
        • Strategy Overview
          • Marketing Strategy
          • Product Strategy
          • Channel Strategy
      • 2XU
        • Overview
        • Product Portfolio
        • Profitability by Market Segments (Product/Age /Sales Channel/Region)
        • Sales Footprint
        • Strategy Overview
          • Marketing Strategy
          • Product Strategy
          • Channel Strategy
      • Asics
        • Overview
        • Product Portfolio
        • Profitability by Market Segments (Product/Age /Sales Channel/Region)
        • Sales Footprint
        • Strategy Overview
          • Marketing Strategy
          • Product Strategy
          • Channel Strategy
      • Adidas AG
        • Overview
        • Product Portfolio
        • Profitability by Market Segments (Product/Age /Sales Channel/Region)
        • Sales Footprint
        • Strategy Overview
          • Marketing Strategy
          • Product Strategy
          • Channel Strategy
  20. Assumptions & Acronyms Used
  21. Research Methodology

List Of Table

  • Table 1: Global Market Value (USD Mn) Forecast by Region, 2020 to 2035
  • Table 2: Global Market Volume (Units) Forecast by Region, 2020 to 2035
  • Table 3: Global Market Value (USD Mn) Forecast by Product Type, 2020 to 2035
  • Table 4: Global Market Volume (Units) Forecast by Product Type, 2020 to 2035
  • Table 5: Global Market Value (USD Mn) Forecast by Activity, 2020 to 2035
  • Table 6: Global Market Volume (Units) Forecast by Activity, 2020 to 2035
  • Table 7: Global Market Value (USD Mn) Forecast by Sales Channel, 2020 to 2035
  • Table 8: Global Market Volume (Units) Forecast by Sales Channel, 2020 to 2035
  • Table 9: North America Market Value (USD Mn) Forecast by Country, 2020 to 2035
  • Table 10: North America Market Volume (Units) Forecast by Country, 2020 to 2035
  • Table 11: North America Market Value (USD Mn) Forecast by Product Type, 2020 to 2035
  • Table 12: North America Market Volume (Units) Forecast by Product Type, 2020 to 2035
  • Table 13: North America Market Value (USD Mn) Forecast by Activity, 2020 to 2035
  • Table 14: North America Market Volume (Units) Forecast by Activity, 2020 to 2035
  • Table 15: North America Market Value (USD Mn) Forecast by Sales Channel, 2020 to 2035
  • Table 16: North America Market Volume (Units) Forecast by Sales Channel, 2020 to 2035
  • Table 17: Latin America Market Value (USD Mn) Forecast by Country, 2020 to 2035
  • Table 18: Latin America Market Volume (Units) Forecast by Country, 2020 to 2035
  • Table 19: Latin America Market Value (USD Mn) Forecast by Product Type, 2020 to 2035
  • Table 20: Latin America Market Volume (Units) Forecast by Product Type, 2020 to 2035
  • Table 21: Latin America Market Value (USD Mn) Forecast by Activity, 2020 to 2035
  • Table 22: Latin America Market Volume (Units) Forecast by Activity, 2020 to 2035
  • Table 23: Latin America Market Value (USD Mn) Forecast by Sales Channel, 2020 to 2035
  • Table 24: Latin America Market Volume (Units) Forecast by Sales Channel, 2020 to 2035
  • Table 25: Europe Market Value (USD Mn) Forecast by Country, 2020 to 2035
  • Table 26: Europe Market Volume (Units) Forecast by Country, 2020 to 2035
  • Table 27: Europe Market Value (USD Mn) Forecast by Product Type, 2020 to 2035
  • Table 28: Europe Market Volume (Units) Forecast by Product Type, 2020 to 2035
  • Table 29: Europe Market Value (USD Mn) Forecast by Activity, 2020 to 2035
  • Table 30: Europe Market Volume (Units) Forecast by Activity, 2020 to 2035
  • Table 31: Europe Market Value (USD Mn) Forecast by Sales Channel, 2020 to 2035
  • Table 32: Europe Market Volume (Units) Forecast by Sales Channel, 2020 to 2035
  • Table 33: East Asia Market Value (USD Mn) Forecast by Country, 2020 to 2035
  • Table 34: East Asia Market Volume (Units) Forecast by Country, 2020 to 2035
  • Table 35: East Asia Market Value (USD Mn) Forecast by Product Type, 2020 to 2035
  • Table 36: East Asia Market Volume (Units) Forecast by Product Type, 2020 to 2035
  • Table 37: East Asia Market Value (USD Mn) Forecast by Activity, 2020 to 2035
  • Table 38: East Asia Market Volume (Units) Forecast by Activity, 2020 to 2035
  • Table 39: East Asia Market Value (USD Mn) Forecast by Sales Channel, 2020 to 2035
  • Table 40: East Asia Market Volume (Units) Forecast by Sales Channel, 2020 to 2035
  • Table 41: South Asia Market Value (USD Mn) Forecast by Country, 2020 to 2035
  • Table 42: South Asia Market Volume (Units) Forecast by Country, 2020 to 2035
  • Table 43: South Asia Market Value (USD Mn) Forecast by Product Type, 2020 to 2035
  • Table 44: South Asia Market Volume (Units) Forecast by Product Type, 2020 to 2035
  • Table 45: South Asia Market Value (USD Mn) Forecast by Activity, 2020 to 2035
  • Table 46: South Asia Market Volume (Units) Forecast by Activity, 2020 to 2035
  • Table 47: South Asia Market Value (USD Mn) Forecast by Sales Channel, 2020 to 2035
  • Table 48: South Asia Market Volume (Units) Forecast by Sales Channel, 2020 to 2035
  • Table 49: Oceania Market Value (USD Mn) Forecast by Country, 2020 to 2035
  • Table 50: Oceania Market Volume (Units) Forecast by Country, 2020 to 2035
  • Table 51: Oceania Market Value (USD Mn) Forecast by Product Type, 2020 to 2035
  • Table 52: Oceania Market Volume (Units) Forecast by Product Type, 2020 to 2035
  • Table 53: Oceania Market Value (USD Mn) Forecast by Activity, 2020 to 2035
  • Table 54: Oceania Market Volume (Units) Forecast by Activity, 2020 to 2035
  • Table 55: Oceania Market Value (USD Mn) Forecast by Sales Channel, 2020 to 2035
  • Table 56: Oceania Market Volume (Units) Forecast by Sales Channel, 2020 to 2035
  • Table 57: MEA Market Value (USD Mn) Forecast by Country, 2020 to 2035
  • Table 58: MEA Market Volume (Units) Forecast by Country, 2020 to 2035
  • Table 59: MEA Market Value (USD Mn) Forecast by Product Type, 2020 to 2035
  • Table 60: MEA Market Volume (Units) Forecast by Product Type, 2020 to 2035
  • Table 61: MEA Market Value (USD Mn) Forecast by Activity, 2020 to 2035
  • Table 62: MEA Market Volume (Units) Forecast by Activity, 2020 to 2035
  • Table 63: MEA Market Value (USD Mn) Forecast by Sales Channel, 2020 to 2035
  • Table 64: MEA Market Volume (Units) Forecast by Sales Channel, 2020 to 2035

List Of Figures

  • Figure 1: Global Market Volume (Units) Forecast 2020 to 2035
  • Figure 2: Global Market Pricing Analysis
  • Figure 3: Global Market Value (USD Mn) Forecast 2020 to 2035
  • Figure 4: Global Market Value Share and BPS Analysis by Product Type, 2025 and 2035
  • Figure 5: Global Market Y-o-Y Growth Comparison by Product Type, 2025 to 2035
  • Figure 6: Global Market Attractiveness Analysis by Product Type
  • Figure 7: Global Market Value Share and BPS Analysis by Activity, 2025 and 2035
  • Figure 8: Global Market Y-o-Y Growth Comparison by Activity, 2025 to 2035
  • Figure 9: Global Market Attractiveness Analysis by Activity
  • Figure 10: Global Market Value Share and BPS Analysis by Sales Channel, 2025 and 2035
  • Figure 11: Global Market Y-o-Y Growth Comparison by Sales Channel, 2025 to 2035
  • Figure 12: Global Market Attractiveness Analysis by Sales Channel
  • Figure 13: Global Market Value (USD Mn) Share and BPS Analysis by Region, 2025 and 2035
  • Figure 14: Global Market Y-o-Y Growth Comparison by Region, 2025 to 2035
  • Figure 15: Global Market Attractiveness Analysis by Region
  • Figure 16: North America Market Incremental $ Opportunity, 2025 to 2035
  • Figure 17: Latin America Market Incremental $ Opportunity, 2025 to 2035
  • Figure 18: Europe Market Incremental $ Opportunity, 2025 to 2035
  • Figure 19: East Asia Market Incremental $ Opportunity, 2025 to 2035
  • Figure 20: South Asia Market Incremental $ Opportunity, 2025 to 2035
  • Figure 21: Oceania Market Incremental $ Opportunity, 2025 to 2035
  • Figure 22: MEA Market Incremental $ Opportunity, 2025 to 2035
  • Figure 23: North America Market Value Share and BPS Analysis by Country, 2025 and 2035
  • Figure 24: North America Market Value Share and BPS Analysis by Product Type, 2025 and 2035
  • Figure 25: North America Market Y-o-Y Growth Comparison by Product Type, 2025 to 2035
  • Figure 26: North America Market Attractiveness Analysis by Product Type
  • Figure 27: North America Market Value Share and BPS Analysis by Activity, 2025 and 2035
  • Figure 28: North America Market Y-o-Y Growth Comparison by Activity, 2025 to 2035
  • Figure 29: North America Market Attractiveness Analysis by Activity
  • Figure 30: North America Market Value Share and BPS Analysis by Sales Channel, 2025 and 2035
  • Figure 31: North America Market Y-o-Y Growth Comparison by Sales Channel, 2025 to 2035
  • Figure 32: North America Market Attractiveness Analysis by Sales Channel
  • Figure 33: Latin America Market Value Share and BPS Analysis by Country, 2025 and 2035
  • Figure 34: Latin America Market Value Share and BPS Analysis by Product Type, 2025 and 2035
  • Figure 35: Latin America Market Y-o-Y Growth Comparison by Product Type, 2025 to 2035
  • Figure 36: Latin America Market Attractiveness Analysis by Product Type
  • Figure 37: Latin America Market Value Share and BPS Analysis by Activity, 2025 and 2035
  • Figure 38: Latin America Market Y-o-Y Growth Comparison by Activity, 2025 to 2035
  • Figure 39: Latin America Market Attractiveness Analysis by Activity
  • Figure 40: Latin America Market Value Share and BPS Analysis by Sales Channel, 2025 and 2035
  • Figure 41: Latin America Market Y-o-Y Growth Comparison by Sales Channel, 2025 to 2035
  • Figure 42: Latin America Market Attractiveness Analysis by Sales Channel
  • Figure 43: Europe Market Value Share and BPS Analysis by Country, 2025 and 2035
  • Figure 44: Europe Market Value Share and BPS Analysis by Product Type, 2025 and 2035
  • Figure 45: Europe Market Y-o-Y Growth Comparison by Product Type, 2025 to 2035
  • Figure 46: Europe Market Attractiveness Analysis by Product Type
  • Figure 47: Europe Market Value Share and BPS Analysis by Activity, 2025 and 2035
  • Figure 48: Europe Market Y-o-Y Growth Comparison by Activity, 2025 to 2035
  • Figure 49: Europe Market Attractiveness Analysis by Activity
  • Figure 50: Europe Market Value Share and BPS Analysis by Sales Channel, 2025 and 2035
  • Figure 51: Europe Market Y-o-Y Growth Comparison by Sales Channel, 2025 to 2035
  • Figure 52: Europe Market Attractiveness Analysis by Sales Channel
  • Figure 53: East Asia Market Value Share and BPS Analysis by Country, 2025 and 2035
  • Figure 54: East Asia Market Value Share and BPS Analysis by Product Type, 2025 and 2035
  • Figure 55: East Asia Market Y-o-Y Growth Comparison by Product Type, 2025 to 2035
  • Figure 56: East Asia Market Attractiveness Analysis by Product Type
  • Figure 57: East Asia Market Value Share and BPS Analysis by Activity, 2025 and 2035
  • Figure 58: East Asia Market Y-o-Y Growth Comparison by Activity, 2025 to 2035
  • Figure 59: East Asia Market Attractiveness Analysis by Activity
  • Figure 60: East Asia Market Value Share and BPS Analysis by Sales Channel, 2025 and 2035
  • Figure 61: East Asia Market Y-o-Y Growth Comparison by Sales Channel, 2025 to 2035
  • Figure 62: East Asia Market Attractiveness Analysis by Sales Channel
  • Figure 63: South Asia Market Value Share and BPS Analysis by Country, 2025 and 2035
  • Figure 64: South Asia Market Value Share and BPS Analysis by Product Type, 2025 and 2035
  • Figure 65: South Asia Market Y-o-Y Growth Comparison by Product Type, 2025 to 2035
  • Figure 66: South Asia Market Attractiveness Analysis by Product Type
  • Figure 67: South Asia Market Value Share and BPS Analysis by Activity, 2025 and 2035
  • Figure 68: South Asia Market Y-o-Y Growth Comparison by Activity, 2025 to 2035
  • Figure 69: South Asia Market Attractiveness Analysis by Activity
  • Figure 70: South Asia Market Value Share and BPS Analysis by Sales Channel, 2025 and 2035
  • Figure 71: South Asia Market Y-o-Y Growth Comparison by Sales Channel, 2025 to 2035
  • Figure 72: South Asia Market Attractiveness Analysis by Sales Channel
  • Figure 73: Oceania Market Value Share and BPS Analysis by Country, 2025 and 2035
  • Figure 74: Oceania Market Value Share and BPS Analysis by Product Type, 2025 and 2035
  • Figure 75: Oceania Market Y-o-Y Growth Comparison by Product Type, 2025 to 2035
  • Figure 76: Oceania Market Attractiveness Analysis by Product Type
  • Figure 77: Oceania Market Value Share and BPS Analysis by Activity, 2025 and 2035
  • Figure 78: Oceania Market Y-o-Y Growth Comparison by Activity, 2025 to 2035
  • Figure 79: Oceania Market Attractiveness Analysis by Activity
  • Figure 80: Oceania Market Value Share and BPS Analysis by Sales Channel, 2025 and 2035
  • Figure 81: Oceania Market Y-o-Y Growth Comparison by Sales Channel, 2025 to 2035
  • Figure 82: Oceania Market Attractiveness Analysis by Sales Channel
  • Figure 83: MEA Market Y-o-Y Growth Comparison by Product Type, 2025 to 2035
  • Figure 84: MEA Market Attractiveness Analysis by Product Type
  • Figure 85: MEA Market Value Share and BPS Analysis by Activity, 2025 and 2035
  • Figure 86: MEA Market Y-o-Y Growth Comparison by Activity, 2025 to 2035
  • Figure 87: MEA Market Attractiveness Analysis by Activity
  • Figure 88: MEA Market Value Share and BPS Analysis by Sales Channel, 2025 and 2035
  • Figure 89: MEA Market Y-o-Y Growth Comparison by Sales Channel, 2025 to 2035
  • Figure 90: MEA Market Attractiveness Analysis by Sales Channel
  • Figure 91: Global Market - Tier Structure Analysis
  • Figure 92: Global Market - Company Share Analysis

- FAQs -

What was the global Sports compression clothing market size reported by Fact.MR for 2025?

The Global Sports compression clothing market was valued at USD 5,670 Million in 2025.

Who are the major players operating in the sports compression clothing market?

Prominent players in the market are Vim & Vigr, CW X, Under Armor, Nike Inc., VIRUS Performance, MudGear, Zensah, Pacterra Athletics, Brooks Sports Inc., WOLACO, 2XU, Asics, and Adidas AG.

What is the Estimated Valuation of the sports compression clothing market in 2035?

The market is expected to reach a valuation of USD 12,470 Million in 2035.

What value CAGR did the Sports compression clothing market exhibit over the last five years?

The historic growth rate of the Sports compression clothing market was 6.9% from 2020 to 2024.

- Also of Interest -

Sports Betting & Lottery Market

Sports Betting & Lottery Market Study by Lotteries- Including Lotto & Instant Scratches, Sports Betting, Keno & Vlts, and Bingo Etc. for Consumer Aged to 45 Years, and Others 2024 to 2034

Sports Equipment Market

Sports Equipment Market Study by Balls, Sticks, Bats & Clubs, Nets & Goals, Rods & Tackles, and Gear for Men, Women, and Teens from 2024 to 2034

Sports Footwear Market

Sports Footwear Market Study by Running Footwear, Training & Gym Footwear, Basketball Footwear, Football Footwear, Baseball Footwear, Tennis Footwear, and Cricket Footwear from 2023 to 2033

Sports Fishing Equipment Market

Sports Fishing Equipment Market By Product Type (Rods, Reels, Hooks, Lures), By End-User (Individual Consumers, Clubs, Sports Organizers), By Distribution Channel (Independent Sports Outlets, Franchised Sports Outlets) - Global Market Insights 2023 to 2033

Sports Compression Clothing Market

Schedule a Call