- Base Value(2025): 2.8 Bn
- Estimated Value(2026): 3.0 Bn
- Forecast Value (2036): 5.4 Bn
- CAGR (2026 - 2036): 6.2%
Balanced Protein Market Overview, Growth Outlook, and Forecast by Fact.MR
- In 2025, the balanced protein market was valued at USD 2.8 billion.
- Based on market analysis, demand for balanced protein is estimated to grow to USD 3.0 billion in 2026 and reach USD 5.4 billion by 2036.
- The market is projected to expand at a CAGR of 6.2% during the forecast period.
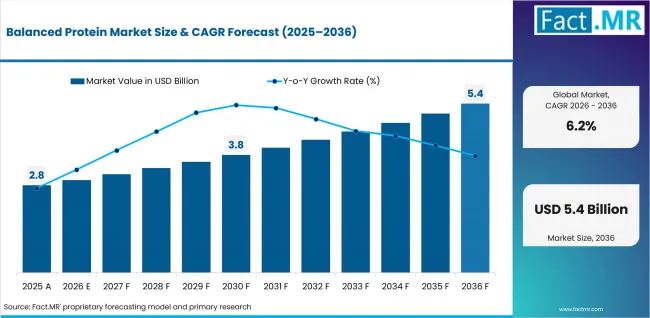
Balanced Protein Market Value Analysis | Source: Fact.MR
Summary of the Balanced Protein Market
- Market Snapshot
- Global balanced protein market revenue stood at USD 3.0 billion in 2026 and is forecast to reach USD 5.4 billion by 2036.
- At a 6.2% CAGR from 2026 to 2036, the market is expected to expand ~1.8x in value, creating an absolute dollar opportunity of USD 2.5 billion.
- The growth of the market is driven by the high demand for functional and high-protein nutrition products, growing popularity of plant-based and blended protein solutions, high protein intake in consumer-friendly foods and beverages.
- A rising consumer inclination towards sustainable, clean-label and nutritionally balanced products is driving the demand from both the developed and the developing regions.
- Increasing consumption of sports nutrition, rising adoption of flexitarian diets and growing innovation in RTD protein beverages and meal replacement products are some of the vital factors supporting the growth of the market globally.
- Demand and Growth Drivers
- Growing global demand for high-protein and functional nutrition products
- Increasing consumer preference towards plant protein and mixed protein formulations
- Expansion of Flexitarian and Health-Conscious Dietary Lifestyles
- Increasing awareness related to muscle health, weight management and active nutrition
- Increasing use of protein fortification within mainstream food applications
- Demand for solutions for:
- Balanced amino acid nutrition
- Sustainable protein alternatives
- Convenient protein consumption on the go
- Muscle recovery and performance aids
- Support for weight management and satiety
- Clean-label and functional nutrition products
- Better taste and texture of protein products
- Product and Segment View
- Plant-based protein accounts for 33.9% of protein source share in 2026, emerging as the leading segment due to increasing consumer preference for sustainable and clean-label protein solutions.
- Protein powders hold a significant share of product type demand in 2026, supported by strong adoption across sports nutrition and lifestyle wellness applications.
- Isolates represent a major share of form segmentation in 2026 owing to high protein concentration and widespread usage in premium nutrition products.
- Lifestyle consumers and flexitarians are expected to witness strong demand growth driven by increasing mainstream protein consumption trends.
- Geography and Competitive Outlook
- Increasing demand for functional foods, expanding sports nutrition adoption, and rising alternative protein investments are the key factors fueling strong market growth in East Asia, South Asia & Pacific, and North America.
- Major growth markets in the Balanced Protein Market include India (9.7% CAGR), Japan (8.5% CAGR), China (8.4% CAGR), Brazil (7.3% CAGR), United Kingdom (4.1% CAGR), Germany (3.6% CAGR), and the United States (5.3% CAGR) during the forecast period.
- Market growth can be attributed to:
- Increasing demand for plant-based and blended proteins
- Growing penetration of protein-fortified foods and beverages
- Rising adoption of meal replacements and RTD protein drinks
- Increasing focus on wellness, active lifestyles, and preventive nutrition
- Expanding investments in protein ingredient innovation and food-tech infrastructure
- ADM, Cargill, Ingredion, Roquette, Kerry, Danone, Fonterra, Arla Foods Ingredients, and MuscleBlaze are the key players operating in the market.
- Analyst Opinion
- Shambhu Nath Jha, Principal Consultant at Fact.MR, opines, "The CXO leaders should consider that the balanced protein market competition will be more influenced by innovations in formulation including advanced plant-based and blended protein formulations, development around clean-label and sustainable protein solutions, functional nutrition delivery across mainstream food categories, and continuous innovation in convenient high-protein products such as RTD beverages, meal replacements, and protein snacks to meet rising global demand for wellness-focused, performance-oriented and environmentally sustainable nutrition solutions.
Balanced Protein Market — At a Glance
| Attribute | Details |
|---|---|
| Market Value 2025 | USD 2.8 Billion |
| Market Value 2026 | USD 3.0 Billion |
| Market Value 2036 | USD 5.4 Billion |
| Absolute Dollar Opportunity | USD 2.5 Billion |
| Total Growth | 83.33% |
| CAGR | 6.20% |
| Growth Multiple | 1.8x |
| Key Demand Theme | Rising demand for functional and high-protein nutrition products, increasing adoption of plant-based and blended proteins, growing consumption of convenient protein-rich foods and beverages, rising preference for clean-label and sustainable protein solutions, and expanding sports nutrition and wellness trends |
| Leading Protein Source | Plant-Based Protein |
| Protein Source Share | 33.90% |
| Leading Product Type | Protein Powders |
| Product Type Share | 25.90% |
| Leading Protein Type | Whey Protein |
| Protein Type Share | 23.10% |
| Leading Form | Isolates |
| Form Share | 33.20% |
| Leading Consumer Segment | Athletes & Bodybuilders |
| Consumer Segment Share | 28.60% |
| Leading Application | Sports Nutrition |
| Application Share | 31.60% |
| Key Growth Regions | East Asia, South Asia & Pacific, North America |
| Key Companies | ADM, Cargill, Ingredion, Roquette, Kerry, Danone, Fonterra, Arla Foods Ingredients, MuscleBlaze |
| Segmentation by Protein Source | Animal-Based Protein, Plant-Based Protein, Animal-Plant Blended Protein, Fermentation-Based Protein |
| Segmentation by Product Type | Protein Powders, RTD Protein Beverages, Protein Bars & Snacks, Functional Foods, Dairy Alternatives, Meat Alternatives, Meal Replacements, Clinical Nutrition, Protein Yogurt |
| Segmentation by Protein Type | Soy Protein, Pea Protein, Rice Protein, Wheat Protein, Whey Protein, Casein Protein, Egg Protein, Collagen Protein, Mycoprotein, Blended Proteins |
| Segmentation by Form | Isolates, Concentrates, Hydrolysates, Textured Proteins, Blends |
| Segmentation by Consumer Segment | Athletes & Bodybuilders, Lifestyle Consumers, Flexitarians, Vegans & Vegetarians, Aging Population, Weight-Loss Consumers |
| Segmentation by Application | Sports Nutrition, Functional Foods, Weight Management, Elder Nutrition, Clinical Nutrition, General Wellness |
| Segmentation by Region | North America, Latin America, East Asia, South Asia & Pacific, Western Europe, Eastern Europe, Middle East & Africa |
Source: Fact.MR analysis. Updated May 27, 2026
The balanced protein market is projected to create an absolute dollar opportunity of USD 2.5 billion between 2026 and 2036. Market growth is driven by increasing demand for functional and high-protein nutrition products, rising adoption of plant-based and blended protein formulations, and growing consumer preference for sustainable and clean-label protein solutions. Expanding sports nutrition consumption, increasing demand for convenient protein-rich foods and beverages, and rising popularity of flexitarian diets are further supporting market expansion. In addition, continuous innovation in RTD protein beverages, meal replacements, and animal-plant blended protein products continues to accelerate global market demand.
Key Growth Drivers, Constraints, and Opportunities
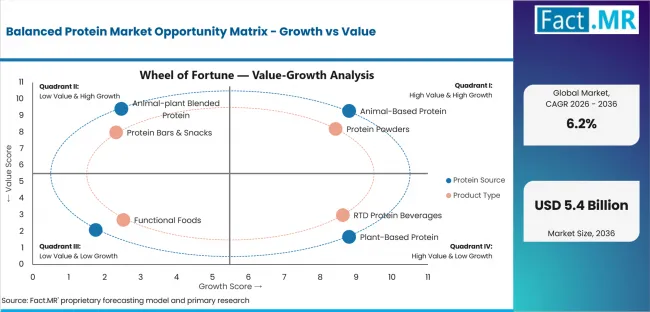
Balanced Protein Market Opportunity Matrix Growth Vs Value | Source: Fact.MR
Key Factors Driving Growth
- The balanced protein market is being driven by increasing global demand for functional and high-protein nutrition products in sports, wellness, and lifestyle consumer segments.
- Growing acceptance of plant-based and blended protein solutions by flexitarians and health-conscious consumers is propelling the demand for balanced protein products worldwide.
- Rising demand from consumers for quick – easy protein foods and drinks such as protein snacks, ready to drink (RTD) protein beverage and meal replacements is also backing the commercial growth in the mainstream nutrition.
| Growth Driver | Demand Impact | Time Horizon | Key Impact Area | Fact.MR Insight |
|---|---|---|---|---|
| Rising global demand for functional and high-protein nutrition products | High | Short–Mid Term | Functional nutrition & wellness demand | Increasing consumer focus on active lifestyles, muscle health, weight management, and preventive nutrition is significantly driving demand for balanced protein products globally. |
| Growing adoption of plant-based and blended protein formulations | High | Short–Mid Term | Sustainable nutrition & protein diversification | High consumer preference for flexitarian diets, clean-label nutrition, and sustainable protein consumption is accelerating commercialization of plant-based and animal-plant blended protein products. |
| Expanding demand for convenient protein-rich foods and beverages | Medium-High | Mid–Long Term | RTD beverages & meal replacement expansion | Increasing consumption of RTD protein beverages, protein snacks, and meal replacements is supporting strong demand growth across mainstream lifestyle and wellness consumers. |
| Increasing investments in alternative proteins and food-tech innovation | Medium-High | Mid–Long Term | Protein innovation & advanced formulation development | Expansion of investments in fermentation proteins, precision nutrition, clean-label formulations, and advanced protein blending technologies is strengthening long-term market growth opportunities. |
| Rising development of personalized nutrition and AI-driven dietary solutions | Medium-High | Mid–Long Term | Personalized nutrition & smart wellness ecosystems | Increasing adoption of AI-based nutrition platforms, wearable integration, DNA-based nutrition, and personalized protein recommendations is expected to create new premiumization and consumer engagement opportunities in the balanced protein market. |
Source: Fact.MR analysis. Updated May 27, 2026
Key Market Constraints
- The high cost of formulation and production for premium plant-based, blended and fermentation-based proteins could potentially act as a barrier to entry for cost-conscious consumers.
- Taste, texture and solubility issues in plant-based and high-protein products continue to challenge manufacturers in product development.
- Protein labelling claims, functional nutrition positioning and clean label compliance regulatory complexities may impact on commercialization in various markets.
Key Opportunity Areas
- Rising demand for personalized nutrition and AI-based diet planning may offer significant growth opportunities for customized balanced protein products.
- The protein alternatives category is also expanding, with meat-plant hybrid proteins and fermentation-based proteins providing new possibilities in the areas of sustainable and functional nutrition.
- Growing usage of RTD protein drinks, meal replacements and protein-enriched functional foods has enormous potential for market growth among the mainstream consumers.
Segment-wise Analysis of the Balanced Protein Market
- Plant-based protein accounts for 33.9% share of the protein source segment in 2026, driven by increasing consumer preference for sustainable nutrition, growing adoption of flexitarian diets, and rising demand for clean-label and functional protein products across global wellness and sports nutrition markets.
- Protein powders represent 25.9% share of the product type segment in 2026, supported by strong commercial demand across sports nutrition, lifestyle wellness, muscle recovery, and convenient daily protein supplementation applications.
- Whey protein holds 23.1% share of the protein type segment in 2026, owing to its superior amino acid profile, high bioavailability, strong solubility, and widespread utilization across sports nutrition, RTD beverages, and clinical nutrition products.
The balanced protein market is segmented by protein source, product type, protein type, form, consumer segment, application, and region.
Which Product Type Segment Leads the Market?
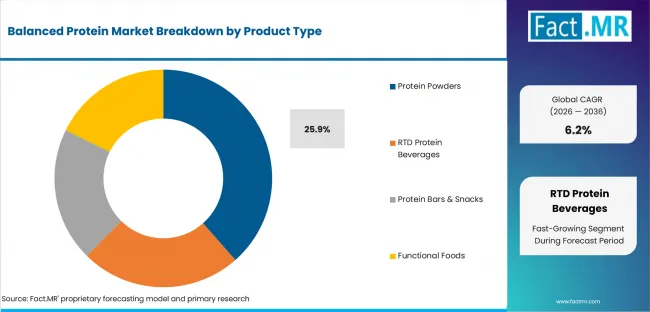
Balanced Protein Market Analysis By Product Type | Source: Fact.MR
The Protein Powders segment is anticipated to account for the largest market share of 25.9% by 2026 due to rising consumer preference for convenient protein supplementation, muscle recovery products, and sports nutrition products. Rising adoption of protein powders among athletes, fitness enthusiasts and lifestyle consumers and increasing innovation in flavors, clean-label and blended protein formulations, further helps to maintain the dominance of this segment in global nutrition markets.
Which Protein Type Segment Holds the Largest Share in the Market?
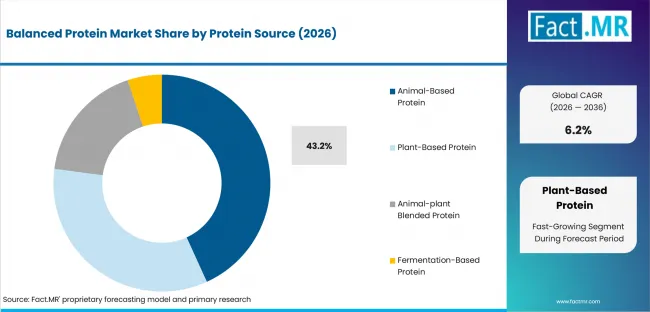
Balanced Protein Market Analysis By Protein Source | Source: Fact.MR
Whey Protein is projected to dominate the protein type segment, capturing 23.1% share in 2026. This leadership is driven by its superior amino acid profile, rapid digestibility, high bioavailability, and extensive usage across sports nutrition, clinical nutrition, and RTD protein beverages. Strong scientific validation supporting muscle recovery and performance enhancement applications is also contributing to widespread commercial adoption of whey protein products globally.
Which Form Segment Holds the Largest Share in the Market?
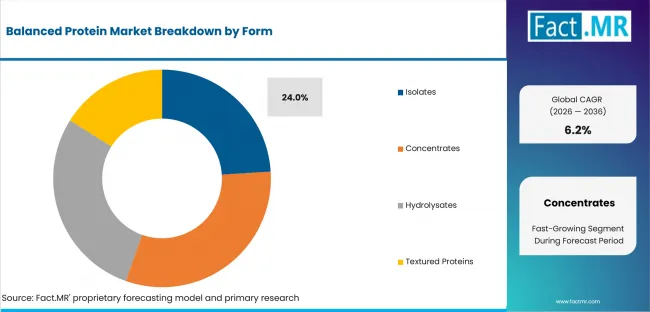
Balanced Protein Market Analysis By Form | Source: Fact.MR
The Isolates segment is anticipated to account for the largest share of 24% by 2026. This dominance is supported by increasing demand for high-purity protein formulations offering improved digestibility, low fat and carbohydrate content, and enhanced protein concentration. Isolates are widely utilized across premium sports nutrition, wellness beverages, meal replacements, and clinical nutrition products due to their strong nutritional efficiency and formulation versatility.
Which Consumer Segment Holds the Largest Share in the Market?
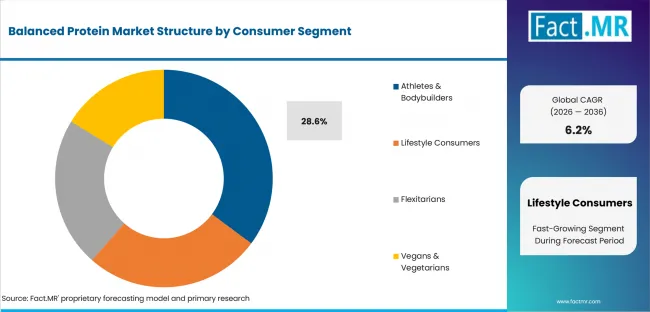
Balanced Protein Market Analysis By Consumer Segment | Source: Fact.MR
Athletes & Bodybuilders are expected to hold the largest consumer segment share of 28.6% by 2026. This growth is attributed to rising participation in fitness activities, increasing awareness regarding muscle recovery and sports performance, and growing consumption of protein supplements among active consumers. Expanding gym culture, wellness trends, and demand for performance nutrition products continue to support strong segment growth globally.
Which Application Segment Holds the Largest Share in the Market?
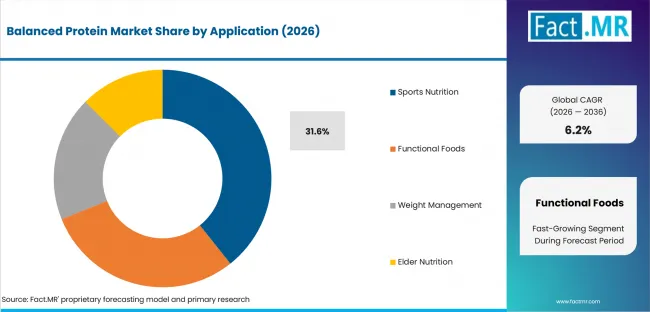
Balanced Protein Market Analysis By Application | Source: Fact.MR
The Sports Nutrition segment is projected to lead the application category with a market share of 31.6% by 2026. This dominance is driven by increasing consumer focus on fitness, endurance, muscle development, and active lifestyle management. Growing demand for protein powders, RTD beverages, protein snacks, and recovery-focused nutrition products among both professional athletes and mainstream consumers is further strengthening the growth of the sports nutrition application segment globally.
Regional Outlook Across Key Markets
This report covers key regions like North America, Latin America, Western Europe, Eastern Europe, East Asia, South Asia & Pacific, and Middle East & Africa. It covers in-depth analysis on trends in protein consumption, the rise in plant-based and blended protein products, growth of the sports nutrition and functional food sectors, increasing demand for RTD protein drinks and meal replacements, wellness-focused and high-protein diets becoming more mainstream, protein formulation and fermentation technology advances, regulatory activity around protein labeling and protein-related health and functional claims, increased investment in alternative proteins and food technology innovation, and a shifting consumer preference towards clean-label, sustainable, and personalized nutrition offerings across global balanced protein segments.
.webp "Top Country Growth Comparison Balanced Protein Market Cagr (2026 2036)")
Top Country Growth Comparison Balanced Protein Market Cagr (2026 2036) | Source: Fact.MR
CAGR Table
| Country | CAGR (%) |
|---|---|
| United States | 5.3% |
| China | 8.4% |
| Germany | 3.6% |
| United Kingdom | 4.1% |
| India | 9.7% |
| Japan | 8.5% |
| Brazil | 7.3% |
Source: Fact.MR analysis. Updated May 27, 2026
Source: Fact.MR (FMR) analysis, based on proprietary forecasting model and primary research.
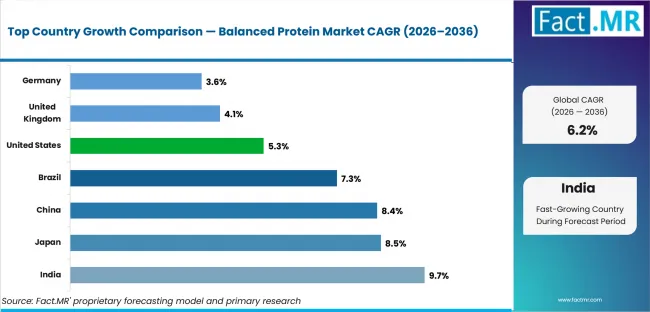
Balanced Protein Market Cagr Analysis By Country | Source: Fact.MR
North America Balanced Protein Market
The North America balanced protein market is poised to hold a significant share due to high sports nutrition penetration, growing consumption of functional and high-protein foods, demand for RTD (ready-to-drink) protein drinks and meal replacers, and consumer preference for clean-label and sustainable protein solutions. Increasing investments in plant based/bioengineered protein research and development, expansion of wellness food segments and growing applications of tailored nutrition solutions are other factors driving the regional market.
- United States: Demand for balanced protein products in the United States is projected to rise at 5.3% CAGR through 2036. Growth is driven by increasing sports nutrition consumption, rising preference for high-protein diets, expanding adoption of RTD protein beverages, and growing penetration of wellness-focused nutrition products.
- Canada: Demand for balanced protein products in Canada is projected to grow steadily through 2036, supported by increasing demand for clean-label protein formulations, growing plant-based protein adoption, and rising consumer interest in sustainable nutrition products.
Europe Balanced Protein Market
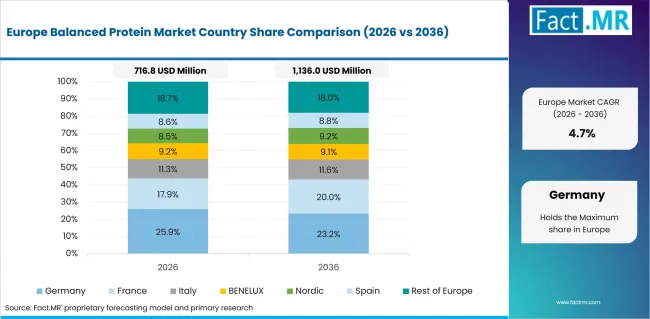
Balanced Protein Market Europe Country Market Share Analysis, 2026 & 2036 | Source: Fact.MR
The strong market growth in Europe is mainly driven by increasing plant-based nutrition consumers, expanding flexitarian population, demand for sustainable protein sources and proactive engagement in R&D of functional food and meal replacement products. The uptake of balanced protein products is likewise set to benefit by a regulatory focus on clean-label nutrition and sustainable food systems.
- Germany: Demand for balanced protein products in Germany is projected to rise steadily through 2036, supported by increasing demand for plant-based foods, growth in protein-fortified functional products, and expanding wellness nutrition consumption.
- United Kingdom: Demand for balanced protein products in the United Kingdom is projected to rise at 4.1% CAGR through 2036, driven by increasing flexitarian diets, growing adoption of meal replacement products, and rising demand for convenient protein-rich nutrition solutions.
East Asia Balanced Protein Market
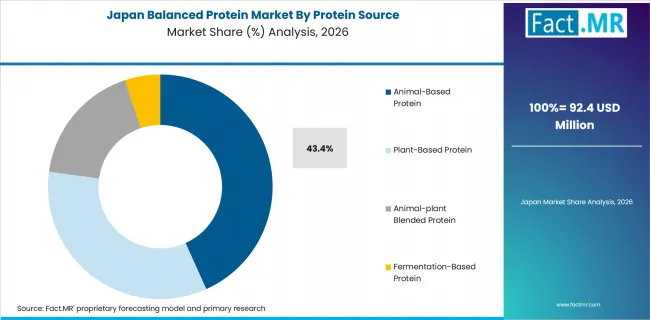
Balanced Protein Market Japan Market Share Analysis By Protein Source | Source: Fact.MR
East Asia is anticipated to emerge as one of the growth regions in clean protein market on account of surging health consciousness, high protein consumption, rapid progress of functional foods & drinks, and significant investment in alternative protein technology within the region. Protein fortification is also becoming popular with local consumers who are increasingly focused on wellness, active living and ageing gracefully.
- China: Demand for balanced protein products in China is projected to rise at 8.4% CAGR through 2036, driven by increasing wellness-focused nutrition demand, expanding sports nutrition consumption, rapid functional food market growth, and rising investments in plant-based and blended proteins.
- Japan: Demand for balanced protein products in Japan is projected to rise at 8.5% CAGR through 2036, supported by growing healthy aging nutrition demand, increasing protein supplementation among elderly consumers, and expanding demand for convenient functional nutrition products.
South Asia & Pacific Balanced Protein Market
South Asia and the Pacific is anticipated to be one of the rapidly expanding regions in the balanced protein market due to increasing disposable income, an increase in fitness awareness, urbanization, and the adoption of protein-rich diets. Regional players are now making more investments in sports nutrition, plant-based proteins and more cost-effective protein fortification solutions.
- India: Demand for balanced protein products in India is projected to rise at 9.7% CAGR through 2036, driven by increasing fitness participation, rising sports nutrition adoption, growing demand for protein-fortified foods, and expanding awareness regarding nutritional deficiencies and wellness-focused diets.
Latin America Balanced Protein Market
The Latin America balanced-protein market is expected to experience robust growth, driven by the growing population of health-conscious consumers, higher adoption of functional nutrition products, and increased penetration of sports nutrition and protein drinks. Companies are increasingly concentrating on cost-effective protein solutions and regional nutrition innovation to fuel demand growth at the regional level.
- Brazil: Demand for balanced protein products in Brazil is projected to rise at 7.3% CAGR through 2036, supported by expanding sports nutrition demand, increasing fitness culture, growing protein beverage consumption, and rising adoption of plant-based protein products.
The Fact.MR report analyzes market trends, protein consumption patterns, competitive benchmarking, plant-based and blended protein adoption trends, functional food innovation, sports nutrition expansion, personalized nutrition technologies, and long-term growth opportunities across individual countries in North America, Latin America, Europe, East Asia, South Asia & Pacific, and Middle East & Africa. Readers gain detailed insights into protein innovation trends, clean-label nutrition adoption, wellness-focused dietary shifts, alternative protein commercialization, and future opportunities across the global balanced protein market.
Competitive Benchmarking and Company Positioning
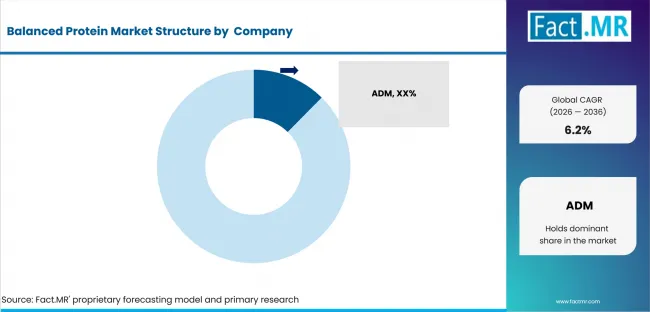
Balanced Protein Market Analysis By Company | Source: Fact.MR
Leading Companies Shaping the Balanced Protein Market
The balanced protein market exhibits a somewhat competitive landscape with the competitors focusing on protein innovation, clean-label solutions, high-quality protein sources, taste enhancement, texturization, and sustainable protein sourcing. Competitors are now prioritizing the expansion and development of plant-based and blended protein options, meal replacement products and functional nutrition solutions to enhance their market positions.
Developments in personalized nutrition, precision protein formulations, fermentation-derived proteins and novel protein blending technologies are further driving the level of competition in the market. The companies are also seeking to drive consumer engagement and build brand loyalty by investing more into sports nutrition, nutrition products that are focused on wellness, and easy-to-eat high-protein food options. Globally, balanced protein market is seeing a strong focus on the product functionality, digestibility, shelf-stability and premium nutrition positioning in the product, and this is expected to continue to drive the competition.
Recent Industry Developments
- Barilla – Launch of Protein+® Stars Pasta for Functional Nutrition Expansion (2025)
- Barilla launched Protein+® Stars Pasta as part of its expanding high-protein functional food portfolio designed to support increasing consumer demand for convenient and protein-fortified nutrition products. The launch highlights growing commercialization of mainstream protein-enriched foods targeting wellness-focused and active lifestyle consumers. The initiative further strengthens Barilla’s position in functional protein innovation and supports rising adoption of balanced protein products across everyday food categories globally. [1]
- Danone – Expansion of Nutrition Portfolio through Huel Acquisition (2025)
- Danone expanded its nutrition portfolio through the acquisition of Huel for US$1.1 billion to strengthen its presence in meal replacements, functional nutrition, and high-protein food categories. The acquisition supports Danone’s long-term strategy focused on balanced nutrition, convenient protein consumption, and wellness-oriented dietary solutions. The move also reinforces increasing industry focus on protein-rich meal replacement products and personalized nutrition ecosystems globally. [2]
- Cargill – Expansion of Beijing Production Facility for Nutrition Solutions (2026)
- Cargill invested in the expansion of its Beijing production facility to strengthen manufacturing capacity for food ingredients, flavored beverages, and functional nutrition solutions. The expansion supports increasing demand for protein-rich beverages, wellness-focused food products, and advanced nutrition formulations across Asia-Pacific markets. The investment further reinforces Cargill’s strategic focus on nutrition innovation and growing commercialization of balanced protein and functional food applications globally. [3]
- Lotte Wellfood – Launch of ‘Pasteur Protein+’ Nutritional Food Brand (2025)
- Lotte Wellfood launched its ‘Pasteur Protein+’ brand focused on protein-fortified nutritional products targeting wellness-focused and lifestyle consumers. The launch reflects growing consumer demand for convenient protein-rich foods, functional nutrition products, and balanced dietary solutions across Asia-Pacific markets. The initiative strengthens Lotte Wellfood’s position in the expanding protein nutrition category and supports increasing penetration of mainstream protein-fortified food products globally. [4]
- ADM – Streamlining of Soy Protein Production Network (2025)
- ADM announced the streamlining of its soy protein production network to optimize operational efficiency and strengthen global protein ingredient supply capabilities. The initiative supports increasing demand for plant-based proteins, blended protein formulations, and clean-label nutrition products across sports nutrition, functional foods, and wellness nutrition applications. The operational expansion reinforces ADM’s strategic focus on alternative proteins and strengthens its position in the global balanced protein ingredient market. [5]
Leading Companies Shaping the Balanced Protein Market
- Cargill
- ADM
- Ingredion
- Roquette
- Kerry Group
- Fonterra
- Arla Foods Ingredients
- Danone
- Nestlé
- Amul
- MuscleBlaze
- Beyond Meat
- Orgain
Sources and Research References
- [1] Barilla, “Barilla® Launches Protein+® Stars Pasta and Derek Hough-Led Training Timers to Encourage Movement in the Time It Takes to Cook”, 2025
- [2] Danone, “Danone Expands Nutrition Portfolio with Acquisition of Huel for USD1.1B”, 2025
- [3] Cargill, “Cargill Invests to Expand Beijing Plant”, 2026
- [4] Lotte Wellfood, “Lotte Wellfood Launches Nutritional Food Brand ‘Pasteur Protein+’”, 2025
- [5] ADM, “ADM Announces Streamlining of Soy Protein Production Network”, 2025
Balanced Protein Market Definition
Balanced protein market is a part of protein nutrition and functional foods industry, which contains protein products and solutions that are formulated to deliver balanced nutritional profiles via animal-based, plant-based, blended, and protein derived from fermentation. These are protein powders, RTD drinks, protein snacks, meal replacements, dairy substitutes and functional foods made with whey, soy, pea, collagen, mycoprotein and mixed proteins. Balanced protein solutions are much used in sports nutrition, wellness, weight management, clinical nutrition and healthy aging applications worldwide.
Balanced Protein Market Inclusions
The analysis of the balanced protein market is a far-reaching and containing analysis of the global balanced protein market and this study is conducted for the time frame from 2026 to 2036. It provides detailed information on the protein source, product type, protein type, form, consumer segment, application, and regional levels. The report covers emerging market trends such as plant-based and blended proteins, functional nutrition, RTD protein beverages, clean-label formulations, precision fermentation, sustainable protein solutions, growing consumer demand for convenient high-protein foods and beverages, and more.
Balanced Protein Market Exclusions
The protein market report provides a detailed analysis of the protein rich nutrition products and formulations based on animal-sourced, plant sourced, blended, and fermentation derived proteins for applications such as sports nutrition, functional food, meal replacement, wellness nutrition and clinical nutrition. The study does not cover traditional commodity protein ingredients that are not functionally or nutritionally balanced, basic animal feed proteins, traditional foods that are not fortified, pharmaceutical protein therapies or proteins for use in non-food industrial applications.
Balanced Protein Market Research Methodology
- Primary Research
- Fact.MR has analyzed the balanced protein market at the global and regional level by revenue and at the country level by segments. To understand the protein ingredients market scenario, the report includes key players such as manufacturers of protein ingredients, functional food companies, sport nutrition companies, meal replacement companies, distributors, food technology companies, nutrition consultants, and industry experts.
- Desk Research
- This report includes information from company annual reports, investor presentations, protein industry reports, functional food journals, alternative protein research papers, nutrition databases, government food and trade journals and regulatory publications and sports nutrition market reports. Further references are certain studies on plant-based proteins, protein blends, fermentation derived proteins, clean label nutrition trends, RTD protein drinks, meal replacement products, sustainable protein innovations and on global protein consumption patterns influencing the demand of balanced protein products.
- Market-Sizing and Forecasting
- Fact.MR applies a blended methodology to assess the balanced protein market that includes a combination of a bottoms-up and top-down approaches to the balanced protein market analysis among various countries and associated regions. Information from the manufacturers, suppliers, distributors and nutrition brands were taken into consideration to assess the market potential as well as opportunity in each segment.
- Data Validation and Update Cycle
- The market estimates have been validated through several primary discussions with protein ingredient manufacturers, functional food companies, sports nutrition brands, distributors and industry experts, along with an analysis of company financials, product demand trends, protein consumption, investment activities on alternative proteins, and historical market performance.
Segmentation
Scope of Analysis
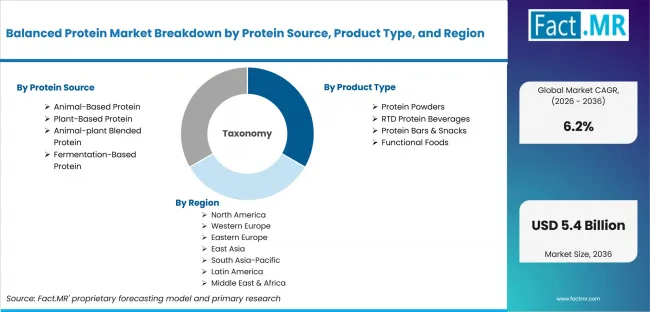
Balanced Protein Market Breakdown By Protein Source, Product Type, And Region | Source: Fact.MR
Parameter |
Details |
|---|---|
| Quantitative Units | USD 2.8 billion (2025) to USD 5.4 billion (2036), at a CAGR of 6.2% |
| Market Definition | The balanced protein market comprises protein-based nutritional products and formulations designed to provide balanced amino acid nutrition, functional health benefits, and convenient protein consumption across sports nutrition, wellness, meal replacements, and functional food applications. These products include protein powders, RTD protein beverages, protein bars & snacks, dairy alternatives, meal replacements, clinical nutrition products, and functional foods formulated using animal-based, plant-based, blended, and fermentation-derived proteins including whey, soy, pea, rice, collagen, mycoprotein, and other specialty protein ingredients. |
| Regions Covered | North America, Eastern Europe, Western Europe, East Asia, South Asia & Pacific, Latin America, Middle East & Africa |
| Countries Covered | USA, Canada, Germany, United Kingdom, China, Japan, India, Brazil, and 20+ countries |
| Key Companies | ADM, Cargill, Ingredion, Roquette, Kerry, Danone, Fonterra, Arla Foods Ingredients, MuscleBlaze |
| Forecast Period | 2026 to 2036 |
| Approach | Hybrid demand-side and top-down methodology based on protein consumption trends, sports nutrition demand, functional food penetration, plant-based and blended protein adoption rates, wellness-focused dietary trends, RTD protein beverage expansion, clean-label nutrition demand, alternative protein investments, and increasing adoption of personalized nutrition solutions, validated through primary interviews with protein ingredient manufacturers, nutrition brands, distributors, functional food companies, sports nutrition participants, and industry experts across major global regions. |
Source: Fact.MR analysis. Updated May 27, 2026
Analysis by Protein Source, Product Type, Protein Type, Form, Consumer Segment, Application, and Region
-
Balanced Protein Market by Protein Source
- Animal-Based Protein
- Plant-Based Protein
- Animal-Plant Blended Protein
- Fermentation-Based Protein
-
Balanced Protein Market by Product Type
- Protein Powders
- RTD Protein Beverages
- Protein Bars & Snacks
- Functional Foods
- Dairy Alternatives
- Meat Alternatives
- Meal Replacements
- Clinical Nutrition
- Protein Yogurt
-
Balanced Protein Market by Protein Type
- Soy Protein
- Pea Protein
- Rice Protein
- Wheat Protein
- Whey Protein
- Casein Protein
- Egg Protein
- Collagen Protein
- Mycoprotein
- Blended Proteins
-
Balanced Protein Market by Form
- Isolates
- Concentrates
- Hydrolysates
- Textured Proteins
- Blends
-
Balanced Protein Market by Consumer Segment
- Athletes & Bodybuilders
- Lifestyle Consumers
- Flexitarians
- Vegans & Vegetarians
- Aging Population
- Weight-Loss Consumers
-
Balanced Protein Market by Application
- Sports Nutrition
- Functional Foods
- Weight Management
- Elder Nutrition
- Clinical Nutrition
- General Wellness
-
Balanced Protein Market by Region
- North America
- USA
- Canada
- Mexico
- Latin America
- Brazil
- Chile
- Rest of LATAM
- East Asia
- China
- Japan
- South Korea
- Taiwan
- South Asia & Pacific
- India
- Singapore
- Australia
- ASEAN
- Western Europe
- Germany
- France
- U.K.
- Italy
- Spain
- BENELUX
- Nordic
- Rest of Western Europe
- Eastern Europe
- Poland
- Hungary
- Czech Republic
- Balkan & Baltics
- Rest of Eastern Europe
- Middle East and Africa
- Kingdom of Saudi Arabia
- United Arab Emirates
- South Africa
- Rest of Middle East and Africa
- North America
Frequently Asked Questions
How large is the demand for Balanced Protein in the global market in 2025?
What will be the market size of the Balanced Protein Market by 2036?
What is the expected demand growth for the Balanced Protein Market between 2026 and 2036?
How significant is the growth outlook for India in this market?
Which company is identified as a leading player in the Balanced Protein Market?
Who worked on this report


Preview the report firsthand - request a free sample
Free SampleGet the brochure for pricing and purchase details
Download PDF