- Market Value (2025): USD 40.8 Bn
- Estimated Value (2026): USD 45.0 Bn
- Forecast Value (2036): USD 118.9 Bn
- CAGR (2026-2036): 10.2%
What is the Biotech Ingredients Market forecast to be worth by 2036?
USD 45.0 billion in 2026 and USD 118.9 billion by 2036, CAGR 10.2%.
- The biotech ingredients market reached USD 40.8 billion in 2025 as biologics production and bio-based formulation work widened.
- Demand is projected to increase from USD 45.0 billion in 2026 to USD 118.9 billion by 2036.
- The market is forecast to record 10.2% CAGR from 2026 to 2036 as pharmaceutical companies and formulators shift toward biologically derived inputs.
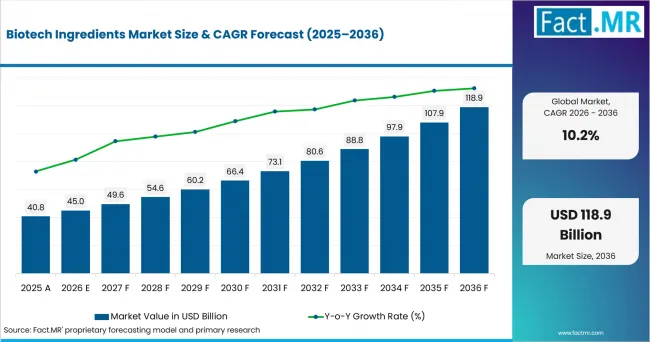
Biotech Ingredients Market Value Analysis | Source: Fact.MR
What are the defining numbers behind Biotech Ingredients Market growth?
USD 73.9 billion absolute opportunity by 2036, led by Recombinant Proteins, Biopharmaceutical Production and Pharmaceutical & Biotech Companies.
- Demand Drivers in the Market
- Biopharmaceutical manufacturers need recombinant proteins that deliver predictable biological activity during therapeutic drug production.
- Product development teams use cell culture ingredients to reduce process drift in regenerative medicine and vaccine workflows.
- Research laboratories require nucleic acid and lipid carrier inputs as molecular diagnostics and gene-based studies expand.
- Cosmetic and personal care formulators select fermentation-derived ingredients when they need consistent purity and traceable sourcing.
- Key Segments Analyzed
- By Product: Recombinant Proteins are expected to hold 55.3% share in 2026 owing to direct use in therapeutic proteins and biologics development.
- By Application: Biopharmaceutical Production is projected to account for 42.6% share in 2026 since biologics facilities require qualified inputs.
- By End Use: Pharmaceutical & Biotech Companies are anticipated to represent 71.9% share in 2026 due to their control of production specifications.
- By Technology: Recombinant DNA Technology is estimated to capture 57.3% share in 2026 as protein expression remains central to ingredient design.
- By Formulation: Liquid Biotech Ingredients are forecast to hold 63.8% share in 2026 because liquid formats simplify mixing and scale-up.
- By Distribution Channel: Direct Manufacturer Sales are expected to account for 74.2% share in 2026 where regulated customers need documentation support.
- Analyst Opinion at Fact.MR
- Shambhu Nath Jha, Principal Consultant at Fact.MR, states, “Biotech ingredients are becoming qualification assets rather than simple catalog inputs. Suppliers are expected to gain preference when proteins and media inputs arrive with strong batch records. Carrier systems need the same proof. A durable position depends on ingredient science and application support.”
- Strategic Implications
- Formulators should check ingredient origin, biological activity, and storage behavior before locking product claims.
- Biopharma procurement teams should prioritize suppliers that document lot history and change-control procedures.
- Ingredient manufacturers should invest in fermentation, expression, and purification capacity that supports regulated customers.
- Investors should separate broad biotech exposure from suppliers with verified ingredient portfolios and application support.
The USA is expected to record 8.2% CAGR through 2036 owing to biologics approvals and biomedical research depth. South Korea is projected to post 7.9% CAGR as recombinant biopharmaceutical output rises. Germany is forecast to reach 7.6% CAGR through its health-economy base. The UK is anticipated to advance at 7.4% CAGR where biopharmaceutical turnover remains material. Japan is estimated at 7.2% CAGR. France and Italy are projected at 7.1% and 6.8% CAGR respectively.
How does the Biotech Ingredients Market break down by segment?
Recombinant Proteins lead at 55.3%; Biopharmaceutical Production leads at 42.6%.
Which product leads?
Recombinant Proteins are projected to account for 55.3% share in 2026.
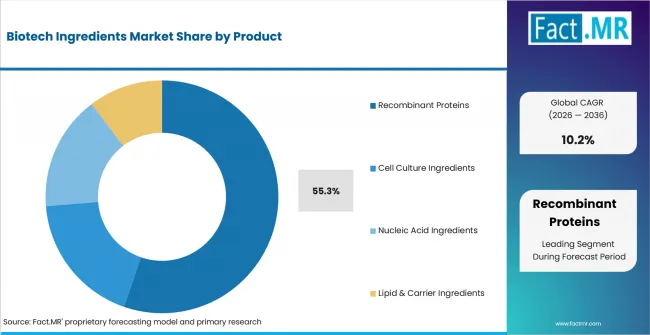
Biotech Ingredients Market Analysis By Product | Source: Fact.MR
Recombinant Proteins are expected to lead Product because they carry biological function in drugs and assays. Cell culture ingredients support growth conditions, while nucleic acid ingredients and lipid carriers serve diagnostics and delivery systems. FDA states that CDER approved 46 novel drugs in 2025.
What leads the Application segment?
Biopharmaceutical Production is expected to hold 42.6% share in 2026.
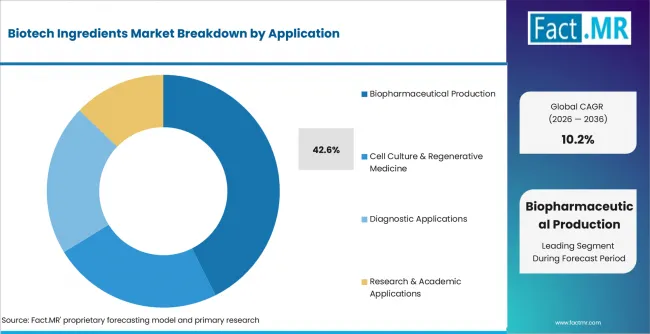
Biotech Ingredients Market Analysis By Application | Source: Fact.MR
Biopharmaceutical Production is projected to lead Application as regulated manufacturing requires qualified proteins and media components. Carrier systems are needed where delivery or stabilization is part of the formulation. Vaccine and therapeutic drug manufacturing depend on supplier files. Diagnostics add nucleic acid and immunodiagnostic demand. EMA reported on 15 January 2026 that it recommended 104 medicines for marketing authorisation in 2025 and issued 41 recommendations for new biosimilar products.
How does End Use shape demand?
Pharmaceutical & Biotech Companies are anticipated to lead with 71.9% share in 2026.
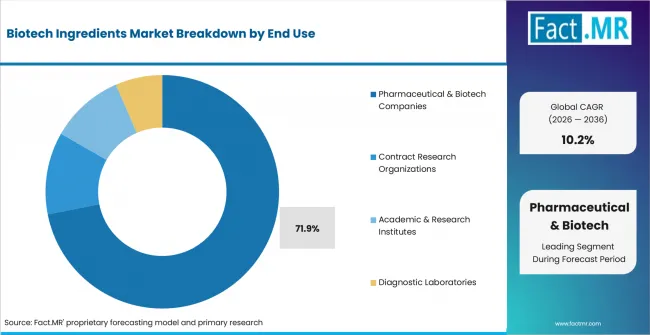
Biotech Ingredients Market Analysis By End Use | Source: Fact.MR
Pharmaceutical & Biotech Companies are anticipated to lead End Use due to their control over specifications and regulatory files. Large drugmakers need direct technical support. Biotechnology firms buy smaller volumes for research-to-clinical transfer. CROs and diagnostic laboratories need reliable ingredients for trial support and assay work.
What supports Recombinant DNA Technology?
Recombinant DNA Technology is estimated to represent 57.3% share in 2026.
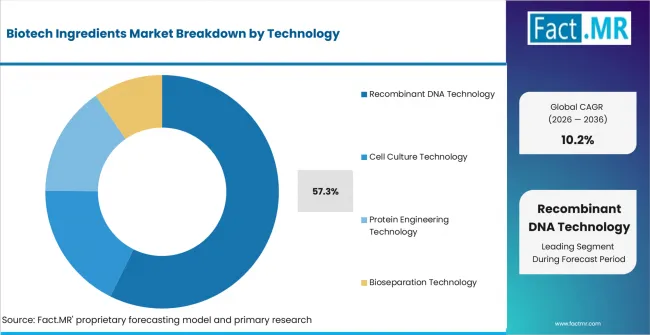
Biotech Ingredients Market Analysis By Technology | Source: Fact.MR
Recombinant DNA Technology is estimated to lead Technology because protein expression remains the main route for biotech ingredient design. Gene cloning and editing support activity improvements. Protein engineering supports yield improvement. Bioseparation gains value when purity proof decides approval.
Which formulation leads demand?
Liquid Biotech Ingredients are forecast to hold 63.8% share in 2026.
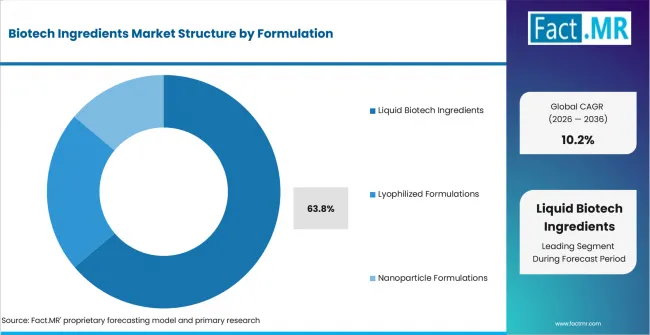
Biotech Ingredients Market Analysis By Formulation | Source: Fact.MR
Liquid Biotech Ingredients are forecast to lead Formulation as they simplify dosing and scale transfer. Aqueous formats support proteins and growth factors. Oil based formats serve lipid-soluble actives. Powders help shipping stability and reconstitution planning. On 6 October 2025, Lonza announced the launch of TheraPEAK AmpliCell Cytokines and TheraPEAK 293-GT Medium to expand its GMP solutions for cell and gene therapy.
What supports Direct Manufacturer Sales?
Direct Manufacturer Sales are expected to account for 74.2% share in 2026.
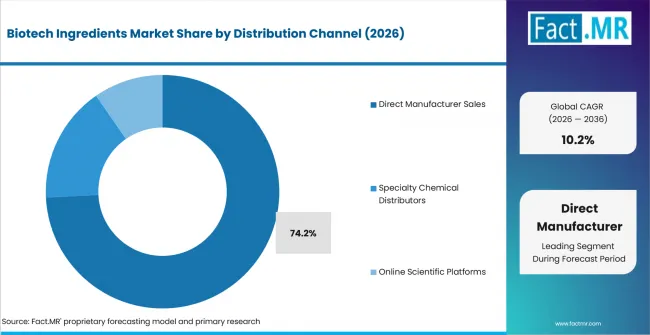
Biotech Ingredients Market Analysis By Distribution Channel | Source: Fact.MR
Direct Manufacturer Sales are expected to lead Distribution Channel because regulated customers require files, quality agreements, and traceability support. Enterprise contracts keep supplier and customer teams aligned. Distributors and online platforms serve smaller laboratories. Evonik announced on 13 March 2025 that it had won the Asia-Pacific Biopharma Excellence Award category “Best Bioprocessing Supplier: Cell Culture Media Ingredients”; the company said the recognition covered its cell-culture ingredient portfolio and associated R&D, formulation, and process expertise.
What is accelerating Biotech Ingredients Market adoption, and what is holding it back?
Biopharmaceutical production drives it; qualification cost restrains it.
Drivers Impact Analysis
| DRIVER | (~) % IMPACT ON CAGR | GEOGRAPHIC RELEVANCE | IMPACT TIMELINE |
|---|---|---|---|
| Biologics production | +2.4% | USA, UK, Germany, South Korea | Short term (<= 2 years) |
| Recombinant protein use | +2.0% | Global biopharma clusters | Short term (<= 2 years) |
| Cell culture scale-up | +1.7% | USA, Japan, South Korea | Medium term (2-4 years) |
| Bio-based beauty ingredients | +1.2% | Europe and USA | Medium term (2-4 years) |
| Molecular diagnostics | +0.9% | Research and hospital lab networks | Long term (>= 4 years) |
Source: Fact.MR analysis. Updated Aug 13, 2026
- Recombinant protein use: Manufacturers value suppliers that support biological activity, purity proof, and lot consistency before specification approval.
- Bio-based beauty ingredients: Givaudan opened a White Biotechnology Innovation Centre in October 2025, while BASF and Bota Biosciences launched SkinNexus Collag3n in June 2026, a recombinant Collagen III fragment produced by yeast fermentation.
- Molecular diagnostics: Nucleic acid ingredients and lipid carriers support assays that require reproducible molecular materials and clean supplier files.
Opportunity Impact Analysis
| OPPORTUNITY | (~) % IMPACT ON CAGR | GEOGRAPHIC RELEVANCE | IMPACT TIMELINE |
|---|---|---|---|
| GMP-linked ingredient systems | +1.3% | USA, Europe, Japan | Short term (<= 2 years) |
| Liquid and ready-use formats | +1.0% | Biopharma sites worldwide | Medium term (2-4 years) |
| Fermentation-derived actives | +0.8% | Europe and North America | Medium term (2-4 years) |
| Direct technical selling | +0.6% | Regulated customer clusters | Long term (>= 4 years) |
Source: Fact.MR analysis. Updated Aug 13, 2026
- GMP-linked ingredient systems: Documentation-ready proteins and cytokines are expected to reduce revalidation work for regulated customers. Media and carriers require the same file depth.
- Liquid and ready-use formats: Liquid ingredients shorten preparation steps and support cleaner transfer between research use and manufacturing use.
- Fermentation-derived actives: BASF and Bota Biosciences announced on 30 June 2026 the launch of SkinNexus Collag3n, a recombinant Collagen III fragment produced through yeast fermentation for personal-care applications.
- Direct technical selling: Direct channels are projected to keep high share because customers need change-control support before replacing qualified inputs.
Restraints Impact Analysis
| RESTRAINT | (~) % IMPACT ON CAGR | GEOGRAPHIC RELEVANCE | IMPACT TIMELINE |
|---|---|---|---|
| Qualification burden | -1.3% | Regulated biopharma sites | Short term (<= 2 years) |
| Batch variability risk | -1.0% | Global ingredient supply | Short term (<= 2 years) |
| Supply disruption exposure | -0.8% | USA, UK, France | Medium term (2-4 years) |
| Cold-chain and shelf-life limits | -0.6% | Liquid and protein formats | Long term (>= 4 years) |
Source: Fact.MR analysis. Updated Aug 13, 2026
- Qualification burden: Switching a biologically active ingredient requires testing and documentation review, which is expected to slow supplier changes.
- Batch variability risk: Proteins and growth factors need tight control before they enter formulation or manufacturing use. Cell culture components face the same review.
- Cold-chain and shelf-life limits: Liquid proteins need controlled storage, while lyophilized powders add preparation steps before use.
Which countries are scaling Biotech Ingredients Market fastest?
- The country comparison spans 1.4 percentage points and forms three practical growth bands across the forecast period.
- The USA remains 0.3 percentage point above South Korea due to biologics approvals and biomedical research depth.
- South Korea remains 0.3 percentage point above Germany as recombinant biopharmaceutical output supports ingredient qualification.
- Germany remains 0.2 percentage point above the UK through health-economy scale and pharmaceutical manufacturing depth.
- The UK remains 0.2 percentage point above Japan because biopharmaceutical turnover remains concentrated in life sciences activity.
- Japan remains 0.1 percentage point above France through pharmaceutical production and regenerative medicine work.
- France remains 0.3 percentage point above Italy, while Italy closes the displayed range through clinical trial and CRO demand.
Comparable CAGRs do not create the same entry conditions. Regulation and clinical research shape each country differently. Medicine production and qualification depth influence entry timing. Local formulation capacity also affects supplier selection. Full report coverage spans North America and Latin America. It also covers Europe and East Asia. South Asia and Pacific and Middle East and Africa complete the frame.
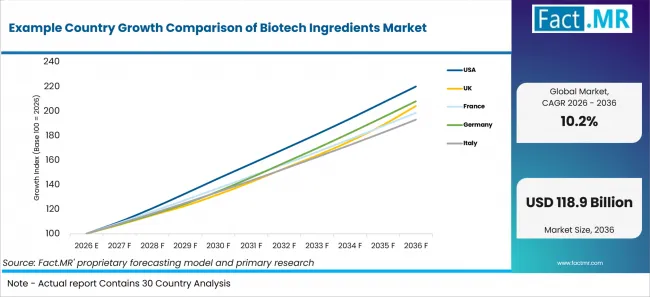
Example Country Growth Comparison Of Biotech Ingredients Market | Source: Fact.MR
| Country | CAGR (2026-2036) |
|---|---|
| USA | 8.2% |
| South Korea | 7.9% |
| Germany | 7.6% |
| UK | 7.4% |
| Japan | 7.2% |
| France | 7.1% |
| Italy | 6.8% |
Source: Fact.MR analysis. Updated Aug 13, 2026
What supports USA adoption?
8.2% CAGR, supported by biologics approvals and biomedical research funding.
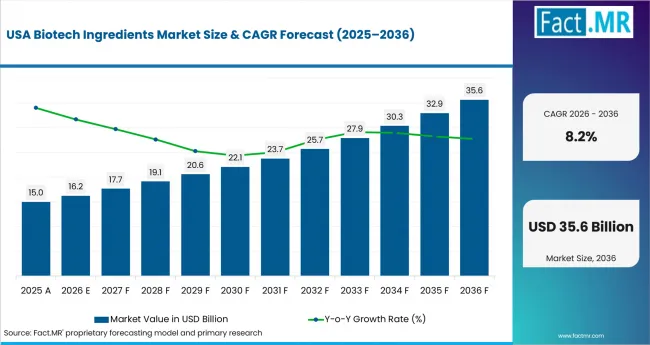
Biotech Ingredients Market Country Value Analysis | Source: Fact.MR
The USA’s growth reflects the assessment of biologics activity and biomedical research depth. Considers these indicators supportive context for demand from laboratories and biopharmaceutical programs using qualified biological inputs.
How is South Korea developing demand?
7.9% CAGR, driven by recombinant biopharmaceutical output and export activity.
South Korea’s growth is tied to biologics manufacturing and the need for reliable recombinant inputs. Large-scale biopharmaceutical manufacturing to support demand for consistent media components and other qualified biological inputs. Growth factors and technical documentation also shape scale-up.
What supports Germany adoption?
7.6% CAGR, shaped by pharmaceutical manufacturing depth and health-economy spending.
Germany’s outlook reflects a high-value health economy with strong regulated manufacturing expectations. Destatis estimated Germany’s 2025 health expenditure at EUR 579.5 billion in a release dated 2 April 2026. This is a broad health-economy indicator; separately expects regulated biopharmaceutical customers to maintain demand for audited material files and stable purity profiles. Direct supply support remains part of procurement review.
How is the UK building demand?
7.4% CAGR, supported by biopharmaceutical turnover and regulatory science capacity.
The UK’s position is supported by life sciences companies that purchase qualified proteins and media inputs. Formulation materials add a second route for ingredient demand. The Office for Life Sciences estimated that companies in the UK biopharmaceutical subsector generated GBP 98.9 billion in turnover in 2023/2024; the publication is designated official statistics in development. Smaller biotech firms are expected to rely on suppliers that support research-to-clinical transfer.
How does Japan perform?
7.2% CAGR, led by pharmaceutical production and regenerative medicine activity.
Japan’s demand reflects careful quality review in pharmaceutical and regenerative medicine programs. The Ministry of Health, Labour and Welfare’s Annual Health, Labour and Welfare Report 2025 lists 1,032 pharmaceutical marketing-authorization-holder licenses as of the end of 2024. Japanese customers are expected to place value on batch consistency and storage stability during ingredient substitution reviews.
What supports France adoption?
7.1% CAGR, supported by clinical trial activity and bioproduction policy focus.
France’s growth is linked to clinical research and bioproduction programs that need qualified inputs. The French Ministry of Higher Education and Research reported on 17 July 2026 that France’s domestic R&D expenditure reached EUR 64.1 billion in 2024.
How does Italy scale demand?
6.8% CAGR, supported by clinical research and multicenter trial activity.
Italy’s demand is tied to CRO activity and pharmaceutical customers that need consistent materials for trial and development work. AIFA reported on 22 July 2026 that 751 clinical trials were evaluated in Italy in 2024 and 669, or 89.1%, were authorized.
Who leads the Biotech Ingredients Market?
Givaudan, IFF, Evonik, BASF, Lonza and Novonesis show the clearest supplier relevance.
Givaudan supports white biotechnology and active beauty ingredients through fermentation. IFF remains relevant through its current bioscience and biotechnology capabilities in engineered proteins, enzymes, and biomolecules; in October 2025, IFF and BASF announced a strategic collaboration on next-generation enzyme technologies. Evonik is relevant through cell culture media ingredients and peptides. BASF supports biotechnology-enabled personal care ingredients. Lonza and Novonesis strengthen the regulated biopharma side through media, cytokines, chromatography, and process support.
Which companies are the key providers?
Key companies include Givaudan SA, International Flavors & Fragrances Inc. (IFF), Evonik Industries AG, BASF SE, Dsm-firmenich, and Novonesis.
- Givaudan SA
- International Flavors & Fragrances Inc. (IFF)
- Evonik Industries AG
- BASF SE
- Dsm-firmenich
- Novonesis
Bibliography
- Agenzia Italiana del Farmaco. (2026, July 22). AIFA pubblica il 22° Rapporto nazionale sulle sperimentazioni cliniche dei medicinali.
- BASF SE. (2025, April 3). BASF launches natural-based innovations for personal care at in-cosmetics Global 2025.
- BASF SE. (2026, June 30). BASF and Bota Biosciences introduce bio-identical Collagen III powered by AI.
- European Medicines Agency. (2026, January 15). Human medicines in 2025.
- Evonik Industries AG. (2025, March 13). Evonik receives Best Bioprocessing Supplier Award for cell culture solutions.
- Givaudan. (2025, October 16). Givaudan inaugurates a new White Biotechnology Innovation Centre in Toulouse, France.
- International Flavors & Fragrances Inc. (2025, October 21). IFF and BASF announce strategic collaboration to drive next-generation enzyme and polymer innovation.
- Lonza. (2025, October 6). Lonza expands its TheraPEAK® product portfolio with the addition of AmpliCell® Cytokine Range and TheraPEAK® 293-GT® Medium.
This Report Answers
- The report provides strategic intelligence on the Biotech Ingredients Market across Product and Application choices that shape biologics, diagnostics, and formulation programs.
- Segment analysis covers Recombinant Proteins and Biopharmaceutical Production as the share leaders within the 2026 market.
- Country outlook evaluates the USA, South Korea, Germany, the UK, Japan, France, and Italy across the displayed growth range.
- Competitive analysis profiles Givaudan and IFF alongside Evonik and BASF. Lonza and Novonesis complete the provider set.
- Technology assessment covers recombinant DNA, cell culture, protein engineering, and bioseparation routes.
What does the Biotech Ingredients Market cover?
Biotech ingredients are biologically derived or biotechnology-enabled inputs used in formulations and cell culture. Diagnostics and biopharmaceutical production also use these inputs. The market covers recombinant proteins and growth factors. Serum components, nucleic acids, and lipid or polymer carriers are included when they serve ingredient use.
The market is closely related to cell culture programs where controlled growth conditions decide ingredient fit. culture media categories overlap where media inputs are sold as qualified materials.
What is included in the scope?
The scope includes Product and Application along with End Use and Technology. Formulation and Distribution Channel complete the segmentation frame. Coverage extends to recombinant supplements and cell culture supplements. Cell expansion inputs are included when they are sold as ingredient systems or qualifying materials.
Related coverage also includes biologics manufacturing and fermented ingredients. Pharmaceutical fermentation and plant molecular platforms are included where the output is used as an input rather than a finished product.
What is excluded from the scope?
Finished medicines and finished cosmetics remain outside the scope. General laboratory equipment and unrelated chemical commodities are also excluded. Downstream drug revenue is excluded unless the company sells ingredient inputs. Ordinary excipients are excluded without a biotechnology link or biological function.
How Was the Analysis Built?
The analysis draws on 120+ sources and 35+ company portfolios. It also reviews 25+ countries and more than 20 industry interviews.
- Primary Research: Primary research includes discussions with manufacturers, technology developers, distributors, end users, procurement teams, and subject-matter experts. These conversations examine purchasing priorities, product adoption, approval requirements, and factors that influence wider market acceptance.
- Desk Research: Desk research covers government statistics, regulator publications, company releases, filings, standards, public policy, and other authoritative sources. Selected public sources cited in this report are documented in the bibliography.
- Market Sizing and Forecasting: Market estimates combine historical values, demand indicators, segment shares, company participation, country-level growth, adoption patterns, investment activity, and barriers to expansion.
- Data Validation and Update Cycle: Findings are validated by comparing public data, company activity, regulatory changes, product launches, approvals, procurement trends, and shifts in commercial adoption.
Segmentation
What is the report’s scope and coverage?
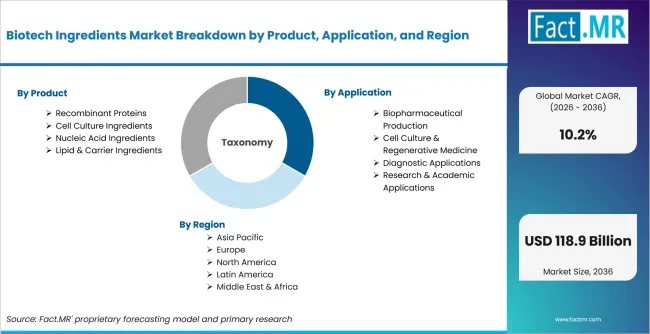
Biotech Ingredients Market Breakdown By Product, Application, And Region | Source: Fact.MR
| Attribute | Details |
|---|---|
| Quantitative Units | USD Billion |
| Market Definition | Bio-based inputs produced or enabled by recombinant proteins, cell culture systems, nucleic acids, lipid carriers, fermentation, and bioseparation. |
| Product | Recombinant Proteins; Cell Culture Ingredients; Nucleic Acid Ingredients; Lipid & Carrier Ingredients |
| Application | Biopharmaceutical Production; Cell Culture & Regenerative Medicine; Diagnostic Applications; Research & Academic Applications |
| End Use | Pharmaceutical & Biotech Companies; Contract Research Organizations; Academic & Research Institutes; Diagnostic Laboratories |
| Technology | Recombinant DNA Technology; Cell Culture Technology; Protein Engineering Technology; Bioseparation Technology |
| Formulation | Liquid Biotech Ingredients; Lyophilized Formulations; Powder Formulations; Nanoparticle Formulations |
| Distribution Channel | Direct Manufacturer Sales; Specialty Chemical Distributors; Online Scientific Platforms |
| Regions Covered | North America; Latin America; Europe; East Asia; South Asia and Pacific; Middle East and Africa |
| Countries Covered | USA; UK; France; Germany; Italy; South Korea; Japan |
| Key Companies Profiled | Givaudan SA; International Flavors & Fragrances Inc.; Evonik Industries AG; BASF SE; Dsm-firmenich; Novonesis |
| Forecast Period | 2026 to 2036 |
| Approach | Hybrid top-down and bottom-up approach using biopharmaceutical input demand; recombinant protein use; cell culture requirements; diagnostics activity; formulation needs; country adoption patterns; and company portfolio review |
Source: Fact.MR analysis. Updated Aug 13, 2026
How is the market segmented?
-
By Product
- Recombinant Proteins
- Therapeutic Proteins
- Enzymatic Proteins
- Cell Culture Ingredients
- Growth Factors
- Serum Components
- Nucleic Acid Ingredients
- DNA Based Ingredients
- RNA Based Ingredients
- Lipid & Carrier Ingredients
- Lipid Nanoparticles
- Polymer Carriers
- Recombinant Proteins
-
By Application
- Biopharmaceutical Production
- Therapeutic Drug Manufacturing
- Vaccine Production
- Cell Culture & Regenerative Medicine
- Stem Cell Applications
- Tissue Engineering
- Diagnostic Applications
- Molecular Diagnostics
- Immunodiagnostics
- Research & Academic Applications
- Life Science Research
- Biomedical Research
- Biopharmaceutical Production
-
By End Use
- Pharmaceutical & Biotech Companies
- Large Pharmaceutical Manufacturers
- Biotechnology Firms
- Contract Research Organizations
- Preclinical Research CROs
- Clinical Research CROs
- Academic & Research Institutes
- University Laboratories
- Government Research Institutes
- Diagnostic Laboratories
- Clinical Diagnostic Labs
- Specialized Testing Labs
- Pharmaceutical & Biotech Companies
-
By Technology
- Recombinant DNA Technology
- Gene Cloning Systems
- Gene Editing Technologies
- Cell Culture Technology
- Suspension Cell Culture
- Adherent Cell Culture
- Protein Engineering Technology
- Protein Expression Systems
- Protein Folding Optimization
- Bioseparation Technology
- Chromatography Systems
- Filtration Systems
- Recombinant DNA Technology
-
By Formulation
- Liquid Biotech Ingredients
- Aqueous Formulations
- Oil Based Formulations
- Lyophilized Formulations
- Freeze Dried Powders
- Powder Formulations
- Nanoparticle Formulations
- Lipid Nanoparticle Systems
- Polymeric Nanoparticles
- Liquid Biotech Ingredients
-
By Distribution Channel
- Direct Manufacturer Sales
- Enterprise Supply Contracts
- Research Institution Sales
- Specialty Chemical Distributors
- Biotech Ingredient Distributors
- Regional Distributors
- Online Scientific Platforms
- B2B Scientific Marketplaces
- Manufacturer E Portals
- Direct Manufacturer Sales
-
By Region
- North America
- Latin America
- Western Europe
- Eastern Europe
- East Asia
- South Asia and Pacific
- Middle East & Africa
Frequently Asked Questions
How big is the biotech ingredients market in 2026?
What is the CAGR of the biotech ingredients market from 2026 to 2036?
Which product leads the biotech ingredients market?
Which application leads the biotech ingredients market?
Who are the leading companies in the biotech ingredients market?
Who worked on this report


Preview the report firsthand - request a free sample
Free SampleGet the brochure for pricing and purchase details
Download PDF