


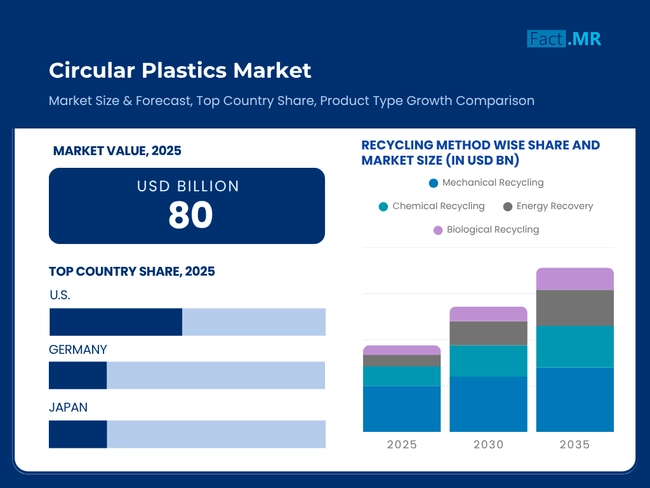
- Base Value(2025): 80 Bn
- Forecast Value (2035): 198 Bn
- CAGR (2035): 9.8%
Circular Plastics Market Outlook from 2025 to 2035
The global circular plastics market is expected to reach USD 198 billion by 2035, up from USD 73 billion in 2024. During the forecast period 2025 to 2035, the industry is projected to expand at a CAGR of 9.5%.
Circular plastic is a critical component of the global sustainability shift, motivating the reuse of materials, reducing waste, and lowering carbon emissions. It is at the forefront of achieving zero-waste and ESG targets in areas such as packaging, automotive, and consumer goods, benefiting from regulatory requirements, increasing brand commitments, and innovations in recycling, which make it a key pillar of the new circular economy model.
What are the drivers of the circular plastics market?
Circular plastics have a market driven by the convergence of regulatory requirements, technological advancements, and corporate sustainability efforts aimed at reducing plastic waste and carbon emissions. The EU Plastics Strategy, Extended Producer Responsibility (EPR), and national governments' actions to prohibit single-use plastics are prompting industries to utilize recycled content and material loops through government regulation.
Mandatory recycled content targets are also on the rise among large consumer brands as part of meeting ESG benchmarks and addressing the growing trend of consumer demand for environmentally responsible products.
Additionally, investments in material recovery facilities and public-private cooperation are promoting higher collection rates and supplies of recycled materials. These drivers, together, are shifting the plastic value chain model into a circular one, with the help of which waste can be turned into a resource, which is crucial for climate action and long-term resource efficiency.
What are the regional trends of the circular plastics market?
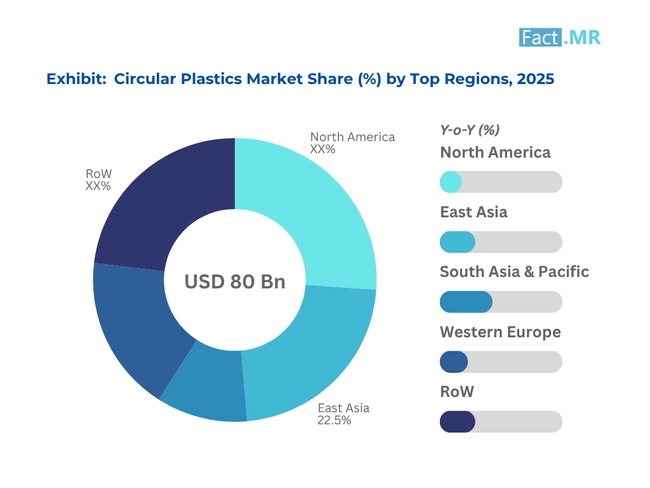
The different regulatory maturity and infrastructural preparedness as well as industry priorities determine their regional trends on the circular plastics market. In North America, and particularly in the USA, there is a growing momentum by state-enforced Extended Producer Responsibility (EPR) laws and brand-led demand of post-consumer recycled content. Advanced recycling and material recovery plants are now being invested in, also speeding up domestic circularity.
Europe is still one of the leaders with the EU Circular Economy Action Plan, and states such as Germany and the Netherlands implement massive recycled content regulations as well as strict green procurement policies. Well-developed recycling infrastructure along with the support of the policy in the context of innovation in chemical recycling is a plus of the region.
Countries such as Japan, China and India in Asia-Pacific are adding circular plastics into the larger environment and industrial policies. Green Growth Strategy is one of the important driving forces in Japan and dual carbon objectives in China. Southeast Asia is yet to develop infrastructure but it is attracting international assistance to enhance collection systems.
What are the challenges and restraining factors of the circular plastics market?
The circular plastics market is associated with several issues that hinder its large-scale adoption. The higher prices of recycled plastics compared to virgin resins are one of the main obstacles, as it becomes a challenge for manufacturers to meet the cost of switching to recycled plastics, particularly in the sensitive domain of costs.
Inconsistencies in the quality of feedstock, such as the result of poor sorting, contamination, or degradation of polymer chains, further limit the opportunities to use it in high-performance applications, including food-grade packaging.
Mechanical recycling is limited by technological constraints that diminish its efficiency and product spectrum; e.g., weakness in a range of complex or multilayer materials. The more promising chemical recycling is less costly and remains less controversial in terms of its environmental impact, energy output, and scaling potential.
The lack of infrastructure, particularly in developing regions, affects the collection, processing, and reintegration of materials into the supply chain. Consumer skepticism about the safety and performance of recycled materials also persists. Overcoming these obstacles requires coordinated policy support, innovation in recycling technology, and robust investment in waste management systems.
Country-Wise Insights
United States Policy Acceleration and Corporate Circularity Efforts
United States has seen a boom in the adoption of circular plastics largely due to Extended Producer Responsibility (EPR) policies at the state level and Federal sustainability mandates. Packaging trends are shifting towards the use of a minimum amount of recycled content in major corporations, and increasingly more purchasing rules are requiring the use of PCR-based materials. Such a policy environment spurs demand in areas like food packaging, consumer goods and retail, among others.
It also boasts industry leadership, with firms investing in local chemical recycling plants to treat intractable feedstocks, such as multilayer films. Refill and take-back programs are piloted by major brands that emphasize circular packaging loops. Moreover, partnerships such as the USA Plastic Pact are developing national targets of circularity and recovery.
Recycling centers are already co-located with manufacturing centers in Texas, Ohio, and California to minimize transportation miles and emissions. Research and development funding (R&D) grants by the government and investment in privately held ventures are growing faster in areas such as sorting technology, traceability tools, and performance-optimized circular resins.
Germany’s Circular Framework Backed by EU Packaging Regulations
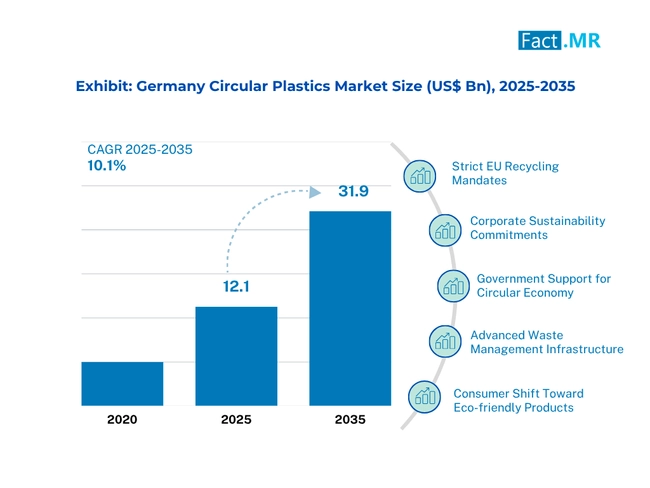
Germany also remains a strong foundation in the circular plastics movement in Europe, thanks to its Packaging Act and the EU Circular Economy Action Plan. The country has developed decades-old dual systems of collections, which effectively segregate and recycle plastic streams. The national requirements mandate that manufacturers incorporate documented recycled content into packaging and industrial parts.
The country's strong industrial foundation enables the integration of recycling and manufacturing processes vertically. Major chemical and material companies are developing advanced technology to facilitate closed-loop recycling of PET, HDPE, and polyolefins. Certified eco-labeling schemes and digital product passports enable purchasers to understand which materials are actually circular.
There is also pressure to achieve polymer innovation, furthering the harmony between recyclable and high-performance polymer innovation by German research institutions and industrial clusters. The incentives of circular designing, modularity, and lifecycle assessments provided by the government make Germany an example in circular supply chains, which spills over into the surrounding markets in the EU and establishes competitive edges in the sustainability of materials.
Japan’s Net-Zero Commitment Advancing Circular Plastic Solutions
Japan has its sights set on circular plastics as part of its net-zero strategy outlined in its Green Growth Strategy. National policies encourage a decrease in single-use plastics and propose increasing the recycling rate by two times by 2030. Such policies are incorporated into industrial structures, and the reuse of plastic becomes an official part of ESG corporate compliance plans and decarbonization strategies.
The nation leads in mono-material and biodegradable polymer technology, whereby circularity on most items is frequently combined with a high technical level. The Green Innovation Fund also funds pilot projects to recycle packaging waste into value-added products, serving as feedstock for use in electronics, vehicle components, and packaging. The speed of this innovation cycle is accelerated through partnerships among academia, industry, and government.
Japan is also going green in the recycling field, exploring hydrogen-powered and solar-powered plants to maximize energy efficiency in processing operations. Plastic resin traceable systems are also being implemented to comply with international exporting and purchasing requirements. This combination of interest in clean energy and material circularity positions Japan as an emerging leader in sustainable plastics infrastructure.
Category-Wise Analysis
Polyethylene (PE): Cornerstone Polymer Driving Circular Packaging Innovation
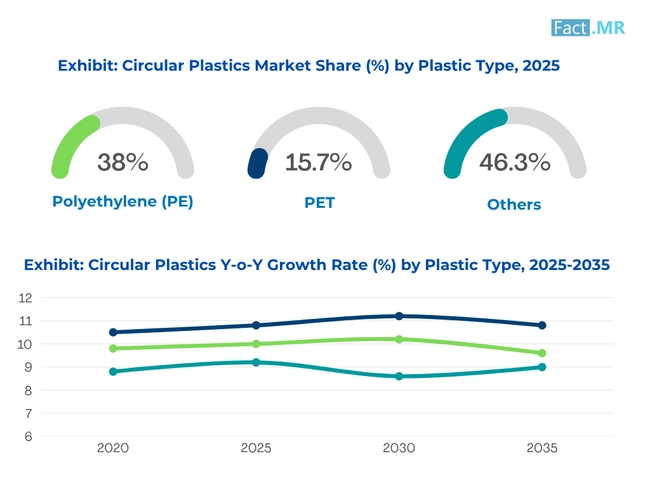
The most common type of plastic in the world, polyethylene (PE), is at the center of the circular plastics market due to its flexibility, stable supply levels, and capacity to be recycled using existing technologies. It is mainly applied in film, bottles, containers, and flexible packaging applications. HDPE (High-Density) and LDPE (Low-Density) grades are applicable to special value in the packaging, agricultural, and household products sectors.
The broad use of PE in the circular economy model makes the priority in the recovery and reprocessing. Mechanical recycling of PE is established, particularly for rigid HDPE containers and LDPE films. Nevertheless, sorters and washing systems can be advanced, and encounters with contamination and degradation issues may necessitate more sophisticated systems to maintain material quality.
In addition to scaling PE-based products to be recycling-friendly, the mono-material packaging design is also being incorporated. Market growth is also supported by brand commitments to include minimum recycled PE content, with regulatory backing in North America and the EU driving procurement reforms.
Post-Consumer Recycled (PCR) Plastics: Core Feedstock Powering End-User Material Recovery
Post-consumer recycled (PCR) plastics are materials collected from end-user waste streams, such as municipal recycling and take-back programs. The PCR content becomes a deciding factor in completing the loop in plastic value chains, particularly in packaging, textiles, and consumer items. It is also becoming increasingly legislated in the major world markets through eco-labeling.
The plastics produced by PCR can help meet decarbonization goals by reducing the production of virgin plastic resins and eliminating the resulting emissions. In the circular plastics market, post-consumer materials such as PET, HDPE, and LDPE are often recycled into both non-food-grade and food-grade applications through reprocessing and certification.
Competitive Analysis
Key players in the circular plastics industry include Veolia Environnement S.A., SUEZ Group, Borealis AG, Indorama Ventures Public Company Limited, Plastipak Holdings, Inc., Loop Industries, Inc., LyondellBasell Industries N.V., ALPLA Group, MBA Polymers, Inc., Trex Company, Inc., PreZero International GmbH, and Avangard Innovative LP.
The plastics recycling industry has been increasingly competitive, with market players rushing to position themselves in line with the worldwide sustainability goal and environmental regulations. The players in the market are investing in high-tech recycling technologies, such as chemical and enzyme processes, to manage more difficult types of waste feedstock and increase the number of suitable feedstocks. Tracing origination, eco scores (labeling), and reuse ratings are being innovated to deliver trust and product differentiation in high-volume industries such as packaging and automotive.
Value-chain strategic collaboration through relationships among recyclers, converters, and final products manufacturers is promoting large-scale circularity. Waste collection and waste processing are becoming the centre of mergers and acquisition deals. A company that focuses on closed-loop systems and traceable material inputs, to enable the fulfillment of ESG and circularity reporting requirements, is further increasing pressure on slow-moving adopters.
Recent Development
- In June 2025, Veolia's PlastiLoop platform launched initiatives on World Environment Day to convert hard-to-recycle plastic waste into high-quality recycled resins. This includes a chemical recycling pilot in Europe and partnerships with packaging brands to integrate PlastiLoop resin into consumer products, aiming to divert billions of tonnes of ocean-bound and post-industrial plastics into closed-loop supply chains.
- In May 2024, Loop Industries and Ester Industries announced a 50:50 joint venture to build India’s first Infinite Loop™ manufacturing facility. The USD 165 billion plant, utilizing Loop’s patented technology, was set to produce 73,000 tpa of recycled dimethyl terephthalate (rDMT) and 23,000 tpa of recycled mono-ethylene glycol (rMEG) by early 2027, targeting the underserved USD 28 billion Indian market for PET feedstocks.
Fact.MR has provided detailed information about the price points of key manufacturers in the Circular Plastics Market, positioned across regions, including sales growth, production capacity, and speculative technological expansion, in the recently published report.
Methodology and Industry Tracking Approach
The 2025 circular plastics market report by Fact.MR is based on insights gathered from 3,800 stakeholders across 20 countries, with a minimum of 120 respondents per country. Of these participants, 60% were end users, including packaging manufacturers, consumer goods companies, automotive suppliers, and construction material producers, while the remaining 40% comprised sustainability managers, procurement heads, product designers, and regulatory compliance officers.
Data collection took place between June 2024 and May 2025, focusing on essential criteria such as recyclability of materials, processing efficiency, lifecycle emissions, compatibility with circular design principles, and adherence to evolving global packaging and waste management regulations. A regionally weighted calibration model was used to ensure balanced representation across leading consumption and recycling regions.
The analysis drew from over 130 validated sources, including policy white papers, environmental certification databases, circular economy reports, technical datasheets, and ESG disclosures from leading manufacturers. These sources were triangulated to ensure precise market estimates and deliver comprehensive, reliable insights.
Fact.MR applied rigorous analytical tools, such as multivariate regression and scenario modeling, to ensure data robustness. With continuous monitoring of the glass adhesives market since 2018, this report provides a comprehensive roadmap for firms seeking a competitive advantage, innovation, and sustainable growth within the sector.
Segmentation of Circular Plastics Market
-
By Plastic Type :
- Polyethylene (PE)
- High-Density Polyethylene (HDPE)
- Low-Density Polyethylene (LDPE)
- Polyethylene Terephthalate (PET)
- Polypropylene (PP)
- Polystyrene (PS)
- Polyvinyl Chloride (PVC)
- Others
- Polyethylene (PE)
-
By Recycling Method :
- Mechanical Recycling
- Chemical Recycling
- Energy Recovery
- Biological Recycling
-
By Source of Recycled Plastic :
- Post-Consumer Recycled (PCR) Plastics
- Post-Industrial Recycled (PIR) Plastics
- Ocean-Bound & Marine Plastic Waste
- Commercial Collection Systems
-
By Application :
- Packaging
- Textiles
- Automotive
- Building & Construction
- Consumer Goods
- Agriculture
- Industrial Components
-
By Region :
- North America
- Latin America
- Western Europe
- Eastern Europe
- East Asia
- South Asia & Pacific
- Middle East & Africa
- Frequently Asked Questions -
What was the Global Circular Plastics Market Size Reported by Fact.MR for 2025?
The global circular plastics market was valued at USD 80 billion in 2025.
Who are the Major Players Operating in the Circular Plastics Market?
Prominent players in the market are Veolia Environnement S.A., SUEZ Group, Borealis AG, Indorama Ventures Public Company Limited, among others.
What is the Estimated Valuation of the Circular Plastics Market in 2035?
The market is expected to reach a valuation of USD 198 billion in 2035.
What Value CAGR did the Circular Plastics Market Exhibit Over the Last Five Years?
The historic growth rate of the circular plastics market was 9.0% from 2020 to 2024.