- Market Value (2025): USD 4.4 Bn
- Estimated Value (2026): USD 5.2 Bn
- Forecast Value (2036):USD 26.0 Bn
- CAGR (2026-2036): 17.4%
What is the Distributed EV Chargers Market forecast to be worth by 2036?
USD 5.2 billion in 2026 to USD 26.0 billion by 2036 at a 17.4% CAGR.
- The Distributed EV Chargers Market reached USD 4.4 billion in 2025.
- Demand to increase from USD 5.2 billion in 2026 to USD 26.0 billion by 2036.
- The market is forecast to record 17.4% CAGR from 2026 to 2036 as site hosts, charge-point operators, fleets, property owners, utilities and electrical contractors expand qualified purchasing and deployment.
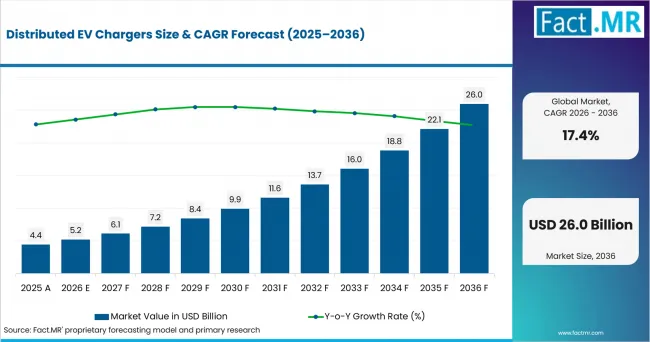
Distributed Ev Chargers Value Analysis | Source: Fact.MR
What are the defining numbers behind Distributed EV Chargers Market growth?
An absolute opportunity of USD 20.8 billion is expected between 2026 and 2036.
- Demand Drivers in the Market
- Workplaces and commercial properties are adding charging across many small sites, increasing demand for repeatable hardware and centralized operating software.
- Load management lets hosts stage more ports behind constrained electrical service, improving the economics of distributed installations.
- Key Segments Analyzed
- By Charger Type: AC Level 2 is expected to hold 42.0% share in 2026 because Level 2 equipment suits long dwell periods and can be distributed across workplace and destination charging sites.
- By Power: <22 kW is projected to account for 39.0% share in 2026 as lower-power charging aligns with overnight, workday and destination dwell while limiting service-upgrade requirements.
- By Site: Workplace / commercial is anticipated to capture 29.0% share in 2026 because commercial properties can combine employee, fleet and visitor charging while sharing parking, power and network-management infrastructure.
- By Network Architecture: Cloud-managed is estimated to represent 48.0% share in 2026 because cloud management gives multi-site operators remote visibility, pricing, access and load control across dispersed charging assets.
- Analyst Opinion at Fact.MR
- Shambhu Nath Jha, Principal Consultant, Fact.MR, states, "Distributed charging is an operations market as much as a hardware market. Site owners need fleetwide visibility, load control and maintainable equipment across locations that rarely have identical electrical conditions."
- Strategic Implications
- Managed charging can enforce a power ceiling across multiple EVSE and help sites operate within existing electrical capacity, reducing or deferring equipment upgrades.
- Workplace charging often favors Level 2 because vehicle dwell times align with the workday, while distributed sites still require clear access, operating and maintenance policies.
- Public-charging deployments should separate curbside and other publicly accessible use cases from private workplace or residential charging because regulatory requirements differ by jurisdiction.
- Fleet and multi-site charging systems should be evaluated for remote monitoring, diagnostics, control and smart-charge-management capability, not only charger hardware.
- High-power public and depot systems should be assessed separately from lower-power distributed installations so that power architecture, site utilization and service requirements are not conflated.
How does the Distributed EV Chargers Market break down by segment?
The Distributed EV Chargers Market is analyzed by Charger Type, Power, Site, and Network Architecture.
Which Charger Type dominates?
AC Level 2 is expected to hold 42.0% share in 2026.
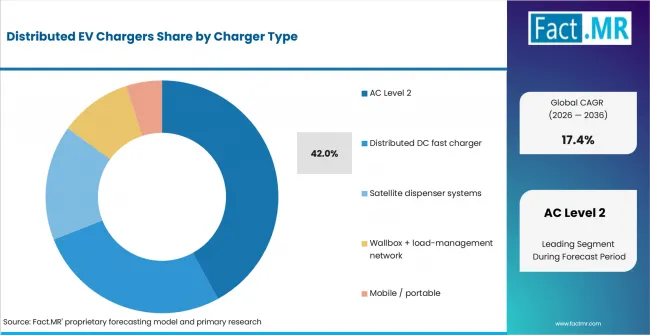
Distributed Ev Chargers Analysis By Charger Type | Source: Fact.MR
AC Level 2 leads because it fits long dwell periods at workplaces, commercial properties and destination sites, where vehicles can remain connected for several hours. Its lower power requirement also makes it easier to distribute charging capacity across multiple parking spaces without relying on high-power infrastructure.
The segment also benefits from its compatibility with multifamily load-sharing strategies and other distributed charging models. Its growth depends on how effectively suppliers address site permitting, electrical-capacity constraints and utility-upgrade requirements that can otherwise increase project cost and deployment time.
What leads the Power segment?
<22 kW is projected to account for 39.0% share in 2026.
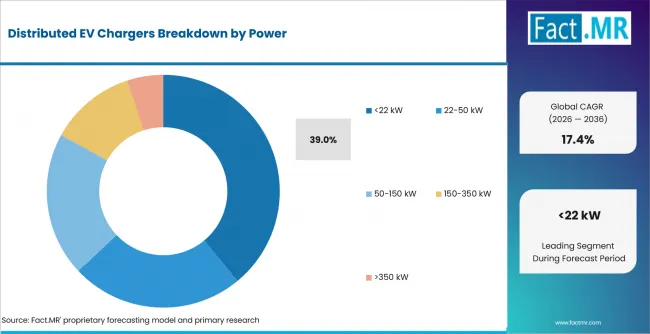
Distributed Ev Chargers Analysis By Power | Source: Fact.MR
Sub-22 kW charging leads because it aligns well with overnight, workday and destination dwell patterns. Lower charging power can also reduce service-upgrade requirements, making it practical for sites that want to install several charging points within existing electrical-capacity limits.
The category becomes more valuable when combined with fleet-depot orchestration and intelligent load management. Suppliers that can coordinate several chargers while managing payment, roaming and operating complexity are better positioned to convert lower-power charging into scalable multi-site deployments.
How does Site shape demand?
Workplace / commercial is anticipated to lead with 29.0% share in 2026.
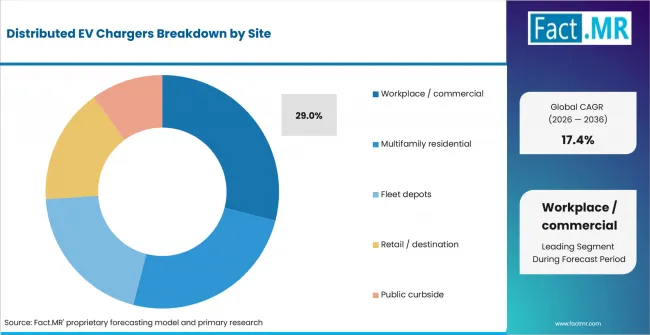
Distributed Ev Chargers Analysis By Site | Source: Fact.MR
Workplace and commercial sites lead because they can serve employees, fleet vehicles and visitors using shared parking, electrical infrastructure and network management. This creates recurring demand for commercial EV charging infrastructure that can support several user groups within one operating environment.
The segment also creates opportunities for centralized access control, load management and remote monitoring. Adoption depends on site utilization, available electrical capacity and whether operators can achieve sufficient charger usage while avoiding excessive costs associated with underused locations.
What supports Cloud-managed within Network Architecture?
Cloud-managed is estimated to represent 48.0% share in 2026.
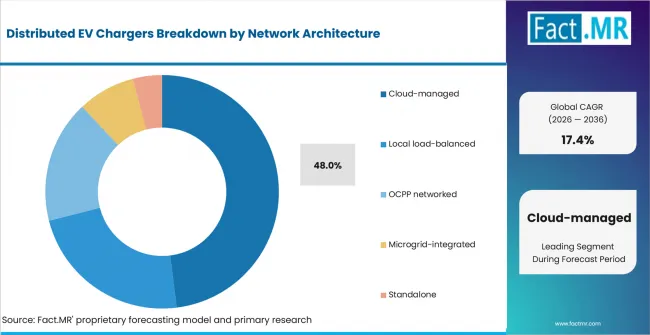
Distributed Ev Chargers Analysis By Network Architecture | Source: Fact.MR
Cloud-managed architecture leads because multi-site operators need centralized visibility across dispersed chargers. Remote status monitoring, pricing, user access and load control allow operators to manage multiple locations through one software environment rather than relying on separate local systems.
The model becomes more valuable as operators integrate demand-response functions, diagnostics and smart charging across distributed assets. Wider adoption depends on reliable field maintenance, auditable utility integration and the ability of charging-management platforms to maintain consistent control across sites with different electrical and operating conditions.
What is accelerating Distributed EV Chargers Market adoption, and what is holding it back?
Workplace and commercial charging, managed charging and public-charging policy requirements as adoption drivers. The model treats site permitting and utility upgrades, payment and roaming complexity, low-utilization economics and field maintenance across dispersed sites as constraints.
Drivers Impact Analysis
| DRIVER | (~) % IMPACT ON CAGR | GEOGRAPHIC RELEVANCE | IMPACT TIMELINE |
|---|---|---|---|
| Workplace and commercial charging across many small sites | +3.1% | Global | Short term (<= 2 years) |
| Managed charging behind constrained electrical service | +2.4% | USA and Germany | Medium term (2-4 years) |
| EU AFIR and U.S. federal EV-charging requirements | +1.9% | Germany (EU) and USA | Long term (>= 4 years) |
Opportunity Impact Analysis
| OPPORTUNITY | (~) % IMPACT ON CAGR | GEOGRAPHIC RELEVANCE | IMPACT TIMELINE |
|---|---|---|---|
| Multifamily load sharing | +2.1% | Global | Medium term (2-4 years) |
| Fleet depot orchestration | +1.7% | USA and Germany | Short term (<= 2 years) |
| Curbside charging | +1.4% | Germany and UK | Long term (>= 4 years) |
| Utility demand-response integration | +1.0% | Global | Medium term (2-4 years) |
Restraints Impact Analysis
| RESTRAINT | (~) % IMPACT ON CAGR | GEOGRAPHIC RELEVANCE | IMPACT TIMELINE |
|---|---|---|---|
| Site permitting and utility upgrades | -1.6% | Global | Short term (<= 2 years) |
| Payment and roaming fragmentation | -1.2% | USA and Germany | Medium term (2-4 years) |
| Low-utilization locations | -1.0% | Global | Long term (>= 4 years) |
| Field maintenance at dispersed sites | -0.7% | UK and France | Medium term (2-4 years) |
Which countries are scaling the Distributed EV Chargers Market through 2036?
- The country comparison spans 2.0 percentage points and forms three practical growth bands across the forecast period.
- Italy remains 1.1 percentage points above France as Recovery and Resilience Plan support for public fast-charging deployment strengthens the country’s charging infrastructure pipeline.
- France remains 0.3 percentage point above the UK through continued expansion of public and private charging across collective housing, businesses and other distributed sites.
- The UK remains 0.3 percentage point above the USA as public charge-point requirements support pricing transparency, payment, roaming, open-data access and reliability across publicly accessible charging.
- The USA remains 0.3 percentage point above Germany as AC Level 2 deployment, managed charging and coordination within existing electrical capacity support distributed charging adoption.
- Germany closes the displayed range as Deutschlandnetz expands high-power charging infrastructure while fleet-depot orchestration and payment and roaming complexity shape the wider distributed-charging opportunity.
Comparable CAGRs can create different entry conditions due to site electrical capacity, utility coordination, charging regulations, network architecture and project economics. Full report coverage includes North America, Latin America, Western Europe, Eastern Europe, East Asia, South Asia & Pacific, Middle East & Africa.
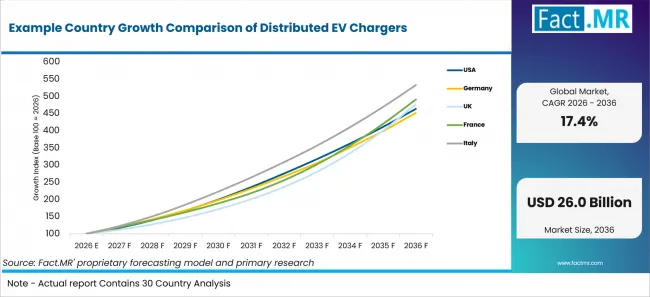
Example Country Growth Comparison Of Distributed Ev Chargers | Source: Fact.MR
| Country | CAGR (2026-2036) |
|---|---|
| USA | 16.6% |
| Germany | 16.3% |
| UK | 16.9% |
| France | 17.2% |
| Italy | 18.3% |
What supports USA adoption?
16.6% CAGR, supported by AC Level 2 deployment, managed charging and coordinated use of existing electrical capacity.
U.S. federal EV-charging requirements under 23 CFR Part 680 establish standards for payment, interoperability, network connectivity, data and uptime across covered federally funded charging infrastructure. This regulatory foundation supports distributed deployment, while managed charging helps site operators coordinate multiple chargers within available electrical capacity and control infrastructure-upgrade requirements.
What is supporting Germany’s adoption?
16.3% CAGR, supported by expanding charging infrastructure and fleet-depot orchestration.
Germany’s Deutschlandnetz is strengthening the country’s public fast-charging network by adding around 9,000 ultra-fast HPC charging points at more than 1,000 locations nationwide. This infrastructure expansion broadens charging availability, while distributed-market opportunities increasingly depend on fleet-depot orchestration, network management and effective handling of payment and roaming requirements.
What supports the United Kingdom’s growth?
16.9% CAGR, backed by public-charging regulation and expanding curbside deployment.
The Public Charge Point Regulations establish requirements covering pricing transparency, payment, open data, roaming and reliability for publicly accessible charging. These operating standards support greater consistency across public and curbside networks, while workplace charging creates a separate opportunity for managed systems tailored to private-site access and operating requirements.
How is France developing demand?
17.2% CAGR, driven by continued expansion of public and private charging infrastructure.
France’s 2026 electrification plan reported 2.8 million charging points nationwide, including more than 185,000 publicly accessible charging points. Continued support for collective housing, businesses and public locations strengthens distributed deployment, while cloud-managed systems and demand-response capabilities create opportunities to coordinate charging assets across multiple sites.
How does Italy perform?
18.3% CAGR, led by public fast-charging investment and wider infrastructure deployment.
Italy’s Recovery and Resilience Plan is supporting expansion of public fast-charging infrastructure, with contracts awarded for 9,966 public fast-charging points of at least 90 kW in urban areas under milestone M2C2-28. This investment strengthens the broader charging network, while distributed adoption also depends on site permitting, utility coordination and efficient management of charging capacity across locations.
Who leads the Distributed EV Chargers Market?
Companies with current EV-charging offerings relevant to the Distributed EV Chargers Market include ChargePoint, Wallbox, ABB E-mobility, Siemens, Schneider Electric, and Delta Electronics.
Current portfolios span cloud-managed workplace and multifamily charging, split-system DC fast charging, AC/DC commercial charging and charging-management software. Their active offerings support inclusion across the report's hardware and network-management scope.
Buyer evaluation should focus on remote management, load-control, interoperability, service support and maintainability across dispersed sites after the first installation.
Which companies are the key providers?
Key companies include ChargePoint, Wallbox, ABB E-mobility, Siemens, Schneider Electric, and Delta Electronics.
- ChargePoint
- Wallbox
- ABB E-mobility
- Siemens
- Schneider Electric
- Delta Electronics
Bibliography
- International Energy Agency. (2026, May 20). Global EV Outlook 2026.
- Federal Highway Administration. (2025). National Electric Vehicle Infrastructure Standards and Requirements (23 C.F.R. pt. 680).
- Office for Zero Emission Vehicles, & Department for Transport. (2024, October 21). The Public Charge Point Regulations 2023 guidance.
- Bundesministerium für Verkehr. (2026, April 22). Deutschlandnetz: Schnellladen für E-Autos bundesweit.
- Gouvernement français. (2026, April). Pour une énergie moins chère, plus souveraine et plus durable [Dossier de presse].
- European Commission. (2025, July 31). Commission Implementing Decision of 31.7.2025 on the authorisation of the disbursement of the seventh instalment of the non-repayable support and the seventh instalment of the loan support for Italy (C(2025) 5440 final).
- Bennett, J., Hodge, C., & Kotz, E. (2025, August). Federal Workplace Charging Program Guide. U.S. Department of Energy, Federal Energy Management Program.
- Bennett, J. (2024). Smart charge management [Presentation] (NREL/PR-5400-89220). National Renewable Energy Laboratory.
- ChargePoint. (2026). EV charging solutions for your workplace [Infographic].
- Wallbox. (2026, July 30). Pulsar Pro 2026 – Products Overview.
- ABB E-mobility. (2026, April 23). ABB E-mobility launches OM M-Series, reframing charging infrastructure around the economics of delivered energy.
- Siemens. (2025, October 4). SICHARGE FLEX: Siemens unveils Next-Gen EV Charging System for the Megawatt era.
- Schneider Electric. (2026, February 15). Schneider Electric launches EVlink Pro DC 720: High-Power EV charging for all road users.
- Delta Electronics, Inc. (2026, March 30). 2025 annual report.
This Report Answers
- The report explains how the Distributed EV Chargers Market develops across Charger Type and Power.
- Segment analysis identifies AC Level 2 and <22 kW as the principal 2026 reference points.
- Country analysis examines USA, Germany, UK, France, and Italy.
- Competitive analysis reviews ChargePoint, Wallbox, ABB E-mobility, Siemens, Schneider Electric, and Delta Electronics.
- Opportunity analysis covers multifamily load sharing, fleet depot orchestration, curbside charging, and utility demand-response integration.
- Risk analysis evaluates site permitting and utility upgrades, payment and roaming fragmentation, low-utilization locations, and field maintenance at dispersed sites.
What does the Distributed EV Chargers Market cover?
The Distributed EV Chargers Market covers AC and DC charging equipment, embedded connectivity and charging-management subscriptions used across distributed multi-site networks.
Commercial coverage follows purchases made by site hosts, charge-point operators, fleets, property owners, utilities and electrical contractors. Revenue is counted when the qualifying product, platform or integrated system is supplied for an in-scope application.
What is included in the scope?
The scope includes AC and DC charging equipment, embedded connectivity and charging-management subscriptions used across distributed multi-site networks across Charger Type, Power, Site, and Network Architecture.
Inclusions extend to configuration and integration elements that are inseparable from the in-scope commercial offer. The boundary is applied consistently across USA, Germany, UK, France, and Italy and the seven global regions.
What is excluded from the scope?
The scope excludes vehicle onboard chargers, electricity resale, site civil works, non-networked sockets and centralized heavy-duty megawatt hubs.
Adjacent categories enter the Distributed EV Chargers Market only when the sold product or service performs the defining function described above. This prevents broader equipment, chemical, software or project revenue from being counted twice.
How Was the Analysis Built?
The analysis draws on 120+ sources, 35+ company portfolios, 25+ countries, and more than 20 industry interviews.
- Primary Research: Primary research includes discussions with manufacturers, service providers, technology developers, distributors, end users, and subject-matter experts. These conversations examine purchasing priorities, product adoption, operational challenges, approval requirements, competitive positioning, and the factors that influence wider market acceptance.
- Desk Research: Desk research covers government statistics, regulatory publications, company filings, trade data, technical studies, industry associations, standards, public policy, and other authoritative sources. Every source used in the analysis is documented in the bibliography.
- Market Sizing and Forecasting: Market estimates combine historical performance, demand indicators, pricing and volume trends, segment shares, company participation, country-level growth, adoption patterns, investment activity, and barriers to market expansion.
- Data Validation and Update Cycle: Findings are validated by comparing primary interviews with public data, company activity, regulatory changes, trade patterns, and industry developments. Regular updates review new product launches, capacity changes, partnerships, approvals, and shifts in commercial adoption.
What is the report's scope and coverage?
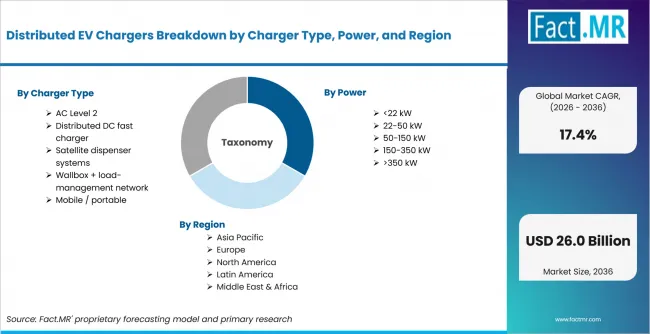
Distributed Ev Chargers Breakdown By Charger Type, Power, And Region | Source: Fact.MR
| Attribute | Details |
|---|---|
| Quantitative Units | USD Billion |
| Market Definition | Networked charging points deployed across workplaces, commercial sites, multifamily buildings, fleets and public destinations with coordinated software management. |
| Charger Type | AC Level 2; Distributed DC fast charger; Satellite dispenser systems; Wallbox + load-management network; Mobile / portable |
| Power | <22 kW; 22-<50 kW; 50-<150 kW; 150-350 kW; >350 kW |
| Site | Workplace / commercial; Multifamily residential; Fleet depots; Retail / destination; Public curbside |
| Network Architecture | Cloud-managed; Local load-balanced; OCPP networked; Microgrid-integrated; Standalone |
| Regions Covered | North America; Latin America; Western Europe; Eastern Europe; East Asia; South Asia & Pacific; Middle East & Africa |
| Countries Covered | USA; Germany; UK; France; Italy |
| Key Companies | ChargePoint; Wallbox; ABB E-mobility; Siemens; Schneider Electric; Delta Electronics |
| Forecast Period | 2026 to 2036 |
| Approach | Hybrid top-down and bottom-up assessment using Charger Type, Power, Site, and Network Architecture, country deployment, replacement demand and company participation. |
How is the market segmented?
-
By Charger Type
- AC Level 2
- Distributed DC fast charger
- Satellite dispenser systems
- Wallbox + load-management network
- Mobile / portable
-
By Power
- <22 kW
- 22-<50 kW
- 50-<150 kW
- 150-350 kW
- >350 kW
-
By Site
- Workplace / commercial
- Multifamily residential
- Fleet depots
- Retail / destination
- Public curbside
-
By Network Architecture
- Cloud-managed
- Local load-balanced
- OCPP networked
- Microgrid-integrated
- Standalone
-
By Region
- North America
- Latin America
- Western Europe
- Eastern Europe
- East Asia
- South Asia & Pacific
- Middle East & Africa