- Market Value (2025): USD 38.1 Bn
- Estimated Value (2026): USD 40.8 Bn
- Forecast Value (2036): USD 81.1 Bn
- CAGR (2026-2036): 7.1%
What is the Farm Implements Market forecast to be worth by 2036?
USD 40.8 billion in 2026 to USD 81.1 billion by 2036, at 7.1% CAGR.
- The Farm Implements Market crossed a valuation of USD 38.1 billion in 2025 as growers renewed implements across soil preparation and planting work.
- Demand is projected to increase from USD 40.8 billion in 2026 to USD 81.1 billion by 2036.
- The market is forecast to record a 7.1% CAGR from 2026 to 2036 as growers and contractors replace worn tools and add precision-ready attachments.
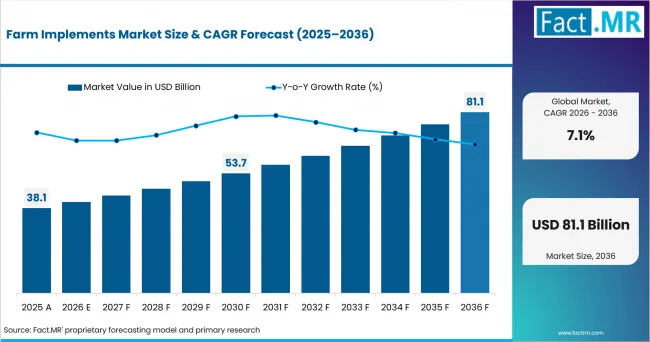
Farm Implements Market Market Value Analysis | Source: Fact.MR
What are the defining numbers behind Farm Implements Market growth?
USD 40.3 billion absolute opportunity by 2036 is led by Tractor-mounted equipment and Large Farms.
- Demand Drivers in the Market
- Growers need implements matched to tractor horsepower because field productivity depends on covering acreage inside narrow soil and weather windows.
- Custom contractors require durable frames and quick wear-part replacement owing to high seasonal utilization across several farms and crop calendars.
- Cooperatives need implements that members reset quickly, supported by clear controls for shared fleets moving between tractors and field conditions.
- Dealers need full attachment ranges reinforced by nearby parts stock and field technicians who limit downtime during planting and soil preparation.
- Key Segments Analyzed
- By Product Type: Ploughs & Tillage is expected to account for 28.0% share in 2026 owing to recurring soil-working requirements across crop cycles.
- By Power Source: Tractor-mounted equipment is projected to account for 62.0% share in 2026 owing to compatibility with established tractor fleets.
- By Farm Size: Large Farms are anticipated to record 48.0% share in 2026 because broad acreages reward higher field capacity and wider working widths.
- By Application: Land Development is estimated to hold 31.0% share in 2026 owing to recurring field preparation and soil-working activity.
- Analyst Opinion at Fact.MR
- Shambhu Nath Jha, Fact.MR Senior Analyst states: “Implement purchases are decided in the field long before a quotation is signed or a dealer order is placed. Demand is expected to favor suppliers that prove tractor fit and agronomic performance under local soil conditions. Repeat orders are expected to favor suppliers that combine broad attachment coverage with local wear parts and technicians who understand crop calendars.”
- Strategic Implications
- Growers should match implement width and draft load to available tractor power before comparing precision controls or purchase prices across brands.
- Dealers should hold critical wear parts near planting and soil-preparation districts before seasonal failures create costly idle field hours for growers.
- Cooperatives should define booking windows and operator training rules before adding shared planters or crop-care implements to community machinery fleets.
- Manufacturers should validate soil-engagement geometry across local residue conditions before extending one implement design across dissimilar cropping zones and soils.
Farm equipment manufacturers are increasingly focusing on high capacity implements that help farmers complete field operations within narrow seasonal timeframes. Deere & Company introduced its High-Speed Disk Series in January 2025 for faster residue handling and seedbed preparation. The line offers working widths from 25 feet to 45 feet across several field-capacity needs. Factory preparation for autonomous tillage is available when paired with the positioning hardware required for field operation. The move reflects demand for implements that combine field speed with tractor matching during short seasonal work windows.
India is expected to record 8.9% CAGR during the forecast period because mechanization programs expand equipment access. China is projected to post 8.2% CAGR by 2036 due to equipment replacement across grain-producing regions. Australia is anticipated to advance at 6.9% CAGR over the assessment period owing to broadacre scale and recurring capital additions. The United Kingdom is estimated to record 6.6% CAGR between 2026 and 2036 as grant-backed equipment purchases support selective upgrade cycles. The United States is forecast to post 6.4% CAGR across the forecast horizon as labor expense keeps field capacity central to replacement decisions. Germany is projected to record 6.1% CAGR through 2036 as diversified farm operations sustain selective equipment renewal. Japan is forecast to advance at 5.8% CAGR over the assessment period as labor constraints support mechanization and equipment upgrades.
How does the Farm Implements Market break down by segment?
Tractor-mounted equipment is expected to hold 62.0% share while Large Farms account for 48.0%.
Which Product Type dominates?
Ploughs & Tillage accounts for 28.0% market share in 2026.
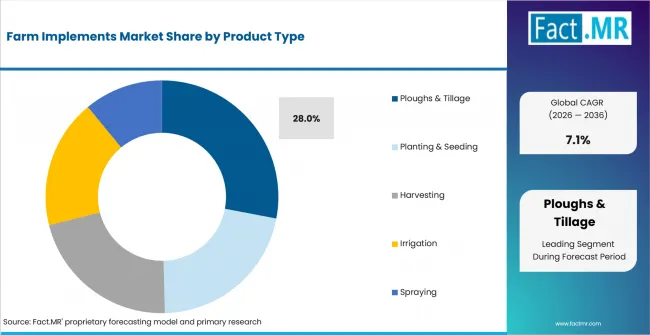
Farm Implements Market Analysis By Product Type | Source: Fact.MR
Ploughs & Tillage is expected to account for 28.0% share in 2026 and leads Product Type. Planting & Seeding serves crop establishment programs where row placement and depth control shape field setup. Harvesting equipment supports crop collection while Irrigation implements manage field water delivery. Spraying equipment supports crop protection programs across seasonal treatment windows. India’s Ministry of Agriculture reported in July 2025 that seed-bed preparation had reached 70% mechanization. Soil-working tools therefore remain central to annual equipment planning across mechanized crop systems.
Which Power Source is projected to garner the largest share?
Tractor-mounted equipment garners 62.0% market share in 2026.
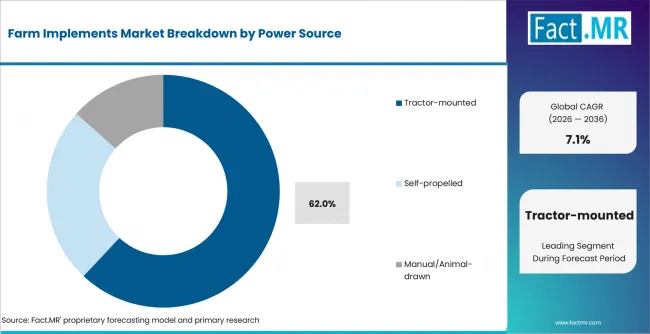
Farm Implements Market Analysis By Power Source | Source: Fact.MR
Tractor-mounted equipment is projected to account for 62.0% share in 2026 because established tractor fleets support broad implement compatibility. Self-propelled equipment serves operations where propulsion and field function are integrated within one machine. Manual/Animal-drawn implements remain relevant where field size or capital limits mechanized ownership. AGCO introduced the Fendt Optimum stack-fold planter in August 2025 with a terrain-flexing toolbar and optional hitch movement for uneven fields.
How does Farm Size shape demand?
Large Farms record 48.0% share in 2026.
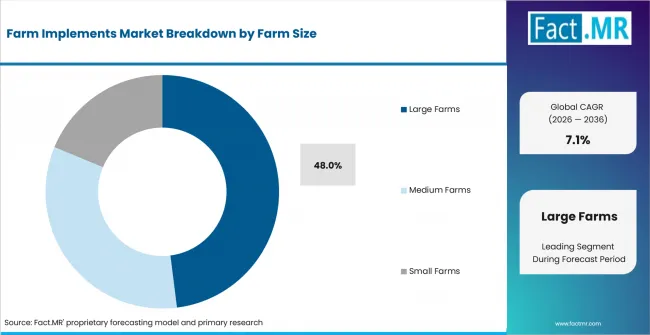
Farm Implements Market Analysis By Farm Size | Source: Fact.MR
Large Farms are anticipated to record 48.0% share in 2026 because broad acreages reward higher field capacity and wider working widths. Medium Farms balance ownership cost with seasonal utilization across crop cycles. Small Farms favor compact equipment that fits narrower fields and lower tractor-power requirements. Defra reported in October 2025 that the United Kingdom had 209,000 farm holdings. Farm-size diversity therefore requires differentiated implement specifications and dealer support.
What supports Land Development within Application?
Land Development holds 31.0% market share in 2026.
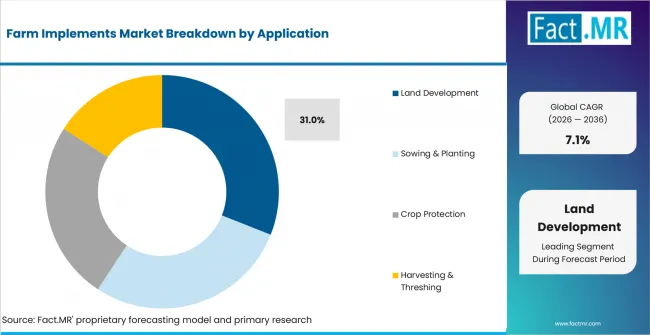
Farm Implements Market Analysis By Application | Source: Fact.MR
Land Development is estimated to hold 31.0% share in 2026 because field preparation requires recurring soil-working and leveling activity. Sowing & Planting equipment follows where depth control and row consistency influence establishment. Crop Protection equipment supports cultivation and spraying programs. Harvesting & Threshing tools support crop collection and post-harvest field handling. India’s July 2025 mechanization review reported 40% mechanization for sowing and planting operations. The operating gap creates room for equipment upgrades that improve placement accuracy during short planting windows.
What is accelerating Farm Implements Market adoption, and what is holding it back?
Mechanization investment drives adoption, while high equipment cost restrains replacement.
Drivers Impact Analysis
| DRIVER | (~) % IMPACT ON CAGR | GEOGRAPHIC RELEVANCE | IMPACT TIMELINE |
|---|---|---|---|
| Mechanization programs and equipment grants | +0.9% | India and Asia Pacific | Medium term (2-4 years) |
| Replacement of worn implements | +0.8% | North America and Europe | Medium term (2-4 years) |
| Labor cost and availability pressure | +0.6% | United States and Europe | Long term (4+ years) |
| Precision control on mounted implements | +0.5% | North America and Australia | Medium term (2-4 years) |
| Custom hiring and shared access | +0.4% | India and emerging Asia | Short term (2 years or less) |
Source: Fact.MR analysis. Updated Jul 10, 2026
- Mechanization programs: Public programs lower the first-cost barrier for growers who need machinery but cannot justify full ownership across limited acreage. India’s Ministry of Agriculture and Farmers Welfare reported in January 2025 that 1.91 million agricultural machines had been distributed under SMAM through November 2024. Program demand is expected to favor implements with clear testing records and local service coverage because purchase support does not remove uptime risk.
- Replacement cycles: Implement replacement follows wear and frame fatigue while changes in tractor power alter fitment needs across working fleets. ABARES reported in August 2025 that farm-sector lending rose 6% during 2023-24, reflecting continued capital investment across Australian agriculture. Replacement activity is projected to favor tools that raise field capacity without forcing a complete tractor change.
- Labor pressure: Farm labor costs encourage contractors and growers to cover wider areas with fewer field passes during short working windows. In May 2026, USDA ERS forecast total farm production expenses at USD 477.7 billion across United States farms. Demand is anticipated to favor implements that reduce repeat passes and simplify operator adjustment during planting or soil preparation.
- Precision control: Section control and variable-rate functions are moving from prime movers into planters and crop-application systems across mixed fleets. Control integration reduces overlap and gives agronomists clearer records of field operations across planting and crop-application programs. Adoption is estimated to expand where retrofit compatibility works across existing machines without forcing growers into a single equipment brand.
- Shared access: Shared access changes ownership economics for implements used only during narrow seasonal periods on individual farms. India’s Ministry of Agriculture and Farmers Welfare reported in January 2025 that 26,637 Custom Hiring Centres had been established under SMAM through November 2024. Custom-hiring demand is forecast to reward durable machines that operators reset quickly between tractors and field conditions.
Opportunity Impact Analysis
| OPPORTUNITY | (~) % IMPACT ON CAGR | GEOGRAPHIC RELEVANCE | IMPACT TIMELINE |
|---|---|---|---|
| Modular retrofit control kits | +0.6% | North America and Europe | Medium term (2-4 years) |
| Compact implements for small holdings | +0.5% | India and United Kingdom | Long term (4+ years) |
| Residue management and conservation tillage | +0.4% | China and Australia | Medium term (2-4 years) |
| Grant-ready equipment packages | +0.3% | United Kingdom | Short term (2 years or less) |
Source: Fact.MR analysis. Updated Jul 10, 2026
- Modular retrofit controls: Mixed fleets create an opening for control kits that add section control or guidance without replacing the base implement. AGCO used its September 2025 Tech Day to present mixed-fleet retrofit systems across the crop cycle. Opportunity is expected to widen where installers provide calibration and field support alongside hardware during mixed-fleet deployment and seasonal setup.
- Compact implement design: Small fields reward short turning radii and lower draft requirements that fit compact tractor classes and narrow access points. Defra reported in October 2025 that almost half of United Kingdom farms operated below 20 hectares. Demand is projected to expand for implements that provide commercial durability without unnecessary width or tractor power requirements.
- Residue management: Heavy crop residue changes soil-working requirements and increases the value of adjustable depth and residue-flow geometry. Growers need tool combinations that manage residue without excessive passes or unnecessary soil disturbance across commercial field conditions. Opportunity is anticipated to favor manufacturers that validate field performance across local crop residues and moisture conditions before dealer rollout.
- Grant-ready equipment packages: Public grant rounds create a sales route for implements whose specifications and eligible costs are easy to document. Defra reported in January 2026 that 13,200 Farming Equipment and Technology Fund claims had been paid across England by September 2025. Opportunity is estimated to favor dealers that prepare compliant quotations and model-level evidence before application windows open.
Restraints Impact Analysis
| RESTRAINT | (~) % IMPACT ON CAGR | GEOGRAPHIC RELEVANCE | IMPACT TIMELINE |
|---|---|---|---|
| High purchase cost and income volatility | -0.6% | Global farm markets | Medium term (2-4 years) |
| Tractor-implement mismatch | -0.4% | All mechanized regions | Short term (2 years or less) |
| Seasonal dealer inventory risk | -0.3% | Australia and North America | Medium term (2-4 years) |
| Parts and service gaps | -0.2% | Rural Asia and Latin America | Long term (4+ years) |
Source: Fact.MR analysis. Updated Jul 10, 2026
- Purchase cost pressure: New equipment pricing often delays replacement when farm income weakens or financing terms tighten during a seasonal buying cycle. The United Kingdom Farming Profitability Review reported in December 2025 that new farm machinery prices had risen 31%. Replacement demand is expected to remain selective where repair costs still sit below financing and depreciation burdens.
- Compatibility risk: An implement loses commercial value when hitch class or hydraulic flow does not match the tractors already used on a farm. Dealers need clear fitment sheets before releasing new implements into mixed tractor fleets across different farm operations. Adoption is projected to slow when growers cannot confirm compatibility before purchase or obtain setup support during initial field use.
- Seasonal inventory exposure: Dealers must order implements before weather and commodity conditions are fully known for the selling season. ABARES reported in March 2025 that average national broadacre farm cash income was forecast to rise by AUD 89,000 during 2024-25. Dealer ordering is anticipated to stay cautious because large income shifts change local machinery purchasing capacity between seasons.
- Service coverage gaps: Remote farming districts raise technician travel time and increase downtime when specialized wear parts are not held locally. Growers often keep repairable older implements when new machines lack dependable parts and service support across remote districts during peak seasons. Adoption is forecast to remain uneven until dealer territories support both local parts availability and field diagnosis during peak operations.
Which countries are scaling Farm Implements Market fastest?
India 8.9%, China 8.2%, Australia 6.9%, the United Kingdom 6.6%, United States 6.4%.
Regional coverage spans North America and Europe. It also covers Asia Pacific plus Central and South America alongside the Middle East and Africa.
.webp "Top Country Growth Comparison Farm Implements Market Cagr (2026 2036)")
Top Country Growth Comparison Farm Implements Market Cagr (2026 2036) | Source: Fact.MR
| COUNTRY | CAGR |
|---|---|
| India | 8.9% |
| China | 8.2% |
| Australia | 6.9% |
| United Kingdom | 6.6% |
| United States | 6.4% |
Source: Fact.MR analysis. Updated Jul 10, 2026
What is powering India’s rise?
8.9% CAGR during the forecast period, supported by mechanization programs and shared-access machinery.
India’s equipment base is widening as public support shifts attention toward small holdings and custom hiring networks. PIB reported in July 2025 that average farm mechanization stood near 45%, leaving several field operations below seedbed preparation levels. The market is expected to record 8.9% CAGR over the assessment period as local dealerships combine compact tools with service reach.
How is China scaling Farm Implements demand?
8.2% CAGR by 2036, driven by grain production scale and equipment modernization.
In January 2026, the National Bureau of Statistics reported 714.88 million tons of grain output during 2025 across China’s broad production base. The market is projected to post 8.2% CAGR between 2026 and 2036, supported by equipment renewal across grain-producing regions. Local dealers gain an advantage when they pair replacement parts with field setup for seeding and soil-working tools.
What supports the Australia outlook?
6.9% CAGR over the assessment period, owing to broadacre scale and recurring capital replacement.
Broadacre scale rewards wide implements and durable frames that cover large fields inside short seasonal working windows. ABARES reported in September 2025 that broadacre farms in the upper size decile accounted for 56.3% of output. Demand is anticipated to advance at 6.9% CAGR during the forecast period as service depth and field capacity shape upgrade choices.
What underpins United Kingdom growth?
6.6% CAGR between 2026 and 2036, reinforced by grant-backed upgrades and selective replacement cycles.
Grant programs give farm businesses a structured route to equipment upgrades while machinery prices remain difficult for smaller operators. Defra reported in January 2026 that 30,200 full Farming Equipment and Technology Fund applications had been received by September 2025. Demand is estimated to grow at 6.6% CAGR across the forecast horizon as dealers prepare model-level evidence and farmers prioritize measurable productivity gains.
How is the United States developing Farm Implements demand?
6.4% CAGR across the forecast horizon, shaped by labor expense and acreage-per-operator pressure.
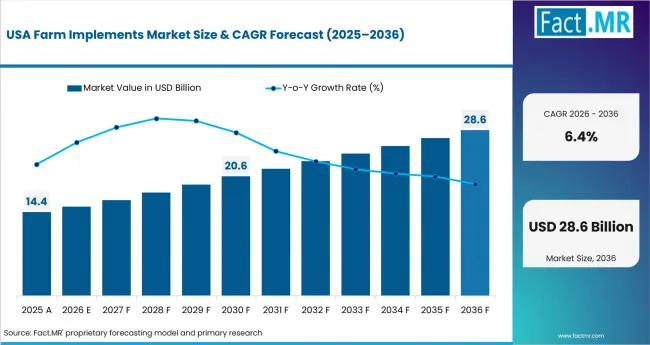
Farm Implements Market Country Value Analysis | Source: Fact.MR
Labor expense keeps field capacity central to equipment decisions across grain and mixed farming areas in the United States. In May 2026, USDA ERS forecast cash labor expenses at USD 53.9 billion across the United States farm sector. The market is forecast to record 6.4% CAGR between 2026 and 2036 while replacement choices stay tied to dealer service and mixed-fleet compatibility.
Why does Germany retain a steady Farm Implements opportunity?
6.1% CAGR through 2036, supported by selective machinery renewal and equipment fit across diversified farm operations.
Germany’s varied crop systems create recurring demand for implements that can work across different field conditions and established mixed machinery fleets. In January 2026, Destatis reported that German farms harvested 45 million tons of grain during 2025. The market is projected to record a 6.1% CAGR through 2036 as farms balance machinery renewal with compatibility across existing tractors and field systems. Dealers strengthen account retention by combining implement selection with spare-parts availability and seasonal service support.
How are labor constraints reshaping Japan’s Farm Implements demand?
5.8% CAGR over the assessment period, supported by workforce pressure and equipment renewal across intensive farming systems.
Japan’s aging agricultural workforce is increasing the value of implements that reduce operator effort across repetitive field operations. In 2025, MAFF reported an average age of 69.2 years among core persons mainly engaged in farming during 2024. The market is forecast to advance at a 5.8% CAGR over the assessment period as labor constraints support mechanization and replacement demand. Suppliers gain relevance when compact equipment and dependable maintenance programs fit intensive farms with limited operating labor.
Who leads the Farm Implements Market?
Players such as John Deere (Deere & Company), AGCO Corporation and CNH Industrial are focusing on broad implement portfolios.
John Deere (Deere & Company) competes across ploughing and tillage plus planting equipment with broad dealer support. CNH Industrial’s January 2026 AE50 update covered technologies for seedbed control and planting across Case IH equipment. AGCO Corporation adds planters and hay tools across Fendt and Massey Ferguson portfolios. Kubota’s January 2026 CES program included a platform robot designed to change attachments across field tasks. Competition within this group centers on field performance and tractor compatibility alongside parts support during seasonal operating windows.
CLAAS reported a broad product program in December 2025 that included forage machinery and balers. Mahindra introduced a heavy-duty rotavator range in February 2026 for tillage work across uneven Indian fields. Trimble and PTx Trimble announced IonoGuard in March 2025 to improve positioning continuity for precision agriculture operations. Suppliers are better positioned when they combine agronomic fit with equipment compatibility and dependable service during narrow field windows.
Which companies are the key providers?
The key provider set includes John Deere (Deere & Company), AGCO Corporation, CNH Industrial, Kubota Corporation, Mahindra & Mahindra, and CLAAS
- John Deere (Deere & Company)
- AGCO Corporation
- CNH Industrial
- Kubota Corporation
- Mahindra & Mahindra
- CLAAS
Bibliography
- AGCO Corporation. (2025, August 26). Fendt® Launches 1000 Vario® Gen4 Tractor and All-New Optimum™ Planter at 2025 Farm Progress Show. AGCO Corporation.
- AGCO Corporation. (2025, September 25). AGCO Tech Day 2025 Spotlights AI, Autonomy and Mixed-Fleet Solutions to Enhance Farmer Profitability. AGCO Corporation.
- Australian Bureau of Agricultural and Resource Economics and Sciences. (2025, March 4). Strong year for Aussie ag beefed up by livestock. Department of Agriculture, Fisheries and Forestry.
- Australian Bureau of Agricultural and Resource Economics and Sciences. (2025, August 22). Farm lending reaches $131 billion in 2023-24. Department of Agriculture, Fisheries and Forestry.
- Australian Bureau of Agricultural and Resource Economics and Sciences. (2025, September 29). Disaggregating farm performance statistics by size. Department of Agriculture, Fisheries and Forestry.
- CLAAS KGaA mbH. (2025, December 10). CLAAS Holds Its Ground in a Challenging Market Environment and Drives Innovation Forward. CLAAS.
- CNH Industrial N.V. (2026, January 7). AE50 2026: ASABE lists three Ag Tech innovations from CNH. CNH Industrial N.V.
- Deere & Company. (2025, January 14). High-Speed Disk Series Tillage. Deere & Company.
- Department for Environment, Food & Rural Affairs. (2025, October 23). Farming evidence - key statistics (accessible version). GOV.UK.
- Department for Environment, Food & Rural Affairs. (2025, December 18). Farming Profitability Review 2025: Foreword and Executive Summary. GOV.UK.
- Department for Environment, Food & Rural Affairs. (2026, January 29). Farming Investment Fund statistics September 2025. GOV.UK.
- Government of India Press Information Bureau. (2025, January 7). Brief on the achievements through schemes and programmes of Ministry of Agriculture & Farmers Welfare. Ministry of Agriculture & Farmers Welfare.
- Government of India Press Information Bureau. (2025, July 22). Farm Mechanization and Agricultural Workforce. Ministry of Agriculture & Farmers Welfare.
- Kubota Corporation. (2026, January 7). Kubota Group to Exhibit at CES® 2026. Kubota Corporation.
- Mahindra & Mahindra Ltd. (2026, February 27). Mahindra introduces New Rotavator Series with Bold New Look & Enhanced Mast Design. Mahindra & Mahindra Ltd.
- National Bureau of Statistics of China. (2026, January 19). National Economy Pushed Forward with Innovation-led Development and Maintained a Generally Stable Momentum in 2025. National Bureau of Statistics of China.
- U.S. Department of Agriculture, Economic Research Service. (2026, May 19). Farm Sector Income & Finances - Farm Sector Income Forecast. U.S. Department of Agriculture.
This Report Addresses
- The report provides strategic intelligence on Farm Implements across Product Type and Power Source. It also evaluates Farm Size and Application choices that shape machinery purchasing and field use.
- Segment analysis covers Ploughs & Tillage and Tractor-mounted equipment; it also evaluates Large Farms and Land Development.
- Regional outlook evaluates India and China alongside Australia. The comparison also covers the United Kingdom and United States together with Germany and Japan.
- Competitive analysis profiles John Deere (Deere & Company) and AGCO Corporation alongside CNH Industrial and Kubota Corporation. The provider set also covers Mahindra & Mahindra
- Product Type assessment covers Ploughs & Tillage and Planting & Seeding across commercial field operations. It also covers Harvesting and Irrigation alongside Spraying equipment.
- Power Source assessment covers Tractor-mounted and Self-propelled equipment alongside Manual/Animal-drawn tools. Farm Size analysis separates Large Farms from Medium Farms and Small Farms.
- Application assessment covers Land Development and Sowing & Planting across recurring crop cycles. It also covers Crop Protection alongside Harvesting & Threshing operations.
What does the Farm Implements Market cover?
The market covers Ploughs & Tillage plus Planting & Seeding alongside Harvesting equipment and Irrigation implements. It also includes Spraying equipment used in commercial field operations.
The Farm Implements Market covers tools and equipment used for land development plus sowing and planting. Coverage also includes crop protection and harvesting alongside irrigation and spraying work. Power Source analysis includes Tractor-mounted and Self-propelled equipment alongside Manual/Animal-drawn implements.
The boundary differs from the broader agricultural machinery category because tractors and combines are prime movers or harvest machines. Standalone tractors remain outside the scope unless the purchased value is assigned to a separately priced implement attachment. General hand tools used outside commercial farm operations are also excluded from the market boundary and forecast valuation framework.
What is included in the scope?
The scope covers farm implements used in land development and crop establishment. It also includes crop protection alongside irrigation and harvesting and threshing operations.
Coverage includes Ploughs & Tillage and Planting & Seeding alongside Harvesting equipment. It also includes Irrigation and Spraying implements. Power Source analysis covers Tractor-mounted and Self-propelled equipment alongside Manual/Animal-drawn tools. Farm Size analysis separates Large Farms from Medium Farms and Small Farms. Application coverage spans Land Development and Sowing & Planting. It also includes Crop Protection plus Harvesting & Threshing. Related context on soil tillage implements helps define the Ploughs & Tillage category. Research on seed drill machines informs the Planting & Seeding boundary.
What is excluded from the scope?
Standalone tractors and fully integrated combines remain outside the scope. Independent rental service revenue is also excluded from market valuation.
Standalone tractors and fully integrated combines are excluded when commercial value belongs to the prime mover or complete harvesting machine. Self-propelled farm implements remain included when they fit the defined Product Type categories. Revenue from independent farm equipment rental services is excluded while implements sold into rental fleets remain inside scope. Fully integrated autonomous farm equipment remains outside scope unless the implement attachment is sold and priced separately.
How was the analysis built?
120+ sources, 40+ company portfolios, 25+ countries, 20+ interviews.
- Primary Research
- Primary research includes interviews with growers and custom contractors alongside implement dealers and cooperative machinery managers. Discussions also cover agronomists and service technicians who assess soil conditions and tractor fit across local cropping systems. They also evaluate wear-part use and field performance during narrow seasonal operating windows across different crop calendars.
- Desk Research
- Desk research reviews government mechanization programs and farm investment statistics alongside official machinery testing frameworks. Company product pages and technical announcements are assessed with equipment catalogs and current portfolio checks to map implement coverage and active provider participation.
- Market-Sizing and Forecasting
- Forecasting uses farm investment cycles and implement replacement rates alongside average selling prices. Models consider power-source mix and farm-size structure across regional ownership patterns. Application demand is assessed across land development and planting plus crop protection and harvesting work.
- Data Validation and Update Cycle
- Forecasts are validated through provider checks and technical interviews that test assumptions on replacement timing and field utilization. Portfolio mapping and country-level policy review help confirm market direction while recurring reviews of farm spending and machinery developments support forecast updates.
Segmentation
What is the report’s scope and coverage?
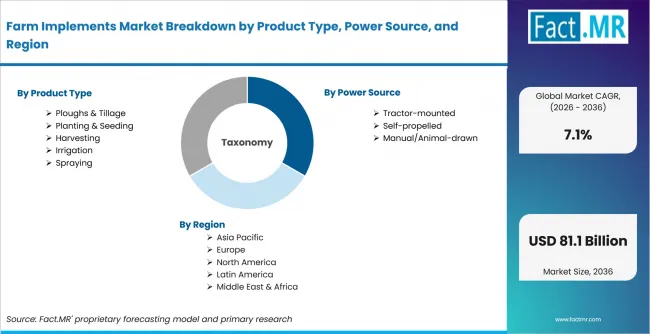
Farm Implements Market Breakdown By Product Type, Power Source, And Region | Source: Fact.MR
| Attribute | Details |
|---|---|
| Quantitative Units | USD billion |
| Market Definition | Farm implement tools and equipment used for land development plus sowing and planting. Coverage also includes crop protection alongside irrigation and harvesting and threshing operations. |
| Product Type | Ploughs & Tillage; Planting & Seeding; Harvesting; Irrigation; Spraying |
| Power Source | Tractor-mounted; Self-propelled; Manual/Animal-drawn |
| Farm Size | Large Farms; Medium Farms; Small Farms |
| Application | Land Development; Sowing & Planting; Crop Protection; Harvesting & Threshing |
| Regions Covered | North America; Europe; Asia Pacific; Central and South America; Middle East and Africa |
| Countries Covered | United States; Canada; Germany; United Kingdom; France; Italy; Spain; India; China; Japan; South Korea; Australia; Brazil; Argentina; Mexico; Chile; UAE; Saudi Arabia; South Africa |
| Key Companies Profiled | John Deere (Deere & Company); AGCO Corporation; CNH Industrial; Kubota Corporation; Mahindra & Mahindra; CLAAS; |
| Forecast Period | 2026 to 2036 |
| Approach | Hybrid top-down and bottom-up approach using farm investment cycles and implement replacement rates. The model also considers average selling prices plus power-source mix and farm-size structure alongside application demand and provider validation. |
Source: Fact.MR analysis. Updated Jul 10, 2026
How is the market segmented?
-
By Product Type
- Ploughs & Tillage
- Planting & Seeding
- Harvesting
- Irrigation
- Spraying
-
By Power Source
- Tractor-mounted
- Self-propelled
- Manual/Animal-drawn
-
By Farm Size
- Large Farms
- Medium Farms
- Small Farms
-
By Application
- Land Development
- Sowing & Planting
- Crop Protection
- Harvesting & Threshing
-
By Region
- North America
- United States
- Canada
- Europe
- Germany
- United Kingdom
- France
- Italy
- Spain
- Asia Pacific
- India
- China
- Japan
- South Korea
- Australia
- Latin America
- Brazil
- Argentina
- Mexico
- Chile
- Middle East and Africa
- UAE
- Saudi Arabia
- South Africa
- North America
Frequently Asked Questions
Which product category accounts for the notable share in the Farm Implements Market?
How prominent is Tractor-mounted equipment in the Farm Implements Market?
What position do Large Farms hold in the Farm Implements Market?
Which application area generates the significant demand for farm implements?
Which country demonstrates the growth potential in the Farm Implements Market?
How is the Farm Implements Market expected to evolve in China?
What expansion outlook characterizes the Australian market?
How will the United Kingdom perform over the forecast period?
What growth trend is anticipated in the United States?
How is Germany positioned within the Farm Implements Market outlook?
What pace of development is forecast for Japan?
What factor drives growth in the Farm Implements Market?
Which challenge most significantly limits market expansion?
Why do Ploughs & Tillage remain a key product segment?
Why do Large Farms account for a substantial portion of demand?
Who worked on this report


Preview the report firsthand - request a free sample
Free SampleGet the brochure for pricing and purchase details
Download PDF