- Market Value (2025): USD 1.3 Bn
- Estimated Value (2026): USD 1.5 Bn
- Forecast Value (2036): USD 3.8 Bn
- CAGR (2026-2036): 10.1%
What is the Functional Food Toppers Market forecast to be worth by 2036?
USD 1.5 billion in 2026 to USD 3.8 billion by 2036 at 10.1% CAGR.
- The functional food toppers market crossed a valuation of USD 1.3 billion in 2025 as brands moved protein, seed, grain, probiotic and superfood claims into meal add-ons.
- Demand is projected to increase from USD 1.5 billion in 2026 to USD 3.8 billion by 2036.
- The market is forecast to record 10.1% CAGR from 2026 to 2036 owing to breakfast bowls, salad upgrades and online pack discovery.
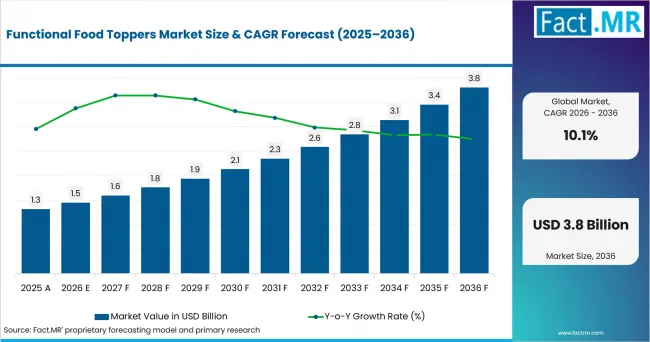
Functional Food Toppers Market Value Analysis | Source: Fact.MR
What are the defining numbers behind Functional Food Toppers Market growth?
USD 2.3 billion absolute opportunity by 2036, led by Seed & grain toppers and Protein boost benefits.
- Demand Drivers in the Market
- Yoghurt and bowl brands need toppings that add texture while keeping protein, fiber or probiotic benefits easy to explain.
- Grocery category managers need shelf-stable topper packs because wellness claims must work inside mainstream breakfast and snack aisles.
- USDA ERS reported that total U.S. food spending by consumers, businesses, and government entities reached USD 2.51 trillion in 2025, giving meal add-ons a large food-use base.
- Foodservice operators need portionable toppings so bowls, salads and smoothies can be customized without changing the core menu.
- Key Segments Analyzed
- By Product Type: Seed & grain toppers are expected to hold 32.0% share in 2026 due to familiar ingredients and easy bowl use.
- By Benefit: Protein boost is projected to account for 29.0% share in 2026 because grams per serving remain simple for consumers to compare.
- By Application: Yoghurt & bowls are anticipated to capture 30.0% share in 2026 owing to breakfast and snack occasions.
- By Distribution: Grocery & mass is estimated to represent 40.0% share in 2026 due to weekly replenishment and broad household reach.
- Analyst Opinion at Fact.MR
- Shambhu Nath Jha, Principal Consultant at Fact.MR, states, “Functional food toppers stand out when they make nutrition visible without asking consumers to change meals. Commercial acceptance is expected to depend on proof that texture, claim language and serving size stay clear across retail and direct channels.”
- Strategic Implications
- Ingredient formulators should design topper bases that protect crunch and nutrition claims after storage and transport.
- Retailers should compare products by repeat-use occasions such as breakfast bowls, lunch salads and smoothie add-ins.
- Brands should avoid broad wellness wording and show the exact protein, probiotic, fiber or botanical benefit per serving.
- Investors should separate finished consumer toppers from bulk ingredients that require further formulation before sale.
Australia is expected to post 11.5% CAGR through 2036 on the back of produce-linked bowl use. Canada is projected to record 11.3% CAGR owing to fruit availability and agri-food processing. The United States is anticipated to advance at 11.3% CAGR through large food spending. The United Kingdom is forecast to reach 10.7% CAGR, supported by online discovery. France is estimated to reach 10.1% CAGR through grocery concentration. Germany is expected to record 9.0% CAGR through nutrition-documentation needs.
How does the Functional Food Toppers Market break down by segment?
Seed & grain toppers lead Product Type at 32.0%; Protein boost leads Benefit at 29.0%.
Which product type dominates?
Seed & grain toppers are projected to account for 32.0% share in 2026.
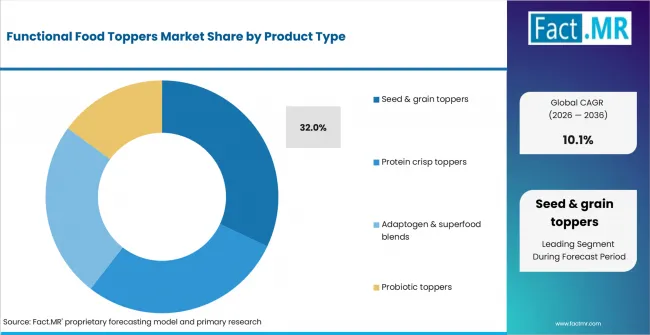
Functional Food Toppers Market Analysis By Product Type | Source: Fact.MR
Seed & grain toppers are forecast to lead Product Type with 32.0% share in 2026 because they combine crunch, visible ingredients and broad use across yoghurt bowls. ADM announced eight new soy and pea protein ingredient solutions on May 20, 2026, supporting protein-ingredient availability rather than directly indicating topper sales.
What leads the Benefit segment?
Protein boost is expected to hold 29.0% share in 2026.
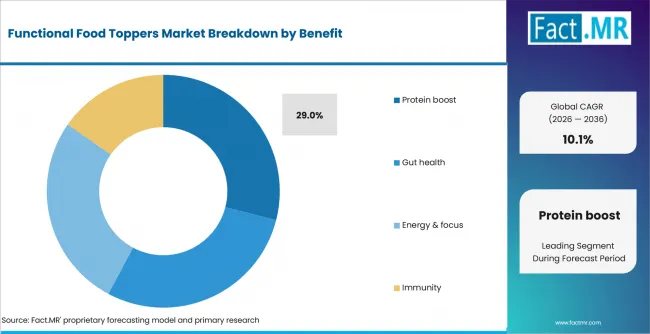
Functional Food Toppers Market Analysis By Benefit | Source: Fact.MR
Protein boost is expected to lead the Benefit segment with 29.0% share in 2026 because consumers can easily compare grams of protein per serving without learning unfamiliar benefit language. Clear benefit-first packaging also helps simplify product communication and supports functional toppers positioned around convenient everyday nutrition and protein intake.
How does Application shape demand?
Yoghurt & bowls are anticipated to lead with 30.0% share in 2026.
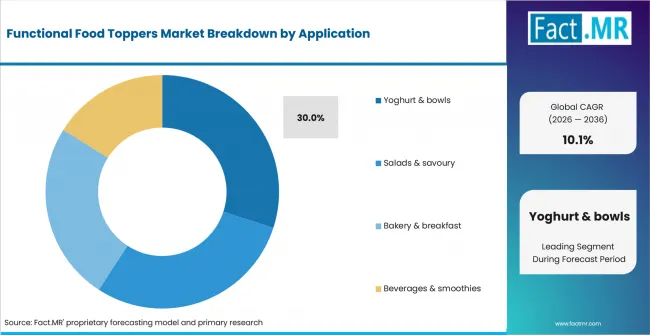
Functional Food Toppers Market Analysis By Application | Source: Fact.MR
Yoghurt & bowls are anticipated to lead Application with 30.0% share in 2026 because functional toppers address texture, portioning and visible nutrition within one familiar use case. Demand is expected to remain supported when products are easy to dose, maintain their crunch and integrate conveniently into everyday breakfast or snack routines.
What supports Grocery & mass within Distribution?
Grocery & mass is estimated to represent 40.0% share in 2026.
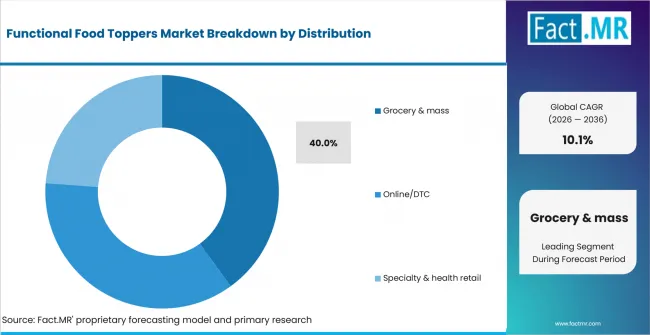
Functional Food Toppers Market Analysis By Distribution | Source: Fact.MR
Grocery & mass is estimated to lead Distribution with 40.0% share in 2026 because placement near yoghurt, cereal or snack shelves supports discovery and repeat purchasing. The U.S. Census Bureau reported in May 2026 that Q1 2026 retail e-commerce sales reached USD 326.7 billion, supporting additional online product discovery.
What is accelerating Functional Food Toppers Market adoption, and what is holding it back?
Everyday meal functionalization drives it; label and texture risk restrains it.
Drivers Impact Analysis
| DRIVER | (~) % IMPACT ON CAGR | GEOGRAPHIC RELEVANCE | IMPACT TIMELINE |
|---|---|---|---|
| Everyday meal functionalization | +2.4% | USA, UK, Australia | Short term (<= 2 years) |
| Protein and fiber positioning | +2.1% | USA, Canada, Germany | Short term (<= 2 years) |
| Yoghurt and bowl format use | +1.7% | USA, UK, France | Medium term (2-4 years) |
| Grocery shelf placement | +1.4% | USA, UK, Germany | Medium term (2-4 years) |
| Online and DTC discovery | +1.0% | USA, Canada, Australia | Long term (>= 4 years) |
- Everyday meal functionalization: Consumers use toppers when they want to add protein, crunch or gut-health cues to a familiar meal. This expands selling occasions across bowls, salads and snacks.
- Protein and fiber positioning: Protein boost leads benefit demand because the claim is clear at the point of purchase. Fiber and prebiotic messages are expected to support adjacent gut-health products.
- Yoghurt and bowl format use: Bowl formats make toppers visible and easy to portion. Foodservice and retail brands are expected to test seasonal mixes before wider product rollouts.
- Grocery shelf placement: Mainstream grocery gives toppers weekly visibility near breakfast, dairy and snacks. Retailers are expected to favor products with clear labels and low handling complexity.
- Online and DTC discovery: Direct selling helps new brands explain benefits through bundles and recipe content. This route is useful for probiotic and botanical blends that need more education.
Opportunity Impact Analysis
| Seed and grain premiumization | +1.3% | USA, Canada, France | Short term (<= 2 years) |
| Protein crisp formulation | +1.1% | USA, Germany, UK | Medium term (2-4 years) |
| Shelf-stable probiotic toppers | +0.9% | Canada, UK, Australia | Medium term (2-4 years) |
| Foodservice bowl programs | +0.7% | USA, Australia, France | Long term (>= 4 years) |
- Seed and grain premiumization: Seed mixes create scope for minerals, crunch and clean ingredient lists. Premium products are expected to use better coating control to protect flavor.
- Protein crisp formulation: Crisped proteins let brands add protein without changing the base food. Wider input availability is expected to help product developers manage texture and taste.
- Shelf-stable probiotic toppers: Probiotic toppers are expected to grow where cultures remain stable through storage. Brands must present strain and serving information clearly for shopper trust.
- Foodservice bowl programs: Cafes and quick-service chains can use toppers to create add-on pricing. Portion control and allergen handling are expected to decide wider adoption.
Restraints Impact Analysis
| RESTRAINT | (~) % IMPACT ON CAGR | GEOGRAPHIC RELEVANCE | IMPACT TIMELINE |
|---|---|---|---|
| Price-sensitive grocery replenishment | -1.1% | Global | Short term (<= 2 years) |
| Health-claim and label review | -0.8% | Europe, Canada | Short term (<= 2 years) |
| Texture and moisture migration | -0.7% | Dairy and bowl applications | Medium term (2-4 years) |
| Allergen and cross-contact controls | -0.5% | USA, UK, Australia | Long term (>= 4 years) |
- Price-sensitive grocery replenishment: Toppers can be treated as discretionary add-ons when food budgets tighten. Brands are expected to protect repeat purchase through serving-value clarity.
- Health-claim and label review: Gut health, immunity and energy claims face closer review than simple protein claims. This raises documentation costs for smaller brands and importers.
- Texture and moisture migration: Crunch loss can weaken the consumer experience in yoghurt and smoothie uses. Packaging and coating choices therefore shape shelf-life claims.
- Allergen and cross-contact controls: Seed, nut, grain and dairy-adjacent uses create allergen questions. Production partners must show cleaning and segregation records before wider retail listing.
Which countries are scaling Functional Food Toppers Market fastest?
- The country comparison spans 2.50 percentage points and forms two practical growth bands across the forecast period.
- Australia remains 0.18 percentage point above Canada through produce-led meals and direct online pack discovery.
- Canada remains 0.04 percentage point above the United States through fruit availability and agri-food processing depth.
- The United States remains 0.63 percentage point above the United Kingdom through a larger food-use base and mainstream grocery testing.
- The United Kingdom remains 0.62 percentage point above France as online retail spending supports direct selling.
- France remains 1.03 percentage points above Germany through concentrated grocery channels and dairy-linked topper placement.
- Germany closes the displayed range through nutrition documentation, ingredient traceability and cautious claim review.
Comparable CAGRs can create different entry conditions due to channel mix, label review and local eating habits. Full report coverage includes North America, Latin America, Europe, East Asia, South Asia and Pacific, Middle East and Africa.
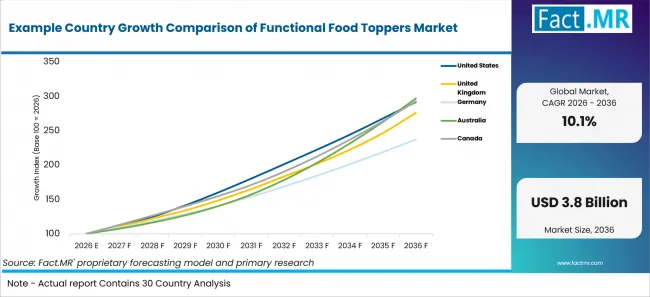
Example Country Growth Comparison Of Functional Food Toppers Market | Source: Fact.MR
| Country | CAGR (2026-2036) |
|---|---|
| Australia | 11.5% |
| Canada | 11.3% |
| United States | 11.3% |
| United Kingdom | 10.7% |
| France | 10.1% |
| Germany | 9.0% |
What supports Australia adoption?
11.5% CAGR, supported by produce-led bowls and online food retail.
Australia’s growth reflects a consumer base that already connects fruit, nuts, seeds and breakfast bowls with portable nutrition. The Australian Bureau of Statistics reported in June 2026 that the 2024-25 local value of fruit excluding wine grapes reached AUD 7.3 billion. Functional topper brands are expected to use that produce base to position seed blends, protein crisps and superfood mixes near yoghurt and smoothie occasions.
What supports Canada adoption?
11.3% CAGR, backed by fruit availability and agri-food processing capacity.
Canadian demand is tied to fruit-forward eating and a broad food manufacturing base. Statistics Canada reported in May 2026 that fresh fruit availability increased to 77.9 kilograms per person in 2025. That supports toppings for fruit bowls and dairy pairings where consumers want texture and portioned nutrition. Brands are expected to win shelf space when bilingual packs keep protein and gut-health messages simple.
How is the United States scaling demand?
11.3% CAGR, driven by food spending and 33% country share.
The United States is expected to scale through its large meal and snack base. Grocery chains are expected to place products near yoghurt, cereal and salad fixtures when the benefit claim is clear. Foodservice bowls add another entry point for portionable premium toppings.
How is the United Kingdom developing demand?
10.7% CAGR, shaped by online retail and 14% country share.
The United Kingdom’s growth is shaped by online discovery and small-pack grocery testing. ONS reported in July 2026 that online spending values rose 11.7% in Q2 2026 compared with Q2 2025. Functional topper brands are expected to use direct bundles and recipe content before expanding into mainstream retail.
What supports France growth?
10.1% CAGR, supported by grocery concentration and dairy-linked applications.
France is expected to build demand through grocery-led placement and familiar dairy occasions. INSEE reported in June 2026 that large general food stores accounted for 58.6% of the value of retail trade in food products, excluding tobacco, in France in 2025. That channel structure supports topper placement near yoghurt, breakfast and cereal shelves. Seed & grain formats are expected to face fewer claim barriers than probiotic or immunity-led products.
How does Germany perform?
9.0% CAGR, led by nutrition documentation and 14% country share.
Germany’s growth reflects a more documentation-led path into grocery. Seed & grain blends fit German retail when ingredient origin and nutrient records are easy to verify. Claim-heavy probiotic or botanical blends are expected to move more slowly.
Who leads the Functional Food Toppers Market?
Kerry, ADM and Ingredion provide relevant formulation or ingredient capabilities; McCormick provides a directly evidenced edible topping format; Bragg provides consumer nutrition exposure; and Nestlé's cited Milo Pro development is adjacent to, rather than directly within, the defined topper category.
Kerry, ADM and Ingredion are profiled for ingredient and formulation capabilities relevant to topper development. McCormick is profiled for consumer topping and seasoning formats, while Bragg provides consumer nutrition exposure through nutritional yeast. Nestlé is retained as adjacent high-protein nutrition context rather than as a directly evidenced finished functional-food-topper supplier.
Which companies are the key providers?
Key companies include Kerry Group plc; McCormick & Company, Incorporated; Archer-Daniels-Midland Company; Manitoba Harvest; Bragg Live Food Products, LLC; and Navitas Organics
- Kerry Group plc
- McCormick & Company, Incorporated
- Archer-Daniels-Midland Company
- Manitoba Harvest
- Bragg Live Food Products, LLC
- Navitas Organics
Bibliography
- ADM. (2026, May 20). ADM advances protein innovation with new ingredient solutions.
- Australian Bureau of Statistics. (2026, June 30). Australian Agriculture: Horticulture, 2024–25 financial year.
- U.S. Census Bureau. (2026, May 18). Quarterly retail e-commerce sales: 1st quarter 2026.
- Institut national de la statistique et des études économiques. (2026, June 18). Parts de marché du commerce de détail selon la forme de vente [Retail trade market shares by form of sale].
- Kerry. (2025, September 30). Kerry launches Smart Taste™ to help customers navigate market complexities without compromising on taste.
- Office for National Statistics. (2026, July 24). Retail sales, Great Britain: June 2026.
- Statistics Canada. (2026, May 28). Food availability, 2025.
This Report Answers
- The report positions toppers near adjacent functional foods where everyday meals carry defined nutrition benefits.
- It evaluates how functional snacks influence crisp and grain-based products used as meal additions.
- Segment analysis covers probiotic formats without including capsules, tablets or drink-only powders.
- Protein crisp toppers are compared with low fat protein snacks where texture and protein delivery overlap.
- Benefit analysis places the market inside health and wellness foods without expanding the scope into full meal substitutes.
What does the Functional Food Toppers Market cover?
Functional food toppers are edible additions used to add protein, fiber, probiotics, seeds, grains or botanical blends to meals. The scope keeps healthy foods as a demand reference and excludes general health claims without an edible topping format.
Coverage includes finished consumer toppers and formulation-ready products when they are sold as meal add-ons. It includes toppings for yoghurt and bowls, salads and savoury foods, bakery or breakfast meals, beverages and smoothies. It excludes capsules, tablets, drink-only powders and bulk ingredients without a finished topper use.
What is included in the scope?
Fiber-forward formulations are included only when the final product functions as a sprinkled, mixed or layered topper.
Protein ingredients are considered where they support finished toppers sold through consumer or manufacturer channels.
The scope includes Product Type, Benefit, Application, Distribution and Region. It includes Seed & grain toppers, Protein crisp toppers, Adaptogen & superfood blends and Probiotic toppers. It also includes Protein boost, Gut health, Energy & focus and Immunity benefits when claims are tied to an edible topper format.
What is excluded from the scope?
Nutritional blends are excluded when they are sold only as bulk premixes without a finished topping use.
Fortified foods are referenced only where micronutrient enrichment appears in edible meal add-ons.
The scope excludes vitamins, gummies, capsules, drink-only powders and general seasoning products without a functional nutrition claim. It also excludes conventional granola unless it is positioned as a functional topper with a defined benefit. Company revenue without a direct link to finished toppers or topper ingredients is not included.
How Was the Analysis Built?
The analysis draws on 120+ sources, 35+ company portfolios, 25+ countries, and more than 20 industry interviews.
- Primary Research: Primary research includes discussions with manufacturers, service providers, technology developers, distributors, end users, procurement teams, and subject-matter experts. These conversations examine purchasing priorities, product adoption, operational challenges, approval requirements, competitive positioning, and the factors that influence wider market acceptance.
- Desk Research: Desk research covers government statistics, regulatory publications, company filings, trade data, technical studies, industry associations, standards, public policy, and other authoritative sources. Every source used in the analysis is documented in the bibliography.
- Market Sizing and Forecasting: Market estimates combine historical performance, demand indicators, pricing and volume trends, segment shares, company participation, country-level growth, adoption patterns, investment activity, and barriers to market expansion.
- Data Validation and Update Cycle: Findings are validated by comparing primary interviews with public data, company activity, regulatory changes, trade patterns, and industry developments. Regular updates review new product launches, capacity changes, partnerships, approvals, procurement trends, and shifts in commercial adoption.
What is the report’s scope and coverage?
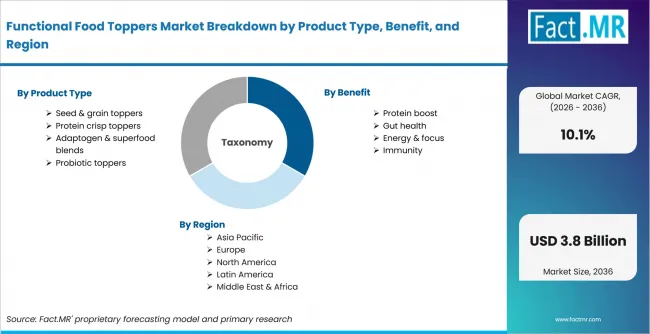
Functional Food Toppers Market Breakdown By Product Type, Benefit, And Region | Source: Fact.MR
| Attribute | Details |
|---|---|
| Quantitative Units | USD billion |
| Market Definition | Ready-to-use edible toppers that add functional nutrition claims to everyday foods through seeds, grains, protein crisps, probiotic sprinkles or superfood blends |
| Product Type | Seed & grain toppers; Protein crisp toppers; Adaptogen & superfood blends; Probiotic toppers |
| Benefit | Protein boost; Gut health; Energy & focus; Immunity |
| Application | Yoghurt & bowls; Salads & savoury; Bakery & breakfast; Beverages & smoothies |
| Distribution | Grocery & mass; Online/DTC; Specialty & health retail |
| Regions Covered | North America; Latin America; Europe; East Asia; South Asia and Pacific; Middle East and Africa |
| Countries Covered | Australia; Canada; United States; United Kingdom; France; Germany |
| Key Companies Profiled | Kerry Group plc; McCormick & Company, Incorporated; Archer-Daniels-Midland Company; Manitoba Harvest; Bragg Live Food Products, LLC; Navitas Organics |
| Forecast Period | 2026 to 2036 |
| Approach | Hybrid top-down and bottom-up approach using food retail indicators; functional ingredient use; channel mix; country adoption patterns; product claims; application fit; company portfolio review; and segment share analysis |
How is the market segmented?
-
By Product Type:
- Seed & grain toppers
- Protein crisp toppers
- Adaptogen & superfood blends
- Probiotic toppers
-
By Benefit:
- Protein boost
- Gut health
- Energy & focus
- Immunity
-
By Application:
- Yoghurt & bowls
- Salads & savoury
- Bakery & breakfast
- Beverages & smoothies
-
By Distribution:
- Grocery & mass
- Online/DTC
- Specialty & health retail
-
By Region:
- North America
- Latin America
- Europe
- East Asia
- South Asia and Oceania
- Middle East and Africa