- Market Value (2025): USD 380.8 Mn
- Estimated Value (2026): USD 420 Mn
- Forecast Value (2036): USD 1119 Mn
- CAGR (2026-2036): 10.3%
What is the High-Protein Dessert Inclusions Market forecast to be worth by 2036?
USD 420 million in 2026 to USD 1,119 million by 2036 at 10.3% CAGR.
- The high-protein dessert inclusions market reached USD 380.8 million in 2025 as protein-led snacking moved into indulgent bars and frozen treats.
- Demand is projected to increase from USD 420 million in 2026 to USD 1,119 million by 2036.
- The market is forecast to record 10.3% CAGR from 2026 to 2036 as dessert brands and contract manufacturers widen protein claim formats.
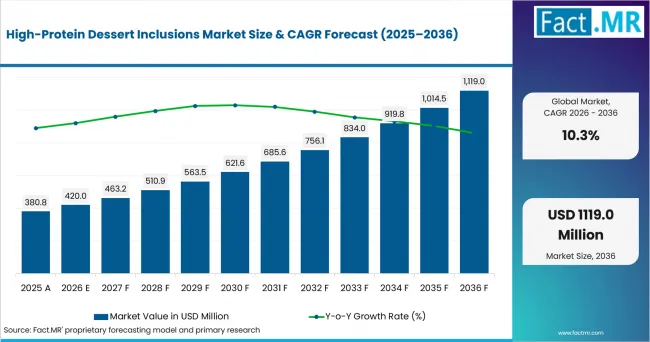
High Protein Dessert Inclusions Market Value Analysis | Source: Fact.MR
What are the defining numbers behind High-Protein Dessert Inclusions Market growth?
USD 699 million absolute opportunity by 2036, led by protein crisps & clusters and soy protein alongside protein bars.
- Demand Drivers in the Market
- Dessert formulators need crunchy inclusions that keep bite after coating, chilling or freezing.
- Snack-bar brands use protein crisps and clusters to make protein visible in each bite.
- Cargill reported in April 2025 that 61% of Americans increased protein intake in 2024.
- Retail product teams are expected to favor inclusions with clear allergen files and stable protein declarations.
- Key Segments Analyzed
- By Inclusion Type: Protein crisps & clusters are expected to hold 36.0% share in 2026 due to their role in bars and frozen toppings.
- By Protein Source: Soy protein is projected to account for 31.0% share in 2026 because it balances cost, extrusion performance and protein density.
- By Application: Protein bars are anticipated to capture 33.0% share in 2026 as visible inclusions help brands separate texture and nutrition claims.
- Analyst Opinion at Fact.MR
- Shambhu Nath Jha, Principal Consultant at Fact.MR states, “High-protein dessert inclusions are judged first by bite and process stability. Adoption is expected to depend on how well inclusions protect protein claims during coating and shelf-life tests. Suppliers should combine clean protein sourcing with texture proof and allergen documentation.”
- Strategic Implications
- Ingredient suppliers should give formulators shelf-life and texture data before sampling begins.
- Dessert brands should test protein inclusions in chilled and frozen formats before expanding claims.
- Kerry launched Smart Taste™ in September 2025 to help food and beverage manufacturers address cost, supply, nutrition, regulation, and sustainability pressures without compromising on taste.
- Investors should separate finished dessert brands from B2B inclusion suppliers that sell across several applications.
Canada is projected to record 11.8% CAGR through 2036, supported by food manufacturing sales and protein snack retailing. The United States is expected to post 11.5% CAGR as protein-led bars and frozen desserts use visible inclusions. France is forecast to reach 11.2% CAGR due to dairy dessert depth and bakery use cases. The United Kingdom is anticipated to record 11.2% CAGR as chilled dessert brands test clearer protein positioning. Germany is estimated to advance at 10.5% CAGR given reformulation pressure and established dairy processing. Japan is projected to reach 9.2% CAGR while food inflation keeps launch economics tightly controlled.
How does the High-Protein Dessert Inclusions Market break down by segment?
Protein crisps & clusters lead Inclusion Type at 36.0%; soy protein leads Protein Source at 31.0%.
Which inclusion type dominates?
Protein crisps & clusters are projected to account for 36.0% share in 2026.
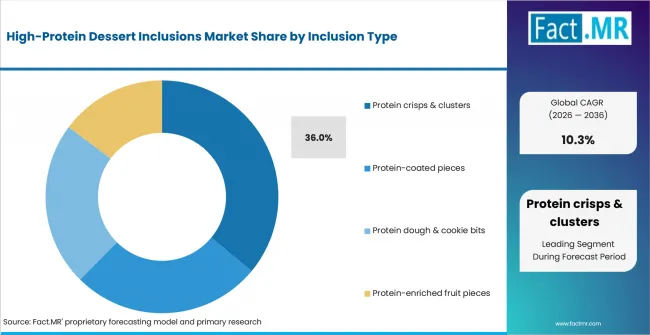
High Protein Dessert Inclusions Market Analysis By Inclusion Type | Source: Fact.MR
Protein crisps & clusters are expected to lead Inclusion Type because they make protein visible in bars, yoghurt toppings and frozen desserts. Protein-coated pieces fit chocolate-style finishes. Dough and cookie bits support bakery-style desserts, while fruit pieces remain selective because moisture control is harder.
What leads the Protein Source segment?
Soy protein is expected to hold 31.0% share in 2026.
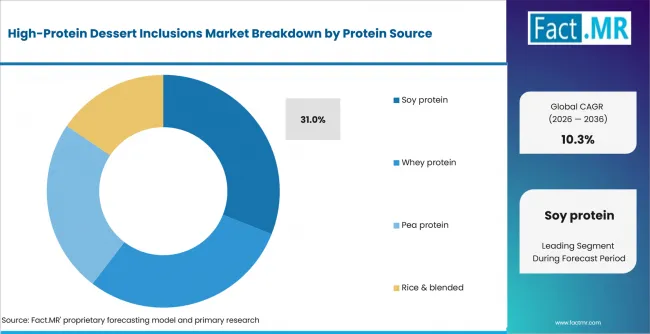
High Protein Dessert Inclusions Market Analysis By Protein Source | Source: Fact.MR
Soy protein is forecast to lead Protein Source due to cost control and proven extrusion behavior. Whey protein supports clean flavor in dairy desserts. Pea protein fits plant-based positioning, while rice and blended proteins help adjust bite when one source becomes too hard.
How does Application shape demand?
Protein bars are anticipated to lead with 33.0% share in 2026.
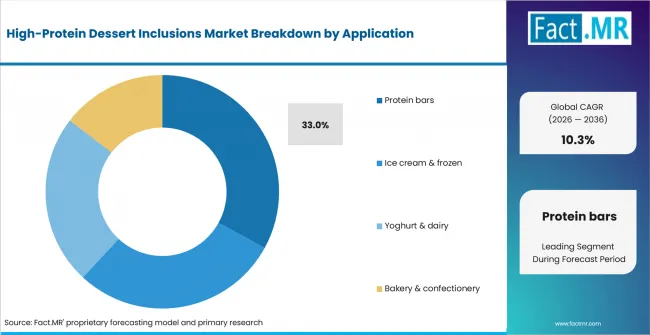
High Protein Dessert Inclusions Market Analysis By Application | Source: Fact.MR
Protein bars lead the Application segment because they combine convenience, portability and targeted nutrition in a familiar snack format. Manufacturers use protein enrichment to support satiety and performance positioning, while ongoing product development focuses on taste, texture and shelf stability to strengthen consumer acceptance across retail channels.
What is accelerating High-Protein Dessert Inclusions Market adoption, and what is holding it back?
Protein-led indulgence drives it; taste masking and allergen control restrain it.
Drivers Impact Analysis
| DRIVER | (~) % IMPACT ON CAGR | GEOGRAPHIC RELEVANCE | IMPACT TIMELINE |
|---|---|---|---|
| Protein enrichment in indulgent formats | +2.8% | North America and Europe | Short term (<= 2 years) |
| Texture-stable crisps and clusters | +2.5% | Protein bar and frozen dessert markets | Short term (<= 2 years) |
| Dairy and frozen dessert use cases | +1.9% | USA, United Kingdom and France | Medium term (2-4 years) |
| Plant and blended protein reformulation | +1.6% | Germany, Canada and Japan | Medium term (2-4 years) |
| Allergen and claim documentation | +1.0% | Regulated retail markets | Long term (>= 4 years) |
- Protein enrichment in indulgent formats: Protein inclusions are expected to let dessert brands add nutrition cues without converting every product into a sports-nutrition item. The mechanism is simple: visible crisps and clusters make the protein addition easy to understand. Cargill’s April 2025 Protein Profile reported that 63% of consumers look for protein in snacks.
- Texture-stable crisps and clusters: Crisps and clusters are anticipated to increase adoption where a clean bite matters more than a powder-only protein boost. Coated pieces help protect crunch during storage and handling.
- Dairy and frozen dessert use cases: Frozen and chilled desserts are projected to widen the addressable buyer base for inclusions. Balchem’s June 2025 IFT FIRST preview said its July 2025 showcase would include a chocolate, plant-based, high-protein soft serve concept.
- Plant and blended protein reformulation: Plant and blended proteins are expected to support brands that want vegetarian or dairy-reduced options. Soy and pea proteins can create texture trade-offs, so masking systems and particle-size control become part of the purchase decision.
- Allergen and claim documentation: Protein inclusions are estimated to face longer approval where soy, milk and wheat-derived materials share facilities. The U.S. FDA’s January 2025 guidance reinforces labeling requirements for the nine major food allergens.
Opportunity Impact Analysis
| OPPORTUNITY | (~) % IMPACT ON CAGR | GEOGRAPHIC RELEVANCE | IMPACT TIMELINE |
|---|---|---|---|
| High-protein frozen desserts | +1.3% | USA, France and United Kingdom | Medium term (2-4 years) |
| Plant and blended protein inclusions | +1.1% | Germany, Canada and Japan | Medium term (2-4 years) |
| Lower-sugar dessert systems | +0.9% | Europe and North America | Long term (>= 4 years) |
| Co-developed texture systems | +0.7% | Global food manufacturers | Long term (>= 4 years) |
- High-protein frozen desserts: Frozen dessert manufacturers are expected to use inclusions as a safer test route before reformulating the full base. A crisp or coated piece can carry protein while the base keeps a familiar texture. USDA NASS reported in April 2026 that U.S. regular ice cream production totaled 845 million gallons in 2025, down 9.2% from 2024.
- Plant and blended protein inclusions: Plant-based and blended inclusions are anticipated to open launches where dairy proteins face label or diet limits. Blended systems can reduce off-notes from any one protein source. The opportunity is strongest where suppliers provide extrusion support and taste masking in the same development package.
- Lower-sugar dessert systems: Lower-sugar desserts are projected to create room for inclusions that add texture and nutrition while sweetness is adjusted. Destatis reported in February 2026 that German sugar, jam, honey and other confectionery prices rose 10.9% year over year in January 2026.
- Co-developed texture systems: Co-development is expected to gain value because dessert inclusions must survive coating, cooling and storage. Ingredient teams can reduce failed pilots when protein source, coating and particle size are tested together.
Restraints Impact Analysis
| RESTRAINT | (~) % IMPACT ON CAGR | GEOGRAPHIC RELEVANCE | IMPACT TIMELINE |
|---|---|---|---|
| Protein off-notes and texture drift | -1.2% | All protein sources | Short term (<= 2 years) |
| Allergen and cross-contact risk | -1.1% | USA, Canada and United Kingdom | Short term (<= 2 years) |
| Cocoa, dairy and sweetener costs | -0.9% | Europe and North America | Medium term (2-4 years) |
| Heat and moisture sensitivity | -0.6% | Frozen and chilled applications | Long term (>= 4 years) |
- Protein off-notes and texture drift: Soy, pea and whey proteins are expected to create taste and bite issues when dosage increases. Off-notes can appear more clearly in sweet products than in savory snacks. Brands therefore need masking systems and lower-risk inclusion formats before approving broad dessert launches.
- Cocoa, dairy and sweetener costs: Coated pieces are expected to face cost pressure when chocolate, dairy solids and sweeteners move sharply. Destatis reported in July 2026 that German sugar, jam, honey and other confectionery prices rose 4.8% year over year in June 2026.
- Heat and moisture sensitivity: Protein pieces can lose crispness when exposed to moisture during mixing or frozen storage. Yoghurt and ice cream applications are expected to require longer storage tests than dry bars.
Which countries are scaling High-Protein Dessert Inclusions Market fastest?
- The country comparison spans 2.60 percentage points and forms two practical growth bands across the forecast period.
- Canada remains 0.30 percentage point above the United States due to food manufacturing activity and snack retail growth.
- The United States remains 0.30 percentage point above France as protein bars and frozen desserts offer larger test windows.
- France remains 0.04 percentage point above the United Kingdom through dairy dessert depth and bakery use cases.
- The United Kingdom remains 0.68 percentage point above Germany while chilled dessert and retail protein positioning stay active.
- Germany remains 1.28 percentage points above Japan as reformulation and ingredient documentation support supplier selection.
- Japan closes the displayed range because food inflation makes launch economics more selective.
Comparable CAGRs create different entry conditions because dessert formats, protein sources and allergen rules vary by country.
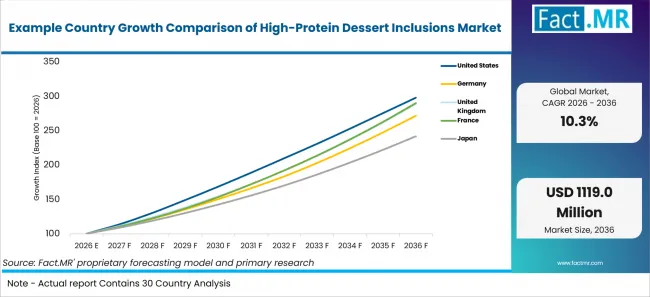
Example Country Growth Comparison Of High Protein Dessert Inclusions Market | Source: Fact.MR
| Country | CAGR (2026-2036) |
|---|---|
| Canada | 11.8% |
| United States | 11.5% |
| France | 11.2% |
| United Kingdom | 11.2% |
| Germany | 10.5% |
| Japan | 9.2% |
What supports United States adoption?
11.5% CAGR, supported by dairy production, protein-bar demand and frozen-dessert applications.
The United States benefits from a large dairy and snack-processing base. Protein bars and frozen desserts create routes for protein crisps, although allergen requirements, dry texture at higher protein levels and premium coating costs can restrain formulation.
How is Germany developing demand?
10.5% CAGR, backed by dairy availability and confectionery reformulation.
Germany’s growth is shaped by established dairy, confectionery and dessert manufacturing. Destatis reported 3.6 million dairy cows in November 2025, while sugar, jam, honey and confectionery prices rose 6.5% in September. Coated protein pieces support reformulation, although chocolate-price inflation, protein off-notes and longer approval processes for multi-allergen inclusions can restrict adoption.
What is driving United Kingdom growth from 2026 to 2036?
11.2% CAGR, supported by dairy supply and chilled-dessert innovation.
The United Kingdom benefits from a substantial dairy base and established chilled-dessert market. Defra reported that UK dairy-herd milk production reached 15,991 million litres in 2025, while the Office for National Statistics reported that food and non-alcoholic beverage prices rose 1.7% in the 12 months to June 2026. Visible protein inclusions support product differentiation, although allergen management, frozen-storage stability and dense textures at higher protein levels remain formulation challenges.
How does France perform?
11.2% CAGR, driven by dairy availability and bakery and confectionery applications.
France’s outlook is supported by dairy production and broad food-processing capabilities. Agreste reported that French cow milk collection increased 5.8% year over year in January 2026 and 5.3% in March 2026Bakery, confectionery and chilled-dessert developers can use protein pieces, although moisture migration, allergen-labeling requirements and premium positioning may limit wider mass-market launches.
What supports Japan demand?
9.2% CAGR, supported by dairy availability and compact functional-dessert formats.
Japan’s demand reflects established dairy processing and interest in compact, differentiated dessert formats. Visible protein cues support premium positioning, although food inflation, storage requirements and dairy or soy allergen considerations can restrict formulation flexibility.
What supports Canada adoption?
11.8% CAGR, backed by food manufacturing activity and snack-product demand.
Canada’s growth is supported by food manufacturing and expanding snack-product sales. Statistics Canada reported food-product manufacturing sales increased 2.0% to CAD 13.3 billion in December 2025, while retail sales of cookies, confectionery and snack foods rose 7.0% year over year. Protein bars and frozen desserts support early adoption, although allergen recalls, validation costs and cold-chain handling remain constraints.
Who leads the High-Protein Dessert Inclusions Market?
CII Foods and Balchem show the direct relevance, while Glanbia strengthens the protein-crisp and bar-inclusion field.
CII Foods supports the market through taste and nutrition systems used by food manufacturers. Balchem contributes through Z-Crisps protein crisps and frozen dessert concepts. Glanbia adds protein solutions for extruded crisps and bar inclusions. Barry Callebaut supports chocolate systems. Cargill and ADM add sweetener and protein capabilities.
Which companies are the key providers?
Key companies include CII Foods, Balchem, Glanbia, Barry Callebaut, Cargill and ADM.
- CII Foods
- Balchem
- Glanbia
- Barry Callebaut
- Cargill
- ADM
Bibliography
- Agreste. (2026, March 11). La collecte de lait de vache progresse en janvier [Cow’s milk collection increases in January].
- Balchem. (2025, June 19). Balchem to showcase functional food & beverage innovations at IFT First 2025.
- Canadian Food Inspection Agency. (2026, August 13). Statistics: Food safety recalls, investigations and complaints.
- Cargill. (2025, April 1). Consumers are seeking more protein for health and taste in 2025.
- Department for Environment, Food & Rural Affairs. (2026, July 9). Agriculture in the United Kingdom 2025. GOV.UK.
- Federal Statistical Office (Destatis). (2025, October 14). Inflation rate at +2.4% in September 2025.
- Food Standards Agency. (2026, June 25). Incidents & Resilience Annual Report 2025/26 (FSA 26/06/07).
- Office for National Statistics. (2026, July 22). Consumer price inflation, UK: June 2026.
- Statistics Bureau of Japan. (2026, January 23). Consumer Price Index: 2025 yearly average.
- Statistics Canada. (2026, March 6). Retail Commodity Survey, December 2025.
- U.S. Department of Agriculture, National Agricultural Statistics Service. (2026, April 24). Dairy Products 2025 Summary.
- U.S. Department of Agriculture, National Agricultural Statistics Service. (2026, February 20). Milk Production.
This Report Answers
- The report provides strategic intelligence on the High-Protein Dessert Inclusions Market across inclusion formats that connect to protein ingredients and plant protein ingredients.
- Segment analysis covers crisps, clusters and coated pieces used in food coating ingredients and functional snacks applications.
- Application analysis evaluates protein bars and frozen desserts alongside protein bar and ice cream categories.
- Protein-source analysis covers soy, whey, pea and blended systems connected to functional dairy ingredients and low fat protein snacks.
- Competitive analysis profiles CII Foods and Balchem alongside Glanbia, Barry Callebaut, Cargill and ADM for nutraceutical confectionery and functional bakery ingredients use cases.
What does the High-Protein Dessert Inclusions Market cover?
High-protein dessert inclusions are used to add protein, texture and visual claim support inside indulgent food formats.
The market covers crisps, clusters and coated pieces. It includes protein-enriched fruit pieces. Soy, whey, pea and blended proteins are included. Applications cover bars and frozen desserts. Yoghurt, dairy, bakery and confectionery products are also included.
What is included in the scope?
The scope includes B2B inclusions sold to food manufacturers, contract manufacturers and brands for high-protein desserts or sweet snack formats.
Coverage includes inclusion design, protein source selection and application fit. Products qualify when the inclusion contributes directly to protein positioning in a dessert or sweet snack application.
What is excluded from the scope?
Finished desserts without a distinct protein inclusion remain outside the scope of this market.
The scope excludes plain protein powders, finished retail bars and ordinary confectionery pieces with no protein role. Company revenue without a clear inclusion link is excluded.
How Was the Analysis Built?
The analysis draws on 120+ sources, 35+ company portfolios, 25+ countries, and more than 20 industry interviews.
- Primary Research: Primary research includes discussions with manufacturers, service providers, technology developers, distributors, end users, procurement teams, and subject-matter experts. These conversations examine purchasing priorities, product adoption, operational challenges, approval requirements, competitive positioning, and the factors that influence wider market acceptance.
- Desk Research: Desk research covers government statistics, regulatory publications, company filings, trade data, technical studies, industry associations, standards, public policy, and other authoritative sources. Every source used in the analysis is documented in the bibliography.
- Market Sizing and Forecasting: Market estimates combine historical performance, demand indicators, pricing and volume trends, segment shares, company participation, country-level growth, adoption patterns, investment activity, and barriers to market expansion.
- Data Validation and Update Cycle: Findings are validated by comparing primary interviews with public data, company activity, regulatory changes, trade patterns, and industry developments. Regular updates review new product launches, capacity changes, partnerships, approvals, procurement trends, and shifts in commercial adoption.
What is the report’s scope and coverage?
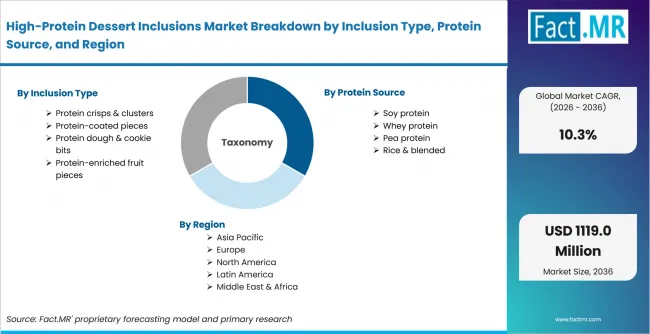
High Protein Dessert Inclusions Market Breakdown By Inclusion Type, Protein Source, And Region | Source: Fact.MR
| Attribute | Details |
|---|---|
| Quantitative Units | USD million in 2026 to USD million by 2036 at CAGR |
| Market Definition | Protein-rich crisps, clusters, coated pieces, dough bits and fruit pieces used inside high-protein dessert and snack applications where texture, protein declaration and process stability affect acceptance |
| Inclusion Type | Protein crisps & clusters; Protein-coated pieces; Protein dough & cookie bits; Protein-enriched fruit pieces |
| Protein Source | Soy protein; Whey protein; Pea protein; Rice & blended |
| Application | Protein bars; Ice cream & frozen desserts; Yoghurt & dairy; Bakery & confectionery |
| Regions Covered | North America; Latin America; Europe; East Asia; South Asia and Pacific; Middle East and Africa |
| Countries Covered | United States; Germany; United Kingdom; France; Japan; Canada |
| Key Companies Profiled | CII Foods; Balchem; Glanbia; Barry Callebaut; Cargill; ADM |
| Forecast Period | 2026 to 2036 |
| Approach | Hybrid top-down and bottom-up approach using dessert launches; protein ingredient demand; bar and frozen dessert application fit; country food data; allergen regulation; formulation constraints; company portfolio review and ingredient supplier activity |
How is the market segmented?
-
By Inclusion Type
- Protein crisps & clusters
- Protein-coated pieces
- Protein dough & cookie bits
- Protein-enriched fruit pieces
-
By Protein Source
- Soy protein
- Whey protein
- Pea protein
- Rice & blended
-
By Application
- Protein bars
- Ice cream & frozen desserts
- Yoghurt & dairy
- Bakery & confectionery
-
By Region
- North America
- Latin America
- Europe
- East Asia
- South Asia and Pacific
- Middle East and Africa