HVDC Converter Station Market Size, Share, Growth and Forecast (2026 - 2036)
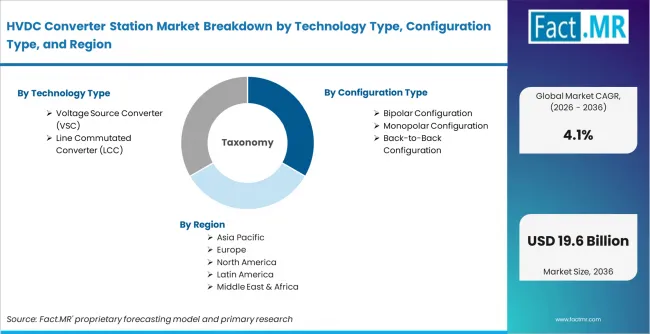
HVDC Converter Station Market is segmented by Technology Type (Voltage Source Converter (VSC), Line Commutated Converter (LCC)), Configuration Type (Bipolar Configuration, Monopolar Configuration, Back-to-Back Configuration), Component (Converter Valves, Transformers, Filters, Control and Protection Systems), and Region, with forecasts covering the period from 2026 to 2036.
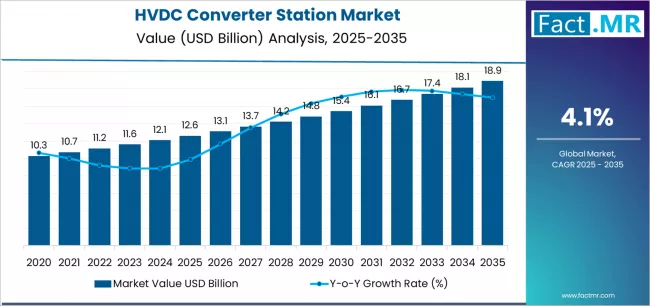
According to Fact.MR estimates, the global hvdc converter station Market was valued at USD 12.6 billion in 2025. The market is projected to reach USD 13.1 billion in 2026 and is expected to grow to USD 19.6 billion by 2036, expanding at a CAGR of 4.1%. Voltage Source Converter (VSC) is anticipated to account for 60.0% of the product segment in 2026, while Bipolar Configuration is expected to remain the leading application with around 50.0% share.
HVDC Converter Station Market Analysis and Forecast by Fact.MR
- The global HVDC converter station market is estimated at USD 13.12 billion in 2026 and is forecast to expand at a CAGR of 4.1% to reach USD 19.60 billion by 2036.
- HVDC converter stations convert alternating current to direct current and back, enabling efficient long-distance power transmission, grid interconnection, offshore wind integration, and urban underground cable systems.
- The market is driven by the need to connect remote renewable energy zones to demand centers, cross-border grid interconnections, offshore wind farm grid connections, urban power supply through compact underground systems, and UHV grid development in China and India.
- VSC technology with modular multilevel converters (MMC) is gaining specification preference for its black-start capability, compact footprint, and multi-terminal flexibility.
Summary of HVDC Converter Station Market
- Market Snapshot
- In 2025, the global HVDC Converter Station Market was valued at approximately USD 12.6 billion.
- The market is estimated to reach USD 13.12 billion in 2026 and is projected to attain USD 19.60 billion by 2036.
- The HVDC converter station market is likely to expand at a CAGR of 4.1% during the forecast period.
- The market is anticipated to create an absolute dollar opportunity of USD 6.49 billion between 2026 and 2036.
- Converter valves account for 30% of component share in 2026.
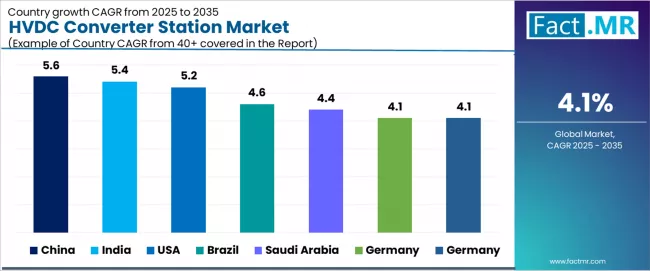
- China (5.6%) and India (5.4%) are the key growth markets during the forecast period.
- Demand and Growth Drivers
- Long-distance transmission of renewable energy from remote generation zones to distant load centers is the primary driver, with HVDC delivering lower losses than AC over distances exceeding 600 km.
- Offshore wind farm grid connection using VSC-HVDC technology is creating sustained project pipelines across Europe, the UK, and emerging Asian offshore wind markets.
- Cross-border grid interconnection for electricity trading, supply security, and renewable energy arbitrage is driving new HVDC links between countries and regional grids.
- UHV-HVDC grid development in China and India's 800 kV transmission corridors are creating demand for the highest-capacity converter station installations.
- Urban underground power supply requirements in congested metropolitan areas are driving adoption of compact VSC-HVDC systems that minimize surface footprint.
- Product and Segment View
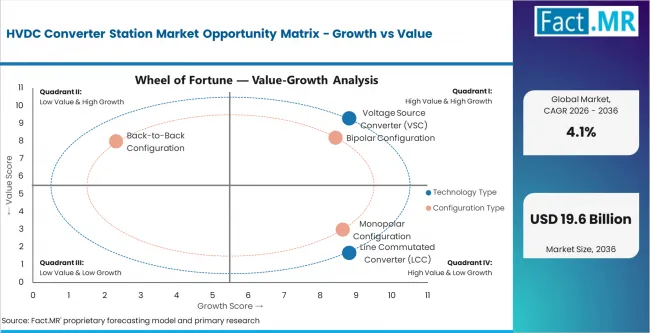
- Voltage source converter (VSC) technology accounts for 60% of the technology type segment in 2026, driven by its black-start capability, compact footprint, multi-terminal flexibility, and suitability for offshore wind and urban applications.
- Bipolar configuration holds 50% of the configuration type segment in 2026, providing the reliability and redundancy required for critical bulk power transmission links.
- High voltage HVDC (300 to 800 kV) accounts for 45% of the voltage level segment, covering the majority of long-distance transmission and interconnection projects.
- Key segmentation includes:
- Technology Type: VSC (MMC, two/three-level), LCC (classic, back-to-back)
- Configuration Type: Bipolar, Monopolar, Back-to-back
- Component: Converter valves, Transformers, Filters, Control and protection systems
- Application: Long-distance power transmission, Renewable energy integration, Grid interconnection, Urban power supply
- Voltage Level: Medium voltage HVDC, High voltage HVDC, Ultra-high voltage HVDC
- These systems enable:
- Efficient bulk power transfer over distances exceeding 600 km with lower losses than equivalent AC transmission
- Offshore wind farm grid connection where subsea AC cable capacitance limits make HVDC the only viable technology
- Asynchronous grid interconnection enabling power exchange between systems operating at different frequencies
- Geography and Competitive Outlook
- Asia Pacific leads growth through China and India, driven by UHV grid development, renewable energy evacuation, and interregional power transmission corridors.
- Europe sustains demand through offshore wind HVDC connections, cross-border interconnectors, and UK subsea link programs worth over 22 billion GBP.
- North America is accelerating through the USA, driven by Grid United's multi-project pipeline, SunZia commissioning, and Champlain Hudson Power Express.
- China (5.6%) and India (5.4%) lead growth, while the USA (5.2%), Brazil (4.6%), Saudi Arabia (4.4%), Germany (4.1%), and the UK (4.1%) sustain demand.
- Major players include Hitachi Energy Ltd., Siemens Energy AG, GE Grid Solutions, ABB, and Mitsubishi Electric Corporation.
- Analyst Opinion
- Shambhu Nath Jha, Principal Consultant at Fact.MR, says 'The HVDC converter station market is entering an unprecedented growth phase as renewable energy integration, grid interconnection, and load growth from data centers converge to create multi-decade project pipelines. Hitachi Energy's contracts from SSEN Transmission for two Scottish subsea links in January 2026, combined with its 950 km, 6 GW India renewable evacuation project and the SunZia commissioning in the USA, demonstrate the global breadth of HVDC demand. The competitive landscape is tightening around Hitachi Energy, Siemens Energy, and GE Vernova, which collectively held 60 to 65% of 2025 order intake. Chinese manufacturers NR Electric and C-EPRI are expanding abroad, creating pricing pressure in emerging markets while the technology frontier shifts toward multi-terminal VSC systems and grid-forming converter capabilities.'
Key Growth Drivers, Constraints, and Opportunities
Key Factors Driving Growth
- Renewable energy zone evacuation requiring HVDC links exceeding 600 km is creating multi-billion-dollar project pipelines across India, China, the USA, and the Middle East.
- Offshore wind farm connection using VSC-HVDC is driving sustained demand in Europe, the UK, and emerging Asian offshore markets where subsea AC cables are impractical.
- Grid interconnection for energy security and renewable arbitrage is multiplying cross-border HVDC links, with Europe targeting 15% interconnection by 2030.
Key Market Constraints
- Long project development cycles of 7 to 10 years from planning to commissioning create revenue recognition delays and capital commitment uncertainty for manufacturers.
- Concentrated supply chain with three manufacturers holding 60 to 65% of order intake creates bottleneck risks and limits buyer negotiating leverage on large projects.
- Permitting and community acceptance challenges for converter station siting and transmission corridor routing create project delay and cancellation risks.
Key Opportunity Areas
- Multi-terminal VSC-HVDC networks enabling meshed offshore grids and interconnected renewable zones represent the next technology frontier for converter station design.
- Grid-forming converter capabilities that provide synthetic inertia and black-start support are creating premium specification opportunities as synchronous generation retires.
- Emerging market HVDC deployment in the Middle East, Africa, and ASEAN is creating new project pipelines as these regions build long-distance transmission infrastructure.
Segment-wise Analysis of the HVDC Converter Station Market
- VSC technology holds 60% of the technology type segment in 2026, driven by offshore wind, urban applications, and multi-terminal capability advantages over LCC.
- Long-distance power transmission accounts for 40% of the application segment in 2026, reflecting HVDC's fundamental advantage in bulk power transfer over distances exceeding 600 km.
- Converter valves account for 30% of the component segment, representing the highest-value technology element of converter station construction.
The market is segmented by technology type, configuration, component, application, voltage level, and region. VSC leads by technology. Bipolar leads by configuration. Converter valves lead by component value, and long-distance transmission leads by application.
Which Technology Type Segment Dominates the HVDC Converter Station Market?
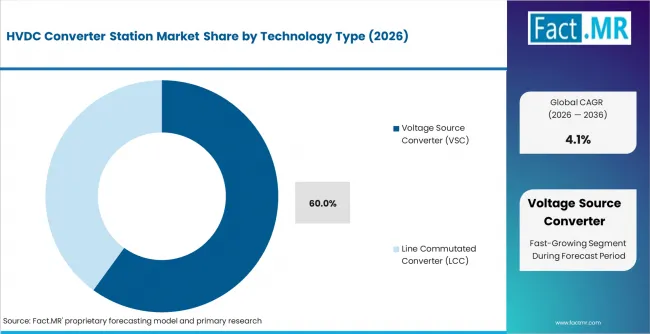
Voltage source converter (VSC) technology accounts for 60% of the technology type segment in 2026. Modular multilevel converters (MMC) deliver black-start capability, compact footprint, multi-terminal flexibility, and low harmonic distortion that make them the preferred choice for offshore wind connections, urban underground systems, and grid interconnections. VSC is growing at 8.1% CAGR, faster than the overall market.
Line commutated converter (LCC) technology serves ultra-high-voltage bulk power transmission, particularly in China where 800 kV thyristor-based systems minimize losses over 2,000 km routes. LCC retained 59% of installed capacity in 2025 due to China's UHV program, but VSC is gaining share in new project specifications.
Which Application Segment Dominates the HVDC Converter Station Market?
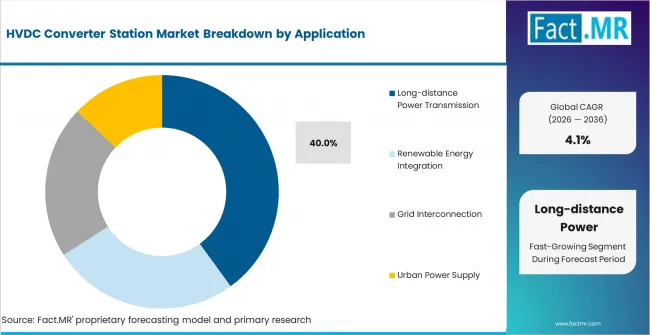
Long-distance power transmission accounts for 40% of the application segment in 2026. Interregional bulk power transfer and renewable energy evacuation from remote generation zones to distant load centers represent the core demand driver. India's 950 km Bhadla-to-Fatehpur 6 GW link and the USA's SunZia 885 km wind power connection exemplify this application.
Renewable energy integration is the second-largest and fastest-growing application, driven primarily by offshore wind farm connections. Grid interconnection serves energy trading and supply security through cross-border links. Urban power supply using compact VSC systems serves congested metropolitan areas where underground cables replace overhead lines.
Which Configuration Segment Dominates the HVDC Converter Station Market?
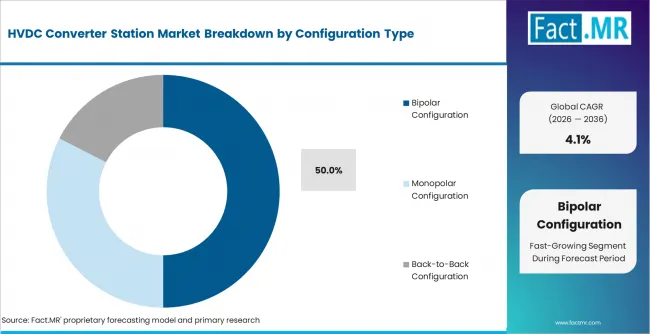
Bipolar configuration accounts for 50% of the configuration type segment in 2026. Symmetrical and asymmetrical bipole configurations provide the reliability and redundancy required for critical transmission links, enabling continued partial operation if one pole fails. Most major new HVDC projects specify bipolar configuration for operational security.
Monopolar configurations serve smaller-capacity links and initial project phases where cost optimization takes priority over redundancy. Back-to-back configurations serve asynchronous grid interconnection where no transmission line is required, enabling direct frequency conversion between grid systems.
Which Product Trend is Shaping the Next Phase of Growth in the HVDC Converter Station Market?
Grid-forming VSC-HVDC converter stations with multi-terminal capability are the defining product trend. As synchronous generation retires and renewable penetration increases, converter stations must provide synthetic inertia, frequency support, and black-start capability that traditional LCC technology cannot deliver. Hitachi Energy's HVDC Light technology, deployed on the SunZia project now commissioning in 2026 as the largest VSC installation in the USA, demonstrates the scale at which grid-forming converters are being deployed.
Hitachi Energy received contracts from SSEN Transmission in January 2026 for two Scottish subsea HVDC links, part of a 22 billion GBP investment to upgrade Scotland's transmission network for renewable energy. In India, Hitachi Energy and BHEL were awarded a 950 km, 6 GW HVDC project at 800 kV connecting Bhadla's solar zone to Fatehpur. Siemens Energy was named preferred bidder for the UK's EGL4 project. GE Vernova's Ostwind 4 contract marks its re-entry into offshore HVDC. These concurrent mega-projects across three continents confirm the structural demand acceleration.
Regional Outlook Across Key Markets
.webp)
| Country | CAGR (%) |
|---|---|
| China | 5.6% |
| India | 5.4% |
| USA | 5.2% |
| Brazil | 4.6% |
| Saudi Arabia | 4.4% |
| Germany | 4.1% |
| UK | 4.1% |
- China leads growth at 5.6%, driven by continued UHV grid development, renewable energy evacuation, and digital substation integration.
- India follows at 5.4%, supported by 800 kV transmission corridors, massive renewable evacuation, and interstate power transfer requirements.
- The USA grows at 5.2%, driven by Grid United's multi-project pipeline, SunZia commissioning, and Champlain Hudson Power Express.
- Europe sustains growth through the UK (4.1%) and Germany (4.1%), driven by offshore wind HVDC connections and cross-border interconnectors.
Source: Fact MR (FMR) analysis, based on proprietary forecasting model and primary research.
Market Outlook for HVDC Converter Stations in China
The China HVDC converter station market is projected to grow at a CAGR of 5.6% through 2036. Demand is driven by continued UHV grid expansion, renewable energy evacuation from western provinces, offshore wind connection, and digital substation integration.
- UHV grid expansion creates demand for highest-capacity converter stations.
- Renewable evacuation links western generation to eastern load centers.
- Domestic manufacturers NR Electric and C-EPRI anchor local supply.
HVDC Converter Station Demand Trends in India
The India market is projected to grow at a CAGR of 5.4% through 2036. Growth is supported by 800 kV transmission corridors, the 6 GW Bhadla-Fatehpur link, renewable energy evacuation, and interstate power transfer requirements.
- 800 kV corridors create demand for ultra-high-capacity stations.
- Renewable evacuation links solar zones to industrial demand centers.
- BHEL and Hitachi Energy consortium anchors domestic project delivery.
United States HVDC Converter Station Market Growth Assessment
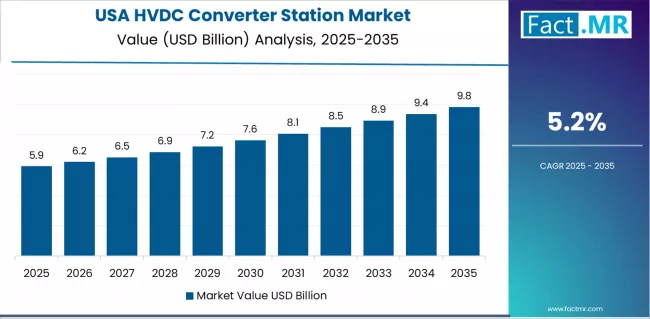
The U.S. market is projected to grow at a CAGR of 5.2% through 2036. Demand is driven by Grid United's multi-project pipeline, SunZia commissioning, Champlain Hudson Power Express, and growing load from data centers.
- Grid United's pipeline creates multi-year converter station demand.
- SunZia commissioning validates large-scale VSC deployment in the USA.
- Data center load growth accelerates interregional transmission planning.
United Kingdom HVDC Converter Station Market Demand Analysis
The UK market is projected to grow at a CAGR of 4.1% through 2036. Demand is shaped by SSEN Transmission's 22 billion GBP program, offshore wind connections, EGL3 and EGL4 subsea links, and cross-channel interconnectors.
- SSEN program drives multi-project converter station procurement.
- Offshore wind expansion creates sustained HVDC connection demand.
- Cross-channel interconnectors enable renewable energy trading.
Brazil HVDC Converter Station Market Opportunity Outlook
The Brazil market is projected to grow at a CAGR of 4.6% through 2036. Demand is supported by interregional power transfer, hydropower evacuation, renewable energy integration, and the Brazil-Argentina interconnector project.
- Interregional transfer links hydropower to demand centers.
- Renewable integration creates new HVDC connection requirements.
- Brazil-Argentina interconnector represents cross-border demand.
Competitive Benchmarking and Company Positioning
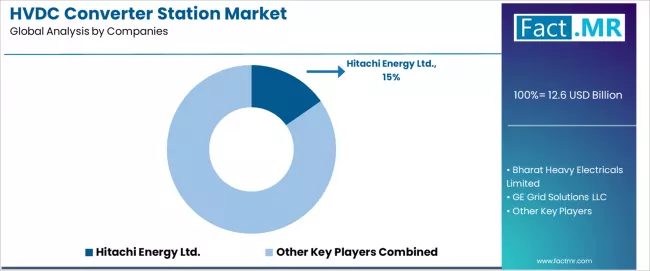
HVDC Converter Station Market Analysis By Company
- Hitachi Energy Ltd. dominates with approximately 15% market share through HVDC Light VSC technology, the world's largest installed base, and active mega-project pipelines across three continents.
- Siemens Energy AG and GE Grid Solutions compete through established HVDC platforms, offshore wind project experience, and growing VSC capabilities.
- HVDC technology portfolio breadth, project reference depth, VSC capability, and global delivery capacity are primary differentiators.
The competitive landscape is highly concentrated, with Hitachi Energy, Siemens Energy, and GE Vernova collectively holding 60 to 65% of 2025 order intake. Hitachi Energy leads with approximately 15% market share, having pioneered commercial HVDC 70 years ago and delivered more than half the world's HVDC projects. Its HVDC Light VSC technology is deployed on SunZia, SSEN Scottish links, and India's 6 GW Bhadla corridor.
Siemens Energy AG maintains a strong position in offshore wind HVDC connections and was named preferred bidder for the UK's EGL4 project. GE Vernova's Ostwind 4 contract marks its re-entry into offshore HVDC. ABB's legacy HVDC portfolio continues to generate aftermarket and upgrade demand.
Chinese manufacturers NR Electric, C-EPRI, and XJ Electric are expanding internationally with competitive pricing, particularly for LCC-based UHV projects. Mitsubishi Electric, Toshiba, BHEL, Hyosung, and LSIS serve specific regional markets and project types.
Strategic priorities include expanding multi-terminal VSC capabilities, developing grid-forming converter features, building local manufacturing in key markets, and securing long-term framework agreements with transmission utilities.
Key Companies in the HVDC Converter Station Market
- Hitachi Energy Ltd. and Siemens Energy AG are the dominant global players, supported by technology leadership, project reference depth, and active mega-project pipelines.
- GE Grid Solutions LLC, ABB, and Mitsubishi Electric Corporation hold established positions through specific technology platforms and regional project experience.
- NR Electric, C-EPRI, XJ Electric, BHEL, Hyosung, LSIS, Toshiba, and Crompton Greaves compete through regional strength, price competitiveness, and government-supported project participation.
Recent Industry Developments
- Hitachi Energy Ltd. - Contract Award / SSEN Transmission Scottish HVDC Links (January 2026)
- Hitachi Energy received contracts from SSEN Transmission to design, procure, manufacture, install, and commission HVDC converter stations for two planned subsea cable links in northern Scotland, part of a 22 billion GBP transmission upgrade program.
- Hitachi Energy Ltd. - Mega-Project / 950 km 6 GW India Renewable Evacuation HVDC (April 2025)
- A consortium of Hitachi Energy and BHEL was awarded a contract by Adani Energy Solutions to deliver 800 kV, 6 GW HVDC terminals connecting the Bhadla renewable energy zone in Rajasthan to Fatehpur in Uttar Pradesh, powering approximately 60 million households.
- Siemens Energy AG - Preferred Bidder / UK Eastern Green Link 4 HVDC (2025)
- Siemens Energy was named preferred bidder to build two HVDC converter stations on the 2.5 billion GBP Eastern Green Link 4 project connecting Scotland and England, strengthening its position in the UK offshore and subsea HVDC transmission market.
Leading Companies Shaping the HVDC Converter Station Market
- Hitachi Energy Ltd.
- Bharat Heavy Electricals Limited (BHEL)
- GE Grid Solutions LLC
- Mitsubishi Electric Corporation
- Siemens Energy AG
- ABB
- Hyosung
- LSIS
- NR Electric Co., Ltd
- Toshiba Corporation
- C-Epri Power Engineering Company
- Crompton Greaves Ltd
- XJ Electric
Sources and Research References
- Hitachi Energy Ltd. SSEN Transmission Scottish HVDC contracts and India 6 GW Bhadla HVDC documentation.
- Siemens Energy AG. Eastern Green Link 4 preferred bidder announcement.
- SSEN Transmission. 22 billion GBP north of Scotland transmission investment program.
- Transmission expansion databases, offshore wind connection schedules, and grid interconnection project records.
- Primary interviews with converter manufacturers, transmission utilities, offshore wind developers, and grid consultants.
This bibliography is provided for reader reference and is not exhaustive. The full report contains the complete reference list and detailed citations.
Key Questions This Report Addresses
- What is the current and future size of the HVDC Converter Station market?
- How fast is the market expected to grow between 2026 and 2036?
- Which technology type leads in 2026?
- Which application holds highest share?
- What drives demand?
- How is offshore wind influencing the market?
- Why is China the fastest-growing market?
- How are grid-forming converters shaping the market?
- Which countries show fastest growth?
- Who are the key companies?
- How does Fact.MR validate the forecast?
HVDC Converter Station Market Definition
The HVDC converter station market covers voltage source converter and line commutated converter stations that convert AC to DC and back for long-distance power transmission, grid interconnection, offshore wind connection, and urban underground power supply.
HVDC Converter Station Market Inclusions
- The scope covers global and regional market size and forecasts for 2026 to 2036 across technology type, configuration, component, application, voltage level, and region.
- It includes analysis of transmission expansion plans, offshore wind connection pipelines, grid interconnection projects, and renewable energy evacuation requirements.
- The report covers pricing and cost analysis across converter technologies including capital costs, losses, and lifecycle economics.
- It covers technology trends, market drivers, and competitive landscape including order pipelines and technology roadmaps of leading manufacturers.
HVDC Converter Station Market Exclusions
- The scope excludes HVDC cables, overhead lines, and transmission infrastructure between converter stations.
- It excludes AC substations, transformers, and switchgear not integral to HVDC converter station construction.
- The report excludes FACTS devices (SVC, STATCOM) serving reactive power compensation rather than AC-DC conversion.
- It also excludes converter station maintenance services and spare parts sold independently of new station construction.
HVDC Converter Station Market Research Methodology
- The methodology combines secondary research, primary interviews, and forecast modelling.
- It draws on 80+ secondary sources and benchmarks 15+ manufacturer project portfolios and order pipelines.
- Market sizing covers 25+ countries through a demand-side model, supported by top-down validation.
- Key inputs include transmission expansion plans, offshore wind connection schedules, grid interconnection project databases, and converter technology cost curves.
- The model cross-checks demand with manufacturer capacity, project completion rates, and capital expenditure data.
- Primary validation includes 20+ interviews across converter manufacturers, transmission utilities, offshore wind developers, and grid consultants.
- Final estimates go through project-pipeline checks, technology-mix analysis, and sensitivity testing.
Scope of Analysis

| Parameter | Details |
|---|---|
| Quantitative Units | USD 13.12 billion to USD 19.60 billion, at a CAGR of 4.1% |
| Market Definition | The market covers VSC and LCC converter stations for AC-DC conversion enabling long-distance transmission, grid interconnection, offshore wind connection, and urban power supply. |
| Regions Covered | North America, Latin America, Europe, East Asia, South Asia and Pacific, Middle East and Africa |
| Countries Covered | China, India, USA, Brazil, Saudi Arabia, Germany, UK, 25 plus countries |
| Key Companies | Hitachi Energy, BHEL, GE Grid Solutions, Mitsubishi Electric, Siemens Energy, ABB, Hyosung, NR Electric, Toshiba, C-EPRI, XJ Electric |
| Forecast Period | 2026 to 2036 |
| Approach | Hybrid demand-side and top-down methodology built on transmission expansion plans, offshore wind pipelines, grid interconnection databases, and primary interviews across manufacturers, utilities, and grid consultants |
HVDC Converter Station Market Segmentation
-
HVDC Converter Station Market Segmented by Technology Type:
- Voltage Source Converter (VSC)
- Modular Multilevel Converter (MMC)
- High Efficiency
- Flexible Control
- Two-level and Three-level VSC
- Compact Design
- Urban Applications
- Modular Multilevel Converter (MMC)
- Line Commutated Converter (LCC)
- Classic HVDC Systems
- Thyristor-based Converters
- High Power Transmission
- Back-to-Back LCC
- Grid Interconnection
- Asynchronous Links
- Classic HVDC Systems
- Voltage Source Converter (VSC)
-
HVDC Converter Station Market Segmented by Configuration Type:
- Bipolar Configuration
- Symmetrical Bipole
- Balanced Operation
- High Reliability
- Asymmetrical Bipole
- Flexible Operation
- Fault Tolerance
- Symmetrical Bipole
- Monopolar Configuration
- Single Pole Systems
- Ground Return
- Low Cost
- Metallic Return Systems
- Improved Reliability
- Reduced Losses
- Single Pole Systems
- Back-to-Back Configuration
- Direct Grid Coupling
- No Transmission Line
- Short Distance
- Frequency Conversion
- Grid Synchronization
- Power Exchange
- Direct Grid Coupling
- Bipolar Configuration
-
HVDC Converter Station Market Segmented by Component:
- Converter Valves
- Thyristor Valves
- LCC Systems
- High Voltage
- IGBT Valves
- VSC Systems
- Fast Switching
- Thyristor Valves
- Transformers
- Converter Transformers
- Voltage Conversion
- Grid Integration
- Smoothing Reactors
- Ripple Reduction
- Current Stability
- Converter Transformers
- Filters
- AC Filters
- Harmonic Filtering
- Voltage Stability
- DC Filters
- Ripple Filtering
- Power Quality
- AC Filters
- Control and Protection Systems
- Control Systems
- SCADA Integration
- Automation
- Protection Systems
- Fault Detection
- System Security
- Control Systems
- Converter Valves
-
HVDC Converter Station Market Segmented by Application:
- Long-distance Power Transmission
- Bulk Power Transfer
- Interregional Transmission
- Cross-border Links
- Ultra High Voltage Transmission
- UHVDC Projects
- High Capacity Lines
- Bulk Power Transfer
- Renewable Energy Integration
- Offshore Wind Integration
- Grid Connection
- Power Stabilization
- Solar Power Integration
- Desert Solar Projects
- Long Distance Transfer
- Offshore Wind Integration
- Grid Interconnection
- Asynchronous Grid Links
- Frequency Conversion
- Stability Enhancement
- Back-to-Back Stations
- Urban Grids
- Industrial Zones
- Asynchronous Grid Links
- Urban Power Supply
- Metro Cities
- Underground Cables
- Compact Stations
- Industrial Clusters
- Reliable Power Supply
- Load Balancing
- Metro Cities
- Long-distance Power Transmission
-
HVDC Converter Station Market Segmented by Voltage Level:
- High Voltage HVDC
- 300–600 kV
- Long Distance Transmission
- Bulk Power
- 600–800 kV
- UHVDC Systems
- Cross-country Links
- 300–600 kV
- Medium Voltage HVDC
- Below 150 kV
- Industrial Applications
- Urban Grids
- 150–300 kV
- Regional Transmission
- Medium Distance
- Below 150 kV
- Ultra High Voltage (UHVDC)
- Above 800 kV
- Mega Projects
- Intercontinental Transmission
- Advanced UHV Systems
- High Capacity Lines
- Low Loss Transmission
- Above 800 kV
- High Voltage HVDC
-
HVDC Converter Station Market by Region:
- North America
- USA
- Canada
- Mexico
- Latin America
- Brazil
- Chile
- Rest of Latin America
- Western Europe
- Germany
- UK
- Italy
- Spain
- France
- Nordic
- BENELUX
- Rest of Western Europe
- Eastern Europe
- Russia
- Poland
- Hungary
- Balkan & Baltic
- Rest of Eastern Europe
- East Asia
- China
- Japan
- South Korea
- South Asia and Pacific
- India
- ASEAN
- Australia & New Zealand
- Rest of South Asia and Pacific
- Middle East & Africa
- Kingdom of Saudi Arabia
- Other GCC Countries
- Turkiye
- South Africa
- Other African Union
- Rest of Middle East & Africa
- North America
- Frequently Asked Questions -
How much will the Gas Turbine Market grow between 2026 and 2036?
The Gas Turbine Market is expected to grow at a 2.8% CAGR between 2026 and 2036.
What are the key product types in the Gas Turbine Market?
The key product types are heavy duty gas turbines (F-class, H-class), aeroderivative turbines, and industrial gas turbines.
Which application holds the highest share in the Gas Turbine Market in 2026?
Power generation is expected to account for 50% share in 2026 in the Gas Turbine Market.
Which are the fastest-growing countries in the Gas Turbine Market?
India (4.2%) and China (3.9%) are the fastest-growing countries during the forecast period.
Which application holds highest share in 2026?
Long-distance power transmission is expected to account for 40% share in 2026.
Which are the fastest-growing countries?
China (5.6%) and India (5.4%) are the fastest-growing countries during the forecast period.
Table of Content
- Executive Summary
- Global Market Outlook
- Demand to side Trends
- Supply to side Trends
- Analysis and Recommendations
- Market Overview
- Market Coverage / Taxonomy
- Market Definition / Scope / Limitations
- Research Methodology
- Chapter Orientation
- Analytical Lens and Working Hypotheses
- Market Structure, Signals, and Trend Drivers
- Benchmarking and Cross-market Comparability
- Market Sizing, Forecasting, and Opportunity Mapping
- Research Design and Evidence Framework
- Desk Research Programme (Secondary Evidence)
- Company Annual and Sustainability Reports
- Peer-reviewed Journals and Academic Literature
- Corporate Websites, Product Literature, and Technical Notes
- Earnings Decks and Investor Briefings
- Statutory Filings and Regulatory Disclosures
- Technical White Papers and Standards Notes
- Trade Journals, Industry Magazines, and Analyst Briefs
- Conference Proceedings, Webinars, and Seminar Materials
- Government Statistics Portals and Public Data Releases
- Press Releases and Reputable Media Coverage
- Specialist Newsletters and Curated Briefings
- Sector Databases and Reference Repositories
- Fact.MR Internal Proprietary Databases and Historical Market Datasets
- Subscription Datasets and Paid Sources
- Social Channels, Communities, and Digital Listening Inputs
- Additional Desk Sources
- Expert Input and Fieldwork (Primary Evidence)
- Primary Modes
- Qualitative Interviews and Expert Elicitation
- Quantitative Surveys and Structured Data Capture
- Blended Approach
- Why Primary Evidence is Used
- Field Techniques
- Interviews
- Surveys
- Focus Groups
- Observational and In-context Research
- Social and Community Interactions
- Stakeholder Universe Engaged
- C-suite Leaders
- Board Members
- Presidents and Vice Presidents
- R&D and Innovation Heads
- Technical Specialists
- Domain Subject-matter Experts
- Scientists
- Physicians and Other Healthcare Professionals
- Governance, Ethics, and Data Stewardship
- Research Ethics
- Data Integrity and Handling
- Primary Modes
- Tooling, Models, and Reference Databases
- Desk Research Programme (Secondary Evidence)
- Data Engineering and Model Build
- Data Acquisition and Ingestion
- Cleaning, Normalisation, and Verification
- Synthesis, Triangulation, and Analysis
- Quality Assurance and Audit Trail
- Market Background
- Market Dynamics
- Drivers
- Restraints
- Opportunity
- Trends
- Scenario Forecast
- Demand in Optimistic Scenario
- Demand in Likely Scenario
- Demand in Conservative Scenario
- Opportunity Map Analysis
- Product Life Cycle Analysis
- Supply Chain Analysis
- Investment Feasibility Matrix
- Value Chain Analysis
- PESTLE and Porter’s Analysis
- Regulatory Landscape
- Regional Parent Market Outlook
- Production and Consumption Statistics
- Import and Export Statistics
- Market Dynamics
- Global Market Analysis 2021 to 2025 and Forecast, 2026 to 2036
- Historical Market Size Value (USD Million) Analysis, 2021 to 2025
- Current and Future Market Size Value (USD Million) Projections, 2026 to 2036
- Y to o to Y Growth Trend Analysis
- Absolute $ Opportunity Analysis
- Global Market Pricing Analysis 2021 to 2025 and Forecast 2026 to 2036
- Global Market Analysis 2021 to 2025 and Forecast 2026 to 2036, By Technology Type
- Introduction / Key Findings
- Historical Market Size Value (USD Million) Analysis By Technology Type, 2021 to 2025
- Current and Future Market Size Value (USD Million) Analysis and Forecast By Technology Type, 2026 to 2036
- Voltage Source Converter (VSC)
- Modular Multilevel Converter (MMC)
- High Efficiency
- Flexible Control
- Two-level and Three-level VSC
- Compact Design
- Urban Applications
- Line Commutated Converter (LCC)
- Classic HVDC Systems
- Thyristor-based Converters
- High Power Transmission
- Back-to-Back LCC
- Grid Interconnection
- Voltage Source Converter (VSC)
- Y to o to Y Growth Trend Analysis By Technology Type, 2021 to 2025
- Absolute $ Opportunity Analysis By Technology Type, 2026 to 2036
- Global Market Analysis 2021 to 2025 and Forecast 2026 to 2036, By Configuration Type
- Introduction / Key Findings
- Historical Market Size Value (USD Million) Analysis By Configuration Type, 2021 to 2025
- Current and Future Market Size Value (USD Million) Analysis and Forecast By Configuration Type, 2026 to 2036
- Bipolar Configuration
- Symmetrical Bipole
- Balanced Operation
- High Reliability
- Asymmetrical Bipole
- Flexible Operation
- Fault Tolerance
- Monopolar Configuration
- Single Pole Systems
- Ground Return
- Low Cost
- Metallic Return Systems
- Improved Reliability
- Back-to-Back Configuration
- Direct Grid Coupling
- No Transmission Line
- Short Distance
- Frequency Conversion
- Grid Synchronization
- Bipolar Configuration
- Y to o to Y Growth Trend Analysis By Configuration Type, 2021 to 2025
- Absolute $ Opportunity Analysis By Configuration Type, 2026 to 2036
- Global Market Analysis 2021 to 2025 and Forecast 2026 to 2036, By Component
- Introduction / Key Findings
- Historical Market Size Value (USD Million) Analysis By Component, 2021 to 2025
- Current and Future Market Size Value (USD Million) Analysis and Forecast By Component, 2026 to 2036
- Converter Valves
- Thyristor Valves
- LCC Systems
- High Voltage
- IGBT Valves
- VSC Systems
- Fast Switching
- Transformers
- Converter Transformers
- Voltage Conversion
- Grid Integration
- Smoothing Reactors
- Ripple Reduction
- Filters
- AC Filters
- Harmonic Filtering
- Voltage Stability
- DC Filters
- Ripple Filtering
- Control and Protection Systems
- Control Systems
- SCADA Integration
- Automation
- Protection Systems
- Fault Detection
- Converter Valves
- Y to o to Y Growth Trend Analysis By Component, 2021 to 2025
- Absolute $ Opportunity Analysis By Component, 2026 to 2036
- Global Market Analysis 2021 to 2025 and Forecast 2026 to 2036, By Application
- Introduction / Key Findings
- Historical Market Size Value (USD Million) Analysis By Application, 2021 to 2025
- Current and Future Market Size Value (USD Million) Analysis and Forecast By Application, 2026 to 2036
- Long-distance Power Transmission
- Bulk Power Transfer
- Interregional Transmission
- Cross-border Links
- Ultra High Voltage Transmission
- UHVDC Projects
- High Capacity Lines
- Renewable Energy Integration
- Offshore Wind Integration
- Grid Connection
- Power Stabilization
- Solar Power Integration
- Desert Solar Projects
- Grid Interconnection
- Asynchronous Grid Links
- Frequency Conversion
- Stability Enhancement
- Back-to-Back Stations
- Urban Grids
- Urban Power Supply
- Metro Cities
- Underground Cables
- Compact Stations
- Industrial Clusters
- Reliable Power Supply
- Long-distance Power Transmission
- Y to o to Y Growth Trend Analysis By Application, 2021 to 2025
- Absolute $ Opportunity Analysis By Application, 2026 to 2036
- Global Market Analysis 2021 to 2025 and Forecast 2026 to 2036, By Voltage Level
- Introduction / Key Findings
- Historical Market Size Value (USD Million) Analysis By Voltage Level, 2021 to 2025
- Current and Future Market Size Value (USD Million) Analysis and Forecast By Voltage Level, 2026 to 2036
- High Voltage HVDC
- 300–600 kV
- Long Distance Transmission
- Bulk Power
- 600–800 kV
- UHVDC Systems
- Cross-country Links
- Medium Voltage HVDC
- Below 150 kV
- Industrial Applications
- Urban Grids
- 150–300 kV
- Regional Transmission
- Ultra High Voltage (UHVDC)
- Above 800 kV
- Mega Projects
- Intercontinental Transmission
- Advanced UHV Systems
- High Capacity Lines
- High Voltage HVDC
- Y to o to Y Growth Trend Analysis By Voltage Level, 2021 to 2025
- Absolute $ Opportunity Analysis By Voltage Level, 2026 to 2036
- Global Market Analysis 2021 to 2025 and Forecast 2026 to 2036, By Region
- Introduction
- Historical Market Size Value (USD Million) Analysis By Region, 2021 to 2025
- Current Market Size Value (USD Million) Analysis and Forecast By Region, 2026 to 2036
- North America
- Latin America
- Western Europe
- Eastern Europe
- East Asia
- South Asia and Pacific
- Middle East & Africa
- Market Attractiveness Analysis By Region
- North America Market Analysis 2021 to 2025 and Forecast 2026 to 2036, By Country
- Historical Market Size Value (USD Million) Trend Analysis By Market Taxonomy, 2021 to 2025
- Market Size Value (USD Million) Forecast By Market Taxonomy, 2026 to 2036
- By Country
- USA
- Canada
- Mexico
- By Technology Type
- By Configuration Type
- By Component
- By Application
- By Voltage Level
- By Country
- Market Attractiveness Analysis
- By Country
- By Technology Type
- By Configuration Type
- By Component
- By Application
- By Voltage Level
- Key Takeaways
- Latin America Market Analysis 2021 to 2025 and Forecast 2026 to 2036, By Country
- Historical Market Size Value (USD Million) Trend Analysis By Market Taxonomy, 2021 to 2025
- Market Size Value (USD Million) Forecast By Market Taxonomy, 2026 to 2036
- By Country
- Brazil
- Chile
- Rest of Latin America
- By Technology Type
- By Configuration Type
- By Component
- By Application
- By Voltage Level
- By Country
- Market Attractiveness Analysis
- By Country
- By Technology Type
- By Configuration Type
- By Component
- By Application
- By Voltage Level
- Key Takeaways
- Western Europe Market Analysis 2021 to 2025 and Forecast 2026 to 2036, By Country
- Historical Market Size Value (USD Million) Trend Analysis By Market Taxonomy, 2021 to 2025
- Market Size Value (USD Million) Forecast By Market Taxonomy, 2026 to 2036
- By Country
- Germany
- UK
- Italy
- Spain
- France
- Nordic
- BENELUX
- Rest of Western Europe
- By Technology Type
- By Configuration Type
- By Component
- By Application
- By Voltage Level
- By Country
- Market Attractiveness Analysis
- By Country
- By Technology Type
- By Configuration Type
- By Component
- By Application
- By Voltage Level
- Key Takeaways
- Eastern Europe Market Analysis 2021 to 2025 and Forecast 2026 to 2036, By Country
- Historical Market Size Value (USD Million) Trend Analysis By Market Taxonomy, 2021 to 2025
- Market Size Value (USD Million) Forecast By Market Taxonomy, 2026 to 2036
- By Country
- Russia
- Poland
- Hungary
- Balkan & Baltic
- Rest of Eastern Europe
- By Technology Type
- By Configuration Type
- By Component
- By Application
- By Voltage Level
- By Country
- Market Attractiveness Analysis
- By Country
- By Technology Type
- By Configuration Type
- By Component
- By Application
- By Voltage Level
- Key Takeaways
- East Asia Market Analysis 2021 to 2025 and Forecast 2026 to 2036, By Country
- Historical Market Size Value (USD Million) Trend Analysis By Market Taxonomy, 2021 to 2025
- Market Size Value (USD Million) Forecast By Market Taxonomy, 2026 to 2036
- By Country
- China
- Japan
- South Korea
- By Technology Type
- By Configuration Type
- By Component
- By Application
- By Voltage Level
- By Country
- Market Attractiveness Analysis
- By Country
- By Technology Type
- By Configuration Type
- By Component
- By Application
- By Voltage Level
- Key Takeaways
- South Asia and Pacific Market Analysis 2021 to 2025 and Forecast 2026 to 2036, By Country
- Historical Market Size Value (USD Million) Trend Analysis By Market Taxonomy, 2021 to 2025
- Market Size Value (USD Million) Forecast By Market Taxonomy, 2026 to 2036
- By Country
- India
- ASEAN
- Australia & New Zealand
- Rest of South Asia and Pacific
- By Technology Type
- By Configuration Type
- By Component
- By Application
- By Voltage Level
- By Country
- Market Attractiveness Analysis
- By Country
- By Technology Type
- By Configuration Type
- By Component
- By Application
- By Voltage Level
- Key Takeaways
- Middle East & Africa Market Analysis 2021 to 2025 and Forecast 2026 to 2036, By Country
- Historical Market Size Value (USD Million) Trend Analysis By Market Taxonomy, 2021 to 2025
- Market Size Value (USD Million) Forecast By Market Taxonomy, 2026 to 2036
- By Country
- Kingdom of Saudi Arabia
- Other GCC Countries
- Turkiye
- South Africa
- Other African Union
- Rest of Middle East & Africa
- By Technology Type
- By Configuration Type
- By Component
- By Application
- By Voltage Level
- By Country
- Market Attractiveness Analysis
- By Country
- By Technology Type
- By Configuration Type
- By Component
- By Application
- By Voltage Level
- Key Takeaways
- Key Countries Market Analysis
- USA
- Pricing Analysis
- Market Share Analysis, 2025
- By Technology Type
- By Configuration Type
- By Component
- By Application
- By Voltage Level
- Canada
- Pricing Analysis
- Market Share Analysis, 2025
- By Technology Type
- By Configuration Type
- By Component
- By Application
- By Voltage Level
- Mexico
- Pricing Analysis
- Market Share Analysis, 2025
- By Technology Type
- By Configuration Type
- By Component
- By Application
- By Voltage Level
- Brazil
- Pricing Analysis
- Market Share Analysis, 2025
- By Technology Type
- By Configuration Type
- By Component
- By Application
- By Voltage Level
- Chile
- Pricing Analysis
- Market Share Analysis, 2025
- By Technology Type
- By Configuration Type
- By Component
- By Application
- By Voltage Level
- Germany
- Pricing Analysis
- Market Share Analysis, 2025
- By Technology Type
- By Configuration Type
- By Component
- By Application
- By Voltage Level
- UK
- Pricing Analysis
- Market Share Analysis, 2025
- By Technology Type
- By Configuration Type
- By Component
- By Application
- By Voltage Level
- Italy
- Pricing Analysis
- Market Share Analysis, 2025
- By Technology Type
- By Configuration Type
- By Component
- By Application
- By Voltage Level
- Spain
- Pricing Analysis
- Market Share Analysis, 2025
- By Technology Type
- By Configuration Type
- By Component
- By Application
- By Voltage Level
- France
- Pricing Analysis
- Market Share Analysis, 2025
- By Technology Type
- By Configuration Type
- By Component
- By Application
- By Voltage Level
- India
- Pricing Analysis
- Market Share Analysis, 2025
- By Technology Type
- By Configuration Type
- By Component
- By Application
- By Voltage Level
- ASEAN
- Pricing Analysis
- Market Share Analysis, 2025
- By Technology Type
- By Configuration Type
- By Component
- By Application
- By Voltage Level
- Australia & New Zealand
- Pricing Analysis
- Market Share Analysis, 2025
- By Technology Type
- By Configuration Type
- By Component
- By Application
- By Voltage Level
- China
- Pricing Analysis
- Market Share Analysis, 2025
- By Technology Type
- By Configuration Type
- By Component
- By Application
- By Voltage Level
- Japan
- Pricing Analysis
- Market Share Analysis, 2025
- By Technology Type
- By Configuration Type
- By Component
- By Application
- By Voltage Level
- South Korea
- Pricing Analysis
- Market Share Analysis, 2025
- By Technology Type
- By Configuration Type
- By Component
- By Application
- By Voltage Level
- Russia
- Pricing Analysis
- Market Share Analysis, 2025
- By Technology Type
- By Configuration Type
- By Component
- By Application
- By Voltage Level
- Poland
- Pricing Analysis
- Market Share Analysis, 2025
- By Technology Type
- By Configuration Type
- By Component
- By Application
- By Voltage Level
- Hungary
- Pricing Analysis
- Market Share Analysis, 2025
- By Technology Type
- By Configuration Type
- By Component
- By Application
- By Voltage Level
- Kingdom of Saudi Arabia
- Pricing Analysis
- Market Share Analysis, 2025
- By Technology Type
- By Configuration Type
- By Component
- By Application
- By Voltage Level
- Turkiye
- Pricing Analysis
- Market Share Analysis, 2025
- By Technology Type
- By Configuration Type
- By Component
- By Application
- By Voltage Level
- South Africa
- Pricing Analysis
- Market Share Analysis, 2025
- By Technology Type
- By Configuration Type
- By Component
- By Application
- By Voltage Level
- USA
- Market Structure Analysis
- Competition Dashboard
- Competition Benchmarking
- Market Share Analysis of Top Players
- By Regional
- By Technology Type
- By Configuration Type
- By Component
- By Application
- By Voltage Level
- Competition Analysis
- Competition Deep Dive
- Hitachi Energy Ltd.
- Overview
- Product Portfolio
- Profitability by Market Segments (Product/Age /Sales Channel/Region)
- Sales Footprint
- Strategy Overview
- Marketing Strategy
- Product Strategy
- Channel Strategy
- Bharat Heavy Electricals Limited
- GE Grid Solutions LLC
- Mitsubishi Electric Corporation
- Siemens Energy AG
- ABB
- Hyosung
- LSIS
- NR Electric Co., Ltd
- Toshiba Corporation
- C-Epri Power Engineering Company
- Crompton Greaves Ltd
- XJ Electric
- Bhart Heavy Electricals Limited (BHEL)
- Hitachi Energy Ltd.
- Competition Deep Dive
- Assumptions & Acronyms Used
List Of Table
- Table 1: Global Market Value (USD Million) Forecast by Region, 2021 to 2036
- Table 2: Global Market Value (USD Million) Forecast by Technology Type, 2021 to 2036
- Table 3: Global Market Value (USD Million) Forecast by Configuration Type, 2021 to 2036
- Table 4: Global Market Value (USD Million) Forecast by Component, 2021 to 2036
- Table 5: Global Market Value (USD Million) Forecast by Application, 2021 to 2036
- Table 6: Global Market Value (USD Million) Forecast by Voltage Level, 2021 to 2036
- Table 7: North America Market Value (USD Million) Forecast by Country, 2021 to 2036
- Table 8: North America Market Value (USD Million) Forecast by Technology Type, 2021 to 2036
- Table 9: North America Market Value (USD Million) Forecast by Configuration Type, 2021 to 2036
- Table 10: North America Market Value (USD Million) Forecast by Component, 2021 to 2036
- Table 11: North America Market Value (USD Million) Forecast by Application, 2021 to 2036
- Table 12: North America Market Value (USD Million) Forecast by Voltage Level, 2021 to 2036
- Table 13: Latin America Market Value (USD Million) Forecast by Country, 2021 to 2036
- Table 14: Latin America Market Value (USD Million) Forecast by Technology Type, 2021 to 2036
- Table 15: Latin America Market Value (USD Million) Forecast by Configuration Type, 2021 to 2036
- Table 16: Latin America Market Value (USD Million) Forecast by Component, 2021 to 2036
- Table 17: Latin America Market Value (USD Million) Forecast by Application, 2021 to 2036
- Table 18: Latin America Market Value (USD Million) Forecast by Voltage Level, 2021 to 2036
- Table 19: Western Europe Market Value (USD Million) Forecast by Country, 2021 to 2036
- Table 20: Western Europe Market Value (USD Million) Forecast by Technology Type, 2021 to 2036
- Table 21: Western Europe Market Value (USD Million) Forecast by Configuration Type, 2021 to 2036
- Table 22: Western Europe Market Value (USD Million) Forecast by Component, 2021 to 2036
- Table 23: Western Europe Market Value (USD Million) Forecast by Application, 2021 to 2036
- Table 24: Western Europe Market Value (USD Million) Forecast by Voltage Level, 2021 to 2036
- Table 25: Eastern Europe Market Value (USD Million) Forecast by Country, 2021 to 2036
- Table 26: Eastern Europe Market Value (USD Million) Forecast by Technology Type, 2021 to 2036
- Table 27: Eastern Europe Market Value (USD Million) Forecast by Configuration Type, 2021 to 2036
- Table 28: Eastern Europe Market Value (USD Million) Forecast by Component, 2021 to 2036
- Table 29: Eastern Europe Market Value (USD Million) Forecast by Application, 2021 to 2036
- Table 30: Eastern Europe Market Value (USD Million) Forecast by Voltage Level, 2021 to 2036
- Table 31: East Asia Market Value (USD Million) Forecast by Country, 2021 to 2036
- Table 32: East Asia Market Value (USD Million) Forecast by Technology Type, 2021 to 2036
- Table 33: East Asia Market Value (USD Million) Forecast by Configuration Type, 2021 to 2036
- Table 34: East Asia Market Value (USD Million) Forecast by Component, 2021 to 2036
- Table 35: East Asia Market Value (USD Million) Forecast by Application, 2021 to 2036
- Table 36: East Asia Market Value (USD Million) Forecast by Voltage Level, 2021 to 2036
- Table 37: South Asia and Pacific Market Value (USD Million) Forecast by Country, 2021 to 2036
- Table 38: South Asia and Pacific Market Value (USD Million) Forecast by Technology Type, 2021 to 2036
- Table 39: South Asia and Pacific Market Value (USD Million) Forecast by Configuration Type, 2021 to 2036
- Table 40: South Asia and Pacific Market Value (USD Million) Forecast by Component, 2021 to 2036
- Table 41: South Asia and Pacific Market Value (USD Million) Forecast by Application, 2021 to 2036
- Table 42: South Asia and Pacific Market Value (USD Million) Forecast by Voltage Level, 2021 to 2036
- Table 43: Middle East & Africa Market Value (USD Million) Forecast by Country, 2021 to 2036
- Table 44: Middle East & Africa Market Value (USD Million) Forecast by Technology Type, 2021 to 2036
- Table 45: Middle East & Africa Market Value (USD Million) Forecast by Configuration Type, 2021 to 2036
- Table 46: Middle East & Africa Market Value (USD Million) Forecast by Component, 2021 to 2036
- Table 47: Middle East & Africa Market Value (USD Million) Forecast by Application, 2021 to 2036
- Table 48: Middle East & Africa Market Value (USD Million) Forecast by Voltage Level, 2021 to 2036
List Of Figures
- Figure 1: Global Market Pricing Analysis
- Figure 2: Global Market Value (USD Million) Forecast 2021 to 2036
- Figure 3: Global Market Value Share and BPS Analysis by Technology Type, 2026 and 2036
- Figure 4: Global Market Y-o-Y Growth Comparison by Technology Type, 2026 to 2036
- Figure 5: Global Market Attractiveness Analysis by Technology Type
- Figure 6: Global Market Value Share and BPS Analysis by Configuration Type, 2026 and 2036
- Figure 7: Global Market Y-o-Y Growth Comparison by Configuration Type, 2026 to 2036
- Figure 8: Global Market Attractiveness Analysis by Configuration Type
- Figure 9: Global Market Value Share and BPS Analysis by Component, 2026 and 2036
- Figure 10: Global Market Y-o-Y Growth Comparison by Component, 2026 to 2036
- Figure 11: Global Market Attractiveness Analysis by Component
- Figure 12: Global Market Value Share and BPS Analysis by Application, 2026 and 2036
- Figure 13: Global Market Y-o-Y Growth Comparison by Application, 2026 to 2036
- Figure 14: Global Market Attractiveness Analysis by Application
- Figure 15: Global Market Value Share and BPS Analysis by Voltage Level, 2026 and 2036
- Figure 16: Global Market Y-o-Y Growth Comparison by Voltage Level, 2026 to 2036
- Figure 17: Global Market Attractiveness Analysis by Voltage Level
- Figure 18: Global Market Value (USD Million) Share and BPS Analysis by Region, 2026 and 2036
- Figure 19: Global Market Y-o-Y Growth Comparison by Region, 2026 to 2036
- Figure 20: Global Market Attractiveness Analysis by Region
- Figure 21: North America Market Incremental Dollar Opportunity, 2026 to 2036
- Figure 22: Latin America Market Incremental Dollar Opportunity, 2026 to 2036
- Figure 23: Western Europe Market Incremental Dollar Opportunity, 2026 to 2036
- Figure 24: Eastern Europe Market Incremental Dollar Opportunity, 2026 to 2036
- Figure 25: East Asia Market Incremental Dollar Opportunity, 2026 to 2036
- Figure 26: South Asia and Pacific Market Incremental Dollar Opportunity, 2026 to 2036
- Figure 27: Middle East & Africa Market Incremental Dollar Opportunity, 2026 to 2036
- Figure 28: North America Market Value Share and BPS Analysis by Country, 2026 and 2036
- Figure 29: North America Market Value Share and BPS Analysis by Technology Type, 2026 and 2036
- Figure 30: North America Market Y-o-Y Growth Comparison by Technology Type, 2026 to 2036
- Figure 31: North America Market Attractiveness Analysis by Technology Type
- Figure 32: North America Market Value Share and BPS Analysis by Configuration Type, 2026 and 2036
- Figure 33: North America Market Y-o-Y Growth Comparison by Configuration Type, 2026 to 2036
- Figure 34: North America Market Attractiveness Analysis by Configuration Type
- Figure 35: North America Market Value Share and BPS Analysis by Component, 2026 and 2036
- Figure 36: North America Market Y-o-Y Growth Comparison by Component, 2026 to 2036
- Figure 37: North America Market Attractiveness Analysis by Component
- Figure 38: North America Market Value Share and BPS Analysis by Application, 2026 and 2036
- Figure 39: North America Market Y-o-Y Growth Comparison by Application, 2026 to 2036
- Figure 40: North America Market Attractiveness Analysis by Application
- Figure 41: North America Market Value Share and BPS Analysis by Voltage Level, 2026 and 2036
- Figure 42: North America Market Y-o-Y Growth Comparison by Voltage Level, 2026 to 2036
- Figure 43: North America Market Attractiveness Analysis by Voltage Level
- Figure 44: Latin America Market Value Share and BPS Analysis by Country, 2026 and 2036
- Figure 45: Latin America Market Value Share and BPS Analysis by Technology Type, 2026 and 2036
- Figure 46: Latin America Market Y-o-Y Growth Comparison by Technology Type, 2026 to 2036
- Figure 47: Latin America Market Attractiveness Analysis by Technology Type
- Figure 48: Latin America Market Value Share and BPS Analysis by Configuration Type, 2026 and 2036
- Figure 49: Latin America Market Y-o-Y Growth Comparison by Configuration Type, 2026 to 2036
- Figure 50: Latin America Market Attractiveness Analysis by Configuration Type
- Figure 51: Latin America Market Value Share and BPS Analysis by Component, 2026 and 2036
- Figure 52: Latin America Market Y-o-Y Growth Comparison by Component, 2026 to 2036
- Figure 53: Latin America Market Attractiveness Analysis by Component
- Figure 54: Latin America Market Value Share and BPS Analysis by Application, 2026 and 2036
- Figure 55: Latin America Market Y-o-Y Growth Comparison by Application, 2026 to 2036
- Figure 56: Latin America Market Attractiveness Analysis by Application
- Figure 57: Latin America Market Value Share and BPS Analysis by Voltage Level, 2026 and 2036
- Figure 58: Latin America Market Y-o-Y Growth Comparison by Voltage Level, 2026 to 2036
- Figure 59: Latin America Market Attractiveness Analysis by Voltage Level
- Figure 60: Western Europe Market Value Share and BPS Analysis by Country, 2026 and 2036
- Figure 61: Western Europe Market Value Share and BPS Analysis by Technology Type, 2026 and 2036
- Figure 62: Western Europe Market Y-o-Y Growth Comparison by Technology Type, 2026 to 2036
- Figure 63: Western Europe Market Attractiveness Analysis by Technology Type
- Figure 64: Western Europe Market Value Share and BPS Analysis by Configuration Type, 2026 and 2036
- Figure 65: Western Europe Market Y-o-Y Growth Comparison by Configuration Type, 2026 to 2036
- Figure 66: Western Europe Market Attractiveness Analysis by Configuration Type
- Figure 67: Western Europe Market Value Share and BPS Analysis by Component, 2026 and 2036
- Figure 68: Western Europe Market Y-o-Y Growth Comparison by Component, 2026 to 2036
- Figure 69: Western Europe Market Attractiveness Analysis by Component
- Figure 70: Western Europe Market Value Share and BPS Analysis by Application, 2026 and 2036
- Figure 71: Western Europe Market Y-o-Y Growth Comparison by Application, 2026 to 2036
- Figure 72: Western Europe Market Attractiveness Analysis by Application
- Figure 73: Western Europe Market Value Share and BPS Analysis by Voltage Level, 2026 and 2036
- Figure 74: Western Europe Market Y-o-Y Growth Comparison by Voltage Level, 2026 to 2036
- Figure 75: Western Europe Market Attractiveness Analysis by Voltage Level
- Figure 76: Eastern Europe Market Value Share and BPS Analysis by Country, 2026 and 2036
- Figure 77: Eastern Europe Market Value Share and BPS Analysis by Technology Type, 2026 and 2036
- Figure 78: Eastern Europe Market Y-o-Y Growth Comparison by Technology Type, 2026 to 2036
- Figure 79: Eastern Europe Market Attractiveness Analysis by Technology Type
- Figure 80: Eastern Europe Market Value Share and BPS Analysis by Configuration Type, 2026 and 2036
- Figure 81: Eastern Europe Market Y-o-Y Growth Comparison by Configuration Type, 2026 to 2036
- Figure 82: Eastern Europe Market Attractiveness Analysis by Configuration Type
- Figure 83: Eastern Europe Market Value Share and BPS Analysis by Component, 2026 and 2036
- Figure 84: Eastern Europe Market Y-o-Y Growth Comparison by Component, 2026 to 2036
- Figure 85: Eastern Europe Market Attractiveness Analysis by Component
- Figure 86: Eastern Europe Market Value Share and BPS Analysis by Application, 2026 and 2036
- Figure 87: Eastern Europe Market Y-o-Y Growth Comparison by Application, 2026 to 2036
- Figure 88: Eastern Europe Market Attractiveness Analysis by Application
- Figure 89: Eastern Europe Market Value Share and BPS Analysis by Voltage Level, 2026 and 2036
- Figure 90: Eastern Europe Market Y-o-Y Growth Comparison by Voltage Level, 2026 to 2036
- Figure 91: Eastern Europe Market Attractiveness Analysis by Voltage Level
- Figure 92: East Asia Market Value Share and BPS Analysis by Country, 2026 and 2036
- Figure 93: East Asia Market Value Share and BPS Analysis by Technology Type, 2026 and 2036
- Figure 94: East Asia Market Y-o-Y Growth Comparison by Technology Type, 2026 to 2036
- Figure 95: East Asia Market Attractiveness Analysis by Technology Type
- Figure 96: East Asia Market Value Share and BPS Analysis by Configuration Type, 2026 and 2036
- Figure 97: East Asia Market Y-o-Y Growth Comparison by Configuration Type, 2026 to 2036
- Figure 98: East Asia Market Attractiveness Analysis by Configuration Type
- Figure 99: East Asia Market Value Share and BPS Analysis by Component, 2026 and 2036
- Figure 100: East Asia Market Y-o-Y Growth Comparison by Component, 2026 to 2036
- Figure 101: East Asia Market Attractiveness Analysis by Component
- Figure 102: East Asia Market Value Share and BPS Analysis by Application, 2026 and 2036
- Figure 103: East Asia Market Y-o-Y Growth Comparison by Application, 2026 to 2036
- Figure 104: East Asia Market Attractiveness Analysis by Application
- Figure 105: East Asia Market Value Share and BPS Analysis by Voltage Level, 2026 and 2036
- Figure 106: East Asia Market Y-o-Y Growth Comparison by Voltage Level, 2026 to 2036
- Figure 107: East Asia Market Attractiveness Analysis by Voltage Level
- Figure 108: South Asia and Pacific Market Value Share and BPS Analysis by Country, 2026 and 2036
- Figure 109: South Asia and Pacific Market Value Share and BPS Analysis by Technology Type, 2026 and 2036
- Figure 110: South Asia and Pacific Market Y-o-Y Growth Comparison by Technology Type, 2026 to 2036
- Figure 111: South Asia and Pacific Market Attractiveness Analysis by Technology Type
- Figure 112: South Asia and Pacific Market Value Share and BPS Analysis by Configuration Type, 2026 and 2036
- Figure 113: South Asia and Pacific Market Y-o-Y Growth Comparison by Configuration Type, 2026 to 2036
- Figure 114: South Asia and Pacific Market Attractiveness Analysis by Configuration Type
- Figure 115: South Asia and Pacific Market Value Share and BPS Analysis by Component, 2026 and 2036
- Figure 116: South Asia and Pacific Market Y-o-Y Growth Comparison by Component, 2026 to 2036
- Figure 117: South Asia and Pacific Market Attractiveness Analysis by Component
- Figure 118: South Asia and Pacific Market Value Share and BPS Analysis by Application, 2026 and 2036
- Figure 119: South Asia and Pacific Market Y-o-Y Growth Comparison by Application, 2026 to 2036
- Figure 120: South Asia and Pacific Market Attractiveness Analysis by Application
- Figure 121: South Asia and Pacific Market Value Share and BPS Analysis by Voltage Level, 2026 and 2036
- Figure 122: South Asia and Pacific Market Y-o-Y Growth Comparison by Voltage Level, 2026 to 2036
- Figure 123: South Asia and Pacific Market Attractiveness Analysis by Voltage Level
- Figure 124: Middle East & Africa Market Value Share and BPS Analysis by Country, 2026 and 2036
- Figure 125: Middle East & Africa Market Value Share and BPS Analysis by Technology Type, 2026 and 2036
- Figure 126: Middle East & Africa Market Y-o-Y Growth Comparison by Technology Type, 2026 to 2036
- Figure 127: Middle East & Africa Market Attractiveness Analysis by Technology Type
- Figure 128: Middle East & Africa Market Value Share and BPS Analysis by Configuration Type, 2026 and 2036
- Figure 129: Middle East & Africa Market Y-o-Y Growth Comparison by Configuration Type, 2026 to 2036
- Figure 130: Middle East & Africa Market Attractiveness Analysis by Configuration Type
- Figure 131: Middle East & Africa Market Value Share and BPS Analysis by Component, 2026 and 2036
- Figure 132: Middle East & Africa Market Y-o-Y Growth Comparison by Component, 2026 to 2036
- Figure 133: Middle East & Africa Market Attractiveness Analysis by Component
- Figure 134: Middle East & Africa Market Value Share and BPS Analysis by Application, 2026 and 2036
- Figure 135: Middle East & Africa Market Y-o-Y Growth Comparison by Application, 2026 to 2036
- Figure 136: Middle East & Africa Market Attractiveness Analysis by Application
- Figure 137: Middle East & Africa Market Value Share and BPS Analysis by Voltage Level, 2026 and 2036
- Figure 138: Middle East & Africa Market Y-o-Y Growth Comparison by Voltage Level, 2026 to 2036
- Figure 139: Middle East & Africa Market Attractiveness Analysis by Voltage Level
- Figure 140: Global Market - Tier Structure Analysis
- Figure 141: Global Market - Company Share Analysis