Insulin Pumps Market Size, Share, Growth and Forecast (2026 - 2036)
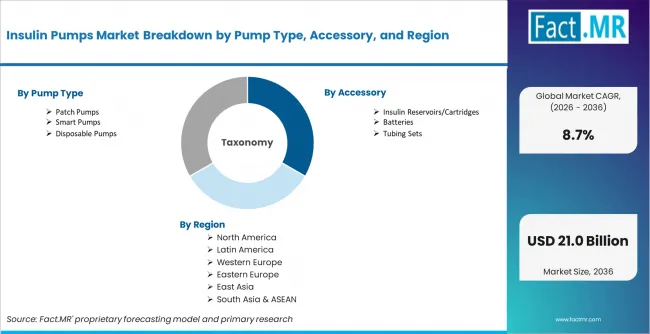
The Insulin Pumps Market is segmented by Pump Type (Tethered Pumps, Patch Pumps, Smart Pumps, Disposable Pumps, and Hybrid Closed-Loop Pumps), Accessory (Infusion Set Insertion Devices, Insulin Reservoirs/Cartridges, Batteries, Tubing Sets, and Adhesive Patches), Patient Type (Type 1 Diabetes, Insulin-Dependent Type 2 Diabetes, Pediatric Patients, Adults, and Geriatric Patients), End User (Homecare Settings, Hospitals and Clinics, Long-Term Care Facilities, Diabetes Care Centers, and Other Care Settings), Sales Channel (Direct Institutional Sales, Retail Pharmacy, Online Pharmacy, Specialty Diabetes Supply, and Distributor Sales), and Region. Forecast for 2026 to 2036.
Fact.MR analysis indicates that the insulin pumps market is moving through a connected diabetes management phase. Patients, endocrinologists, and diabetes care centers are evaluating pumps through dosing precision, comfort, continuous glucose monitor compatibility, and daily-use convenience. Demand is gaining depth where patients want fewer injections and better support for basal and bolus insulin control.
Insulin Pumps Market Forecast and Outlook By Fact.MR
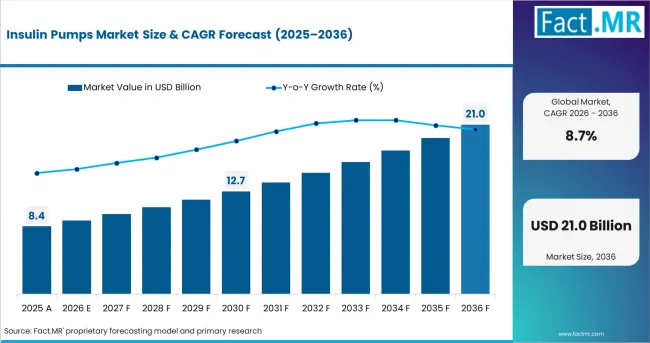
- The insulin pumps market was valued at USD 7.7 billion in 2025.
- According to Fact.MR, demand is projected to reach USD 8.4 billion in 2026 and expand to USD 19.4 billion by 2036, reflecting a CAGR of 8.7% during the forecast period.
| Metric | Value |
|---|---|
| Estimated Value in 2026 | USD 8.4 billion |
| Forecast Value in 2036 | USD 19.4 billion |
| Forecast CAGR (2026 to 2036) | 8.7% |
Summary of Insulin Pumps Market
- Market Definition
- The market includes insulin infusion pumps and accessories used for continuous insulin delivery in Type 1 and insulin-dependent Type 2 diabetes care.
- Demand Drivers
- Patients are shifting toward pump therapy because continuous insulin infusion can reduce repeated daily injections.
- Diabetes care centers are using CGM-linked pumps where automated dosing support improves daily glucose management [4].
- Homecare use is rising as patients prefer discreet, wearable, and programmable insulin delivery systems.
- Key Segments Analyzed
- By Pump Type: Patch pumps are expected to hold approximately 43.0% share in 2026, supported by tubeless use and lifestyle convenience.
- By Accessory: Insulin reservoirs/cartridges lead in 2026 with about 34.0% share, due to recurring replacement demand.
- By Patient Type: Type 1 diabetes accounts for around 61.0% share in 2026, driven by lifelong insulin dependence and pump therapy use.
- By End User: Homecare settings hold nearly 58.0% share in 2026, since most pump therapy is managed in daily life outside hospitals.
- By Sales Channel: Specialty diabetes supply is projected to lead with 38.0% share in 2026, as pumps and accessories need coordinated fulfillment.
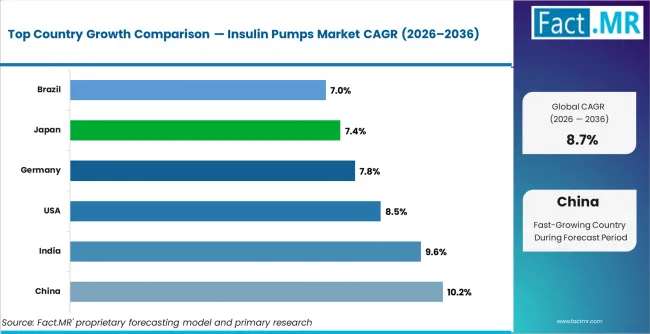
- By Geography: China leads growth through 2036 at 10.2% CAGR, supported by diabetes care expansion and wider device awareness.
- Analyst Opinion at Fact.MR
- Shambhu Nath Jha, Senior Analyst at Fact.MR, opines, “Insulin pump demand is no longer defined only by replacement of injections. The stronger shift is toward connected dosing, patient comfort, and systems that reduce daily diabetes management burden. Suppliers that can support CGM integration, training, and reliable accessory supply will hold a better position than companies competing only on device availability.”
- Strategic Implications
- Manufacturers should strengthen CGM and automated dosing integration because users value systems that reduce manual decision burden.
- Diabetes care providers need structured training support to reduce device misuse and improve patient confidence.
- Specialty suppliers should improve recurring accessory fulfillment because pump therapy depends on uninterrupted consumable access.
- Methodology
- Market sizing uses insulin-dependent diabetes population, pump adoption rates, replacement cycles, accessory demand, and regional reimbursement access.
- Analysis includes CDC diabetes data, ADA standards of care, FDA insulin pump resources, company product information, and specialty pharmacy inputs.
- Forecasts account for patch pump adoption, automated insulin delivery, homecare use, pediatric diabetes care, and digital diabetes management.
The market is expected to generate an absolute opportunity of USD 11.0 billion between 2026 and 2036, supported by growing diabetes care needs. Growth is being driven by rising diabetes prevalence, increasing adoption of continuous insulin infusion, expansion of patch pump formats, and integration with continuous glucose monitoring (CGM) systems. Guidance from the Centers for Disease Control and Prevention highlights the need for long-term diabetes management and monitoring, while U.S. Food and Drug Administration emphasizes insulin pump safety, device reliability, and patient training. These factors reinforce the importance of user-friendly, accurate, and well-supported insulin delivery systems. [1]
China leads with a projected CAGR of 10.2% through 2036, supported by urban diabetes care expansion and digital health adoption. India follows at 9.6%, helped by growing diabetes diagnosis and private endocrinology care. The United States records 8.5%, with demand anchored in reimbursement, device innovation, and CGM integration. Germany grows at 7.8%, supported by structured diabetes care and pump therapy access. Japan advances at 7.4%, backed by aging-related diabetes care and precision dosing needs. Brazil posts 7.0%, supported by private healthcare growth and improving diabetes device access.
Segmental Analysis
Insulin Pumps Market Analysis by Pump Type
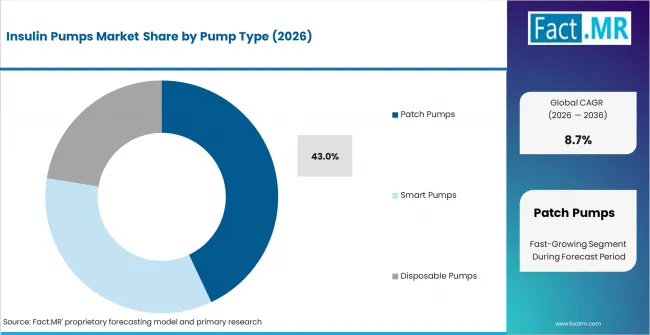
Patch pumps are expected to hold 43.0% share in 2026 as patients prefer tubeless systems that are discreet and easier to wear during daily activity. These pumps reduce tubing-related inconvenience and support simpler movement for children, working adults, and active users. Fact.MR identifies insulin pumps as advanced systems with basal rate, bolus infusion, and CGM compatibility features, which aligns with growing demand for flexible diabetes control. Tethered pumps retain a strong base because they offer established performance and broad clinical familiarity. Hybrid closed-loop systems are gaining share where CGM integration and automated dosing matter. Poor device comfort can affect adherence and limit long-term pump use.
- Tubeless Use: Patch pumps reduce tubing discomfort and support easier wear under clothing.
- Daily Convenience: Patients value systems that fit work, school, exercise, and travel routines.
- Connected Care: Smart and hybrid systems gain interest where CGM-linked dosing improves glucose control.
Insulin Pumps Market Analysis by Accessory
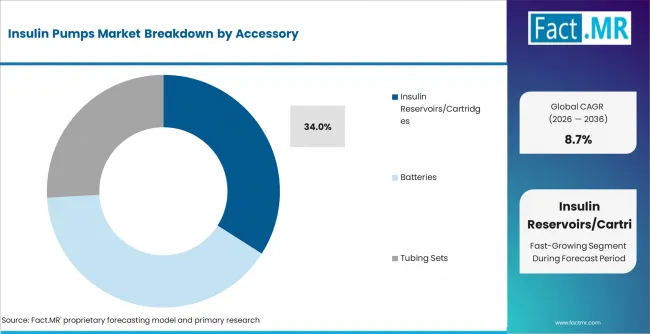
Insulin reservoirs and cartridges lead because pump users need regular replacement to maintain safe insulin delivery. Reservoirs/cartridges are projected to account for 34.0% share over the assessment period. These accessories support insulin storage within the pump and must be replaced based on device type, insulin use, and therapy routine. FDA insulin pump safety information highlights the importance of correct pump use and awareness of device problems. Infusion sets and adhesive patches also create recurring demand, especially among active users and pediatric patients. Reservoirs lead because every pump cycle requires dependable insulin containment. Supply disruption can interrupt therapy and increase risk for users.
- Recurring Demand: Reservoirs and cartridges require regular replacement throughout pump therapy.
- Therapy Continuity: Reliable accessory supply helps patients avoid missed insulin delivery.
- Device Fit: Accessories must match pump design, insulin volume, and user routine.
Insulin Pumps Market Analysis by Patient Type
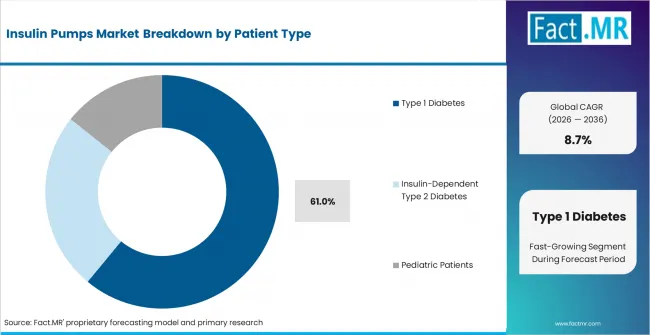
Type 1 diabetes forms the largest patient base because patients require lifelong insulin replacement. This patient group is estimated to account for 61.0% share in 2026. Insulin pumps are widely used by Type 1 diabetes patients who need flexible basal and bolus dosing throughout the day. ADA standards of care support the use of diabetes technology, including insulin delivery systems, where appropriate for individual patients. Insulin-dependent Type 2 diabetes is growing, but Type 1 diabetes remains the core pump therapy base because insulin dependence is continuous. Pediatric and adolescent users also benefit from programmable delivery. Weak training can reduce therapy effectiveness and patient trust.
- Lifelong Insulin Need: Type 1 diabetes requires continuous insulin management across all age groups.
- Dosing Flexibility: Pumps support basal adjustments and mealtime bolus delivery.
- Pediatric Value: Programmable systems help caregivers manage variable food intake and activity.
Insulin Pumps Market Analysis by End User
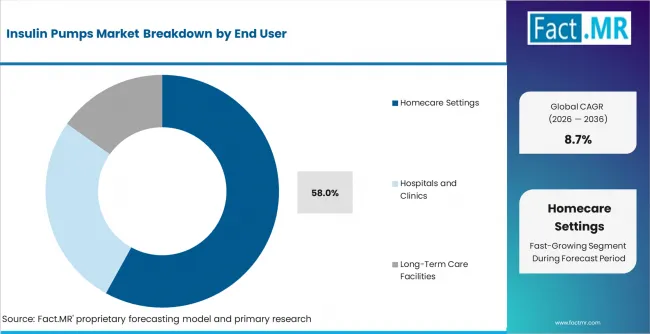
Homecare settings lead because insulin pump therapy is managed mainly in daily life rather than inside hospitals. Homecare settings are expected to hold 58.0% share in 2026. Patients wear pumps at home, school, work, and during travel, making comfort and support services central to adoption. CDC diabetes resources emphasize day-to-day diabetes management, which supports home-based device use. Hospitals and clinics remain important for initiation, education, and follow-up. Homecare leads because pump value depends on continuous personal use. Poor user education can lead to infusion failures, incorrect dosing, and therapy discontinuation.
- Daily Management: Pump therapy supports insulin delivery across routine home and work activities.
- Training Need: Diabetes educators help users learn infusion changes and troubleshooting.
- Follow-Up Link: Clinics remain important for dose adjustment and device review.
Insulin Pumps Market Analysis by Sales Channel
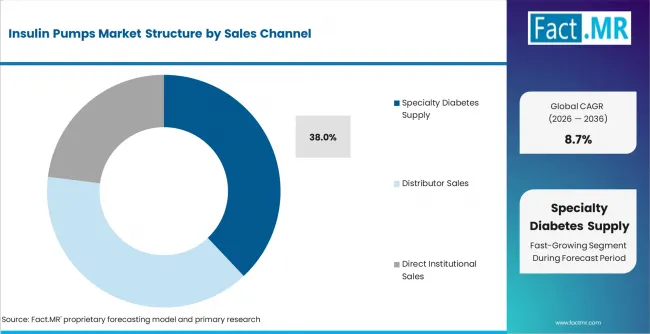
Specialty diabetes supply leads because insulin pumps and accessories require device-specific fulfillment, training coordination, insurance support, and recurring consumable delivery. Specialty diabetes supply is expected to account for 38.0% share in 2026. This channel helps patients obtain reservoirs, infusion sets, adhesives, and replacement accessories on schedule. Medicare information on insulin pump coverage supports the role of structured supply channels for eligible users [5]. Retail and online pharmacy channels are growing for selected accessories, but specialty supply remains central for full pump therapy. Weak supply coordination can create therapy gaps and patient frustration.
- Access Coordination: Specialty suppliers help manage pump orders, accessories, and insurance requirements.
- Recurring Fulfillment: Pump users need regular delivery of reservoirs, infusion sets, and adhesives.
- Device Support: Supplier education improves confidence during product changes and replacements.
Drivers, Restraints, and Opportunities
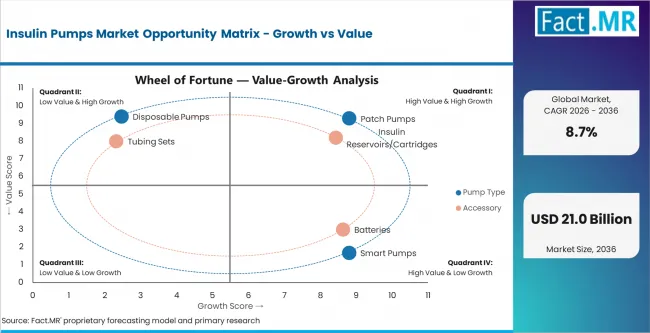
Rising diabetes prevalence and growing technology acceptance are increasing demand for insulin pumps. Patients want systems that reduce injection burden and support more flexible glucose control. ADA standards of care recognize diabetes technology as part of individualized diabetes management [2]. Demand improves where pumps connect with CGM systems and automated insulin delivery features. Patch pumps and hybrid closed-loop systems are gaining interest because they reduce daily management burden and improve user convenience.
High device cost and training needs restrain faster adoption. Insulin pumps require education, troubleshooting, and regular accessory replacement. Some patients may experience skin irritation, infusion set failure, or device alarms that affect confidence. Reimbursement gaps restrict adoption in several countries. Pump therapy may be harder for users who lack digital literacy or caregiver support. Suppliers must prove comfort, safety, and long-term support before adoption expands across broader diabetes populations.
- Hybrid Closed-Loop Systems: Automated insulin delivery can gain share where CGM integration improves glucose management.
- Patch Pump Adoption: Tubeless devices create opportunities among pediatric and active adult users.
- Emerging Market Access: Diabetes clinics in China, India, and Brazil can expand pump use as training and reimbursement improve.
Regional Analysis
The insulin pumps market is assessed across North America, Europe, Asia Pacific, Latin America, and Middle East and Africa, covering 40+ countries with demand profiles shaped by diabetes prevalence, reimbursement access, endocrinology care, CGM adoption, homecare support, and specialty supply networks.
.webp)
| Country | CAGR (2026 to 2036) |
|---|---|
| China | 10.2% |
| India | 9.6% |
| USA | 8.5% |
| Germany | 7.8% |
| Japan | 7.4% |
| Brazil | 7.0% |
Source: Fact.MR analysis, based on proprietary forecasting model and primary research
Asia Pacific Insulin Pumps Market Analysis
Asia Pacific records the strongest growth because diabetes diagnosis, private healthcare access, and digital health adoption are improving together. China and India are expanding endocrinology care in urban hospitals, while Japan adds demand through precision diabetes management and aging-related insulin use. IDF resources show diabetes as a major global health challenge, which supports investment in diabetes care technologies [6]. The region still faces affordability and training gaps. Growth depends on reimbursement, patient education, CGM access, and specialty device distribution.
- China: China leads the country outlook as diabetes care expansion and digital health adoption strengthen insulin pump demand. The country is projected to grow at 10.2% CAGR through 2036. Urban hospitals and diabetes clinics are expanding pump education and CGM-linked care. Patch pumps gain attention among younger and working patients. Buyers weigh device comfort, support services, and out-of-pocket cost before adoption.
- India: Rising diabetes diagnosis and private endocrinology care support insulin pump growth in India. Pump adoption remains concentrated in urban hospitals and specialist clinics. India is forecast to grow at 9.6% CAGR by 2036. Cost sensitivity remains important, but Type 1 diabetes patients and higher-income insulin-dependent users are adopting advanced delivery systems. Suppliers with training programs and financing support can improve adoption.
- Japan: Aging-related diabetes care and precision dosing needs support insulin pump demand in Japan. Hospitals and clinics value systems that reduce glycemic variability and support safe insulin delivery. Japan is projected to post 7.4% CAGR from 2026 to 2036. Growth is steady because diabetes care infrastructure is well developed. Suppliers with compact devices and dependable support can maintain demand.
North America Insulin Pumps Market Analysis
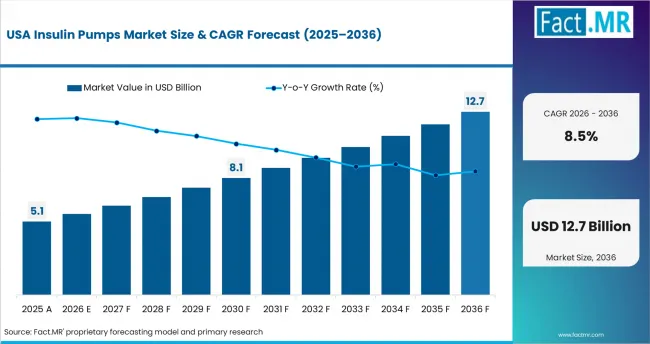
North America remains a high-value region because reimbursement, diabetes technology adoption, and specialist care access support insulin pump use. The United States anchors regional demand through advanced pump systems, CGM integration, and strong manufacturer presence. Fact.MR lists Medtronic, Insulet, Tandem Diabetes Care, Roche, Ypsomed, and Debiotech among prominent market participants.
- USA: The United States has a large insulin pump user base supported by endocrinology care, device innovation, and reimbursement access. Demand is anchored in Type 1 diabetes and insulin-dependent Type 2 diabetes. The country is expected to record 8.5% CAGR by 2036. Hybrid closed-loop systems gain attention where users seek stronger glucose control. Purchasers and payers examine outcomes, device reliability, and supply continuity before expanding access.
Europe Insulin Pumps Market Analysis
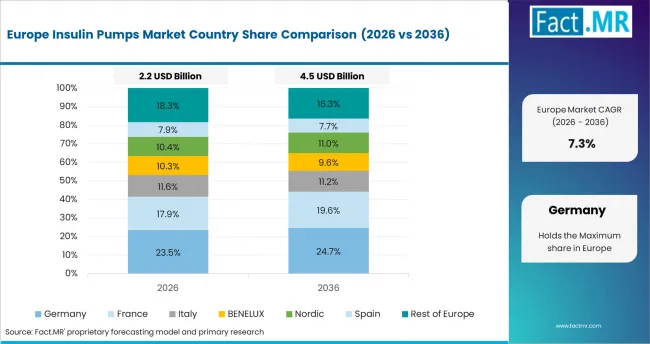
Europe shows steady demand because diabetes care pathways, reimbursement systems, and device safety rules support structured pump use. Germany leads regional growth through strong diabetes care infrastructure and advanced therapy adoption. European medical device rules shape product documentation, safety monitoring, and device evaluation. Pump uptake is supported by specialist clinics and patient education programs. Demand growth is moderate compared with Asia because pump therapy is already established in several countries. Suppliers compete through automated dosing features, patch pump comfort, and service reliability.
- Germany: Germany benefits from structured diabetes care, reimbursement access, and established specialist clinics. Demand is linked to Type 1 diabetes, pediatric pump therapy, and CGM-integrated insulin delivery. Germany is forecast to grow at 7.8% CAGR over the study period. Patients and clinicians tend to favor reliable systems with strong training support. Device performance and accessory availability influence adoption more than product claims alone.
Latin America Insulin Pumps Market Analysis
Latin America shows selective growth where private healthcare systems and diabetes specialty clinics are improving access to advanced devices. Brazil leads regional demand through private endocrinology care and growing awareness of insulin delivery options. Cost remains a major barrier because pump therapy requires both device purchase and recurring accessories. Demand improves when insurers, specialty suppliers, and clinics coordinate patient support. Growth remains uneven because public reimbursement and trained diabetes educators vary across countries.
- Brazil: Private healthcare growth and improving diabetes device access support insulin pump demand in Brazil. Pump therapy remains concentrated among Type 1 diabetes patients and higher-income insulin-dependent users. Brazil is anticipated to expand at 7.0% CAGR over the foreseen period. Clinics often compare pump outcomes with affordability before recommending therapy. Suppliers with education, accessory supply, and financing support can strengthen adoption.
Fact.MR analysis of regional demand covers Asia Pacific, North America, Europe, Latin America, and Middle East and Africa. The study assesses diabetes prevalence, reimbursement, endocrinology care, CGM adoption, homecare support, and specialty supply access across major markets.
Competitive Aligners for Market Players
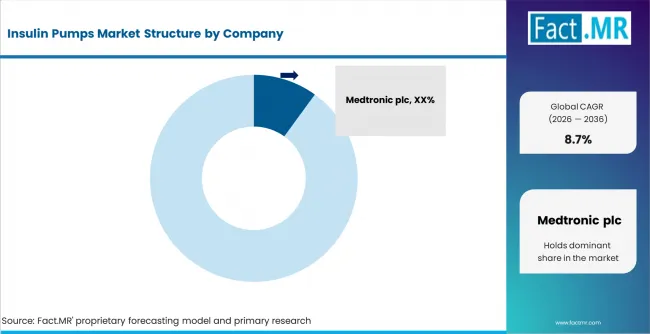
The insulin pumps market is moderately concentrated because device development requires software, dosing accuracy, safety systems, regulatory approval, and recurring accessory networks. Large companies hold advantages through clinical evidence, reimbursement relationships, CGM partnerships, and user support programs. Smaller firms compete through patch pump designs, miniaturization, and market-specific affordability.
Competitive advantage depends on dosing precision, CGM integration, patient comfort, battery life, infusion reliability, and service support. Medtronic, Insulet, Tandem Diabetes Care, Roche, Ypsomed, and Debiotech represent supplier groups where device performance and patient support matter. Patients are less likely to switch pumps when training, accessories, and clinician familiarity are already established.
The market is divided between tethered pumps, tubeless patch pumps, and hybrid closed-loop systems. Suppliers that combine reliable delivery with simple user experience and recurring accessory support can protect demand. Regional companies can gain ground where affordability and local service access matter most.
Key Players
- Medtronic plc
- Insulet Corporation
- Tandem Diabetes Care, Inc.
- F. Hoffmann-La Roche Ltd.
- Ypsomed Holding AG
- Debiotech S.A.
- SOOIL Development Co., Ltd.
- MicroTech Medical
- Sinocare Inc.
- EOFlow Co., Ltd.
- ViCentra B.V.
- Zealand Pharma A/S
Scope of Report
| Attribute | Details |
|---|---|
| Quantitative Units | USD 8.4 billion (2026) to USD 19.4 billion (2036), at a CAGR of 8.7% |
| Market Definition | Insulin infusion pumps and accessories used for continuous insulin delivery in diabetes care |
| Forecast Period | 2026 to 2036 |
| Historical Reference | 2025 |
| Pump Type Covered | Tethered pumps, patch pumps, smart pumps, disposable pumps, hybrid closed-loop pumps |
| Accessory Covered | Infusion set insertion devices, insulin reservoirs/cartridges, batteries, tubing sets, adhesive patches |
| Patient Type Covered | Type 1 diabetes, insulin-dependent Type 2 diabetes, pediatric patients, adults, geriatric patients |
| End User Covered | Homecare settings, hospitals and clinics, long-term care facilities, diabetes care centers, other care settings |
| Sales Channel Covered | Direct institutional sales, retail pharmacy, online pharmacy, specialty diabetes supply, distributor sales |
| Regions Covered | North America, Europe, Asia Pacific, Latin America, Middle East and Africa |
| Countries Covered | USA, Canada, Mexico, Germany, UK, France, Italy, Spain, Nordic, BENELUX, China, Japan, South Korea, India, ASEAN, Australia and New Zealand, Brazil, Argentina, Chile, Saudi Arabia, GCC, Turkey, South Africa, and Rest of MEA |
| Key Companies Profiled | Medtronic, Insulet, Tandem Diabetes Care, Roche, Ypsomed, Debiotech, SOOIL Development, MicroTech Medical, Sinocare, EOFlow, ViCentra, Zealand Pharma |
| Approach | Hybrid top-down and bottom-up model using insulin-dependent diabetes population, pump adoption, accessory replacement, device pricing, reimbursement access, and primary interviews with diabetes care stakeholders |
Bibliography
- [1] Centers for Disease Control and Prevention. (2024). Diabetes. CDC.
- [2] American Diabetes Association. (2024). Standards of care in diabetes. ADA.
- [3] United States Food and Drug Administration. (2024). Insulin pumps. FDA.
- [4] National Institute of Diabetes and Digestive and Kidney Diseases. (2024). Insulin, medicines, and other diabetes treatments. NIDDK.
- [5] Centers for Medicare & Medicaid Services. (2024). Insulin pumps. Medicare.
- [6] International Diabetes Federation. (2024). Diabetes facts and figures. IDF.
This Report Addresses
- Strategic intelligence on insulin pump demand across tethered pumps, patch pumps, smart pumps, disposable pumps, and hybrid closed-loop systems globally.
- Market forecast from USD 8.4 billion in 2026 to USD 19.4 billion by 2036 at a CAGR of 8.7%.
- Growth opportunity mapping across China digital diabetes care, India endocrinology expansion, U.S. CGM-integrated systems, Germany pump therapy access, Japan precision dosing, and Brazil private healthcare growth.
- Segment analysis by pump type, accessory, patient type, end user, sales channel, and region.
- Regional outlook covering Asia Pacific diabetes technology growth, North America automated insulin delivery, and Europe structured pump therapy access.
- Competitive analysis of Medtronic, Insulet, Tandem Diabetes Care, Roche, Ypsomed, Debiotech, SOOIL Development, MicroTech Medical, Sinocare, and EOFlow.
- Device adoption analysis covering dosing precision, patient comfort, CGM integration, accessory supply, training support, and reimbursement access.
- Report delivered with market sizing, segment outlook, regional analysis, company profiling, and forecast assumptions.
Insulin Pumps Market Definition
The market covers insulin infusion pumps used to deliver insulin continuously for people with diabetes who require insulin therapy. These devices include tethered pumps, patch pumps, smart pumps, disposable pumps, and hybrid closed-loop systems. The scope includes pump accessories such as reservoirs, cartridges, infusion sets, batteries, tubing, insertion devices, and adhesive components.
Insulin Pumps Market Inclusions
The study includes global and regional forecasts from 2026 to 2036. It covers insulin pumps used in homecare, hospitals, clinics, long-term care facilities, and diabetes care centers. It includes systems used by people with Type 1 diabetes and insulin-dependent Type 2 diabetes. It also includes CGM-compatible pumps and automated insulin delivery systems.
Insulin Pumps Market Exclusions
The scope excludes insulin pens, syringes, standalone continuous glucose monitors, glucose meters, lancets, insulin drugs, and diabetes management software sold without pump integration. It also excludes hospital infusion pumps used for non-insulin drugs. The focus stays on dedicated insulin delivery pump systems and related pump accessories.
Insulin Pumps Market Research Methodology
- Primary Research
- Interviews with endocrinologists, diabetes educators, hospital diabetes program heads, homecare providers, device distributors, and specialty pharmacy managers across major consuming regions.
- Desk Research
- Uses diabetes care guidance, device safety resources, regulatory documents, reimbursement references, product catalogues, and company information. [3]
- Market-Sizing and Forecasting
- Hybrid model using diagnosed diabetes population, insulin-dependent patient pools, pump adoption rates, accessory replacement demand, device pricing, and regional reimbursement access.
- Data Validation and Update Cycle
- Forecasts were validated through distributor checks, diabetes care center inputs, specialty pharmacy data, product availability reviews, and regional diabetes care indicators.
Insulin Pumps Market by Segments
-
By Pump Type:
- Tethered Pumps
- Patch Pumps
- Smart Pumps
- Disposable Pumps
- Hybrid Closed-Loop Pumps
-
By Accessory:
- Infusion Set Insertion Devices
- Insulin Reservoirs/Cartridges
- Batteries
- Tubing Sets
- Adhesive Patches
-
By Patient Type:
- Type 1 Diabetes
- Insulin-Dependent Type 2 Diabetes
- Pediatric Patients
- Adults
- Geriatric Patients
-
By End User:
- Homecare Settings
- Hospitals and Clinics
- Long-Term Care Facilities
- Diabetes Care Centers
- Other Care Settings
-
By Sales Channel:
- Direct Institutional Sales
- Retail Pharmacy
- Online Pharmacy
- Specialty Diabetes Supply
- Distributor Sales
-
By Region:
- North America
- United States
- Canada
- Mexico
- Latin America
- Brazil
- Argentina
- Chile
- Rest of Latin America
- Western Europe
- Germany
- France
- United Kingdom
- Italy
- Spain
- Nordic Countries
- BENELUX
- Rest of Western Europe
- Eastern Europe
- Russia
- Poland
- Hungary
- Balkan and Baltic
- Rest of Eastern Europe
- East Asia
- China
- Japan
- South Korea
- South Asia and Pacific
- India
- ASEAN
- Australia and New Zealand
- Rest of South Asia and Pacific
- Middle East and Africa
- Kingdom of Saudi Arabia
- Other GCC Countries
- Turkey
- South Africa
- Rest of Middle East and Africa
- North America
- Frequently Asked Questions -
How large is the global insulin pumps market in 2025?
The global insulin pumps market was valued at USD 7.7 billion in 2025.
What will the market size be in 2026?
Based on revised Fact.MR analysis, demand for insulin pumps is estimated to grow to USD 8.4 billion in 2026.
What is the projected market size by 2036?
The market is projected to reach USD 19.4 billion by 2036, generating USD 10.9 billion in absolute dollar opportunity.
What is the expected CAGR from 2026 to 2036?
Fact.MR projects a CAGR of 8.7% for the global insulin pumps market during the forecast period.
Which pump type is poised to lead the market?
Patch pumps lead with approximately 43.0% share in 2026 due to tubeless use and daily convenience.
Which accessory accounts for the largest demand?
Insulin reservoirs/cartridges account for about 34.0% share in 2026 because pump users need regular replacement.
Which patient type holds the highest share?
Type 1 diabetes holds around 61.0% share in 2026 due to lifelong insulin dependence and pump therapy use.
Which end user leads the market?
Homecare settings hold nearly 58.0% share in 2026 because pump therapy is mainly managed in daily life.
Which sales channel leads demand?
Specialty diabetes supply holds around 38.0% share in 2026 because pumps and accessories need coordinated fulfillment.
Which country shows the fastest growth?
China leads at 10.2% CAGR through 2036, supported by diabetes care expansion and digital health adoption.
What is driving demand for insulin pumps?
Demand is driven by diabetes prevalence, fewer daily injections, CGM integration, patch pump adoption, and automated insulin delivery.
What is the key challenge in this market?
High device cost, training needs, reimbursement gaps, skin irritation, and accessory supply dependence limit faster adoption.
Table of Content
- Executive Summary
- Global Market Outlook
- Demand to side Trends
- Supply to side Trends
- Technology Roadmap Analysis
- Analysis and Recommendations
- Market Overview
- Market Coverage / Taxonomy
- Market Definition / Scope / Limitations
- Research Methodology
- Chapter Orientation
- Analytical Lens and Working Hypotheses
- Market Structure, Signals, and Trend Drivers
- Benchmarking and Cross-market Comparability
- Market Sizing, Forecasting, and Opportunity Mapping
- Research Design and Evidence Framework
- Desk Research Programme (Secondary Evidence)
- Company Annual and Sustainability Reports
- Peer-reviewed Journals and Academic Literature
- Corporate Websites, Product Literature, and Technical Notes
- Earnings Decks and Investor Briefings
- Statutory Filings and Regulatory Disclosures
- Technical White Papers and Standards Notes
- Trade Journals, Industry Magazines, and Analyst Briefs
- Conference Proceedings, Webinars, and Seminar Materials
- Government Statistics Portals and Public Data Releases
- Press Releases and Reputable Media Coverage
- Specialist Newsletters and Curated Briefings
- Sector Databases and Reference Repositories
- Fact.MR Internal Proprietary Databases and Historical Market Datasets
- Subscription Datasets and Paid Sources
- Social Channels, Communities, and Digital Listening Inputs
- Additional Desk Sources
- Expert Input and Fieldwork (Primary Evidence)
- Primary Modes
- Qualitative Interviews and Expert Elicitation
- Quantitative Surveys and Structured Data Capture
- Blended Approach
- Why Primary Evidence is Used
- Field Techniques
- Interviews
- Surveys
- Focus Groups
- Observational and In-context Research
- Social and Community Interactions
- Stakeholder Universe Engaged
- C-suite Leaders
- Board Members
- Presidents and Vice Presidents
- R&D and Innovation Heads
- Technical Specialists
- Domain Subject-matter Experts
- Scientists
- Physicians and Other Healthcare Professionals
- Governance, Ethics, and Data Stewardship
- Research Ethics
- Data Integrity and Handling
- Primary Modes
- Tooling, Models, and Reference Databases
- Desk Research Programme (Secondary Evidence)
- Data Engineering and Model Build
- Data Acquisition and Ingestion
- Cleaning, Normalisation, and Verification
- Synthesis, Triangulation, and Analysis
- Quality Assurance and Audit Trail
- Market Background
- Market Dynamics
- Drivers
- Restraints
- Opportunity
- Trends
- Scenario Forecast
- Demand in Optimistic Scenario
- Demand in Likely Scenario
- Demand in Conservative Scenario
- Opportunity Map Analysis
- Product Life Cycle Analysis
- Supply Chain Analysis
- Investment Feasibility Matrix
- Value Chain Analysis
- PESTLE and Porter’s Analysis
- Regulatory Landscape
- Regional Parent Market Outlook
- Production and Consumption Statistics
- Import and Export Statistics
- Market Dynamics
- Global Market Analysis 2021 to 2025 and Forecast, 2026 to 2036
- Historical Market Size Value (USD Million) Analysis, 2021 to 2025
- Current and Future Market Size Value (USD Million) Projections, 2026 to 2036
- Y to o to Y Growth Trend Analysis
- Absolute $ Opportunity Analysis
- Global Market Pricing Analysis 2021 to 2025 and Forecast 2026 to 2036
- Global Market Analysis 2021 to 2025 and Forecast 2026 to 2036, By Motor Type
- Introduction / Key Findings
- Historical Market Size Value (USD Million) Analysis By Motor Type , 2021 to 2025
- Current and Future Market Size Value (USD Million) Analysis and Forecast By Motor Type , 2026 to 2036
- AC Motors
- DC Motors
- Synchronous AC Motors
- AC Motors
- Y to o to Y Growth Trend Analysis By Motor Type , 2021 to 2025
- Absolute $ Opportunity Analysis By Motor Type , 2026 to 2036
- Global Market Analysis 2021 to 2025 and Forecast 2026 to 2036, By Power Rating
- Introduction / Key Findings
- Historical Market Size Value (USD Million) Analysis By Power Rating, 2021 to 2025
- Current and Future Market Size Value (USD Million) Analysis and Forecast By Power Rating, 2026 to 2036
- Less than 200 kW
- 200 kW to 400 kW
- 400 kW to 700 kW
- Less than 200 kW
- Y to o to Y Growth Trend Analysis By Power Rating, 2021 to 2025
- Absolute $ Opportunity Analysis By Power Rating, 2026 to 2036
- Global Market Analysis 2021 to 2025 and Forecast 2026 to 2036, By Application
- Introduction / Key Findings
- Historical Market Size Value (USD Million) Analysis By Application, 2021 to 2025
- Current and Future Market Size Value (USD Million) Analysis and Forecast By Application, 2026 to 2036
- Electric Multiple Value (USD Million)s
- Metros and Light Rail
- High-Speed Trains
- Electric Multiple Value (USD Million)s
- Y to o to Y Growth Trend Analysis By Application, 2021 to 2025
- Absolute $ Opportunity Analysis By Application, 2026 to 2036
- Global Market Analysis 2021 to 2025 and Forecast 2026 to 2036, By End Use
- Introduction / Key Findings
- Historical Market Size Value (USD Million) Analysis By End Use, 2021 to 2025
- Current and Future Market Size Value (USD Million) Analysis and Forecast By End Use, 2026 to 2036
- Passenger Rail
- Freight Rail
- Metro Rail
- Passenger Rail
- Y to o to Y Growth Trend Analysis By End Use, 2021 to 2025
- Absolute $ Opportunity Analysis By End Use, 2026 to 2036
- Global Market Analysis 2021 to 2025 and Forecast 2026 to 2036, By Sales Channel
- Introduction / Key Findings
- Historical Market Size Value (USD Million) Analysis By Sales Channel, 2021 to 2025
- Current and Future Market Size Value (USD Million) Analysis and Forecast By Sales Channel, 2026 to 2036
- Direct OEM Supply
- Railway Authority Contracts
- Aftermarket and Replacement Supply
- Direct OEM Supply
- Y to o to Y Growth Trend Analysis By Sales Channel, 2021 to 2025
- Absolute $ Opportunity Analysis By Sales Channel, 2026 to 2036
- Global Market Analysis 2021 to 2025 and Forecast 2026 to 2036, By Region
- Introduction
- Historical Market Size Value (USD Million) Analysis By Region, 2021 to 2025
- Current Market Size Value (USD Million) Analysis and Forecast By Region, 2026 to 2036
- North America
- Latin America
- Western Europe
- Eastern Europe
- East Asia
- South Asia and Pacific
- Middle East & Africa
- Market Attractiveness Analysis By Region
- North America Market Analysis 2021 to 2025 and Forecast 2026 to 2036, By Country
- Historical Market Size Value (USD Million) Trend Analysis By Market Taxonomy, 2021 to 2025
- Market Size Value (USD Million) Forecast By Market Taxonomy, 2026 to 2036
- By Country
- USA
- Canada
- Mexico
- By Motor Type
- By Power Rating
- By Application
- By End Use
- By Sales Channel
- By Country
- Market Attractiveness Analysis
- By Country
- By Motor Type
- By Power Rating
- By Application
- By End Use
- By Sales Channel
- Key Takeaways
- Latin America Market Analysis 2021 to 2025 and Forecast 2026 to 2036, By Country
- Historical Market Size Value (USD Million) Trend Analysis By Market Taxonomy, 2021 to 2025
- Market Size Value (USD Million) Forecast By Market Taxonomy, 2026 to 2036
- By Country
- Brazil
- Chile
- Rest of Latin America
- By Motor Type
- By Power Rating
- By Application
- By End Use
- By Sales Channel
- By Country
- Market Attractiveness Analysis
- By Country
- By Motor Type
- By Power Rating
- By Application
- By End Use
- By Sales Channel
- Key Takeaways
- Western Europe Market Analysis 2021 to 2025 and Forecast 2026 to 2036, By Country
- Historical Market Size Value (USD Million) Trend Analysis By Market Taxonomy, 2021 to 2025
- Market Size Value (USD Million) Forecast By Market Taxonomy, 2026 to 2036
- By Country
- Germany
- UK
- Italy
- Spain
- France
- Nordic
- BENELUX
- Rest of Western Europe
- By Motor Type
- By Power Rating
- By Application
- By End Use
- By Sales Channel
- By Country
- Market Attractiveness Analysis
- By Country
- By Motor Type
- By Power Rating
- By Application
- By End Use
- By Sales Channel
- Key Takeaways
- Eastern Europe Market Analysis 2021 to 2025 and Forecast 2026 to 2036, By Country
- Historical Market Size Value (USD Million) Trend Analysis By Market Taxonomy, 2021 to 2025
- Market Size Value (USD Million) Forecast By Market Taxonomy, 2026 to 2036
- By Country
- Russia
- Poland
- Hungary
- Balkan & Baltic
- Rest of Eastern Europe
- By Motor Type
- By Power Rating
- By Application
- By End Use
- By Sales Channel
- By Country
- Market Attractiveness Analysis
- By Country
- By Motor Type
- By Power Rating
- By Application
- By End Use
- By Sales Channel
- Key Takeaways
- East Asia Market Analysis 2021 to 2025 and Forecast 2026 to 2036, By Country
- Historical Market Size Value (USD Million) Trend Analysis By Market Taxonomy, 2021 to 2025
- Market Size Value (USD Million) Forecast By Market Taxonomy, 2026 to 2036
- By Country
- China
- Japan
- South Korea
- By Motor Type
- By Power Rating
- By Application
- By End Use
- By Sales Channel
- By Country
- Market Attractiveness Analysis
- By Country
- By Motor Type
- By Power Rating
- By Application
- By End Use
- By Sales Channel
- Key Takeaways
- South Asia and Pacific Market Analysis 2021 to 2025 and Forecast 2026 to 2036, By Country
- Historical Market Size Value (USD Million) Trend Analysis By Market Taxonomy, 2021 to 2025
- Market Size Value (USD Million) Forecast By Market Taxonomy, 2026 to 2036
- By Country
- India
- ASEAN
- Australia & New Zealand
- Rest of South Asia and Pacific
- By Motor Type
- By Power Rating
- By Application
- By End Use
- By Sales Channel
- By Country
- Market Attractiveness Analysis
- By Country
- By Motor Type
- By Power Rating
- By Application
- By End Use
- By Sales Channel
- Key Takeaways
- Middle East & Africa Market Analysis 2021 to 2025 and Forecast 2026 to 2036, By Country
- Historical Market Size Value (USD Million) Trend Analysis By Market Taxonomy, 2021 to 2025
- Market Size Value (USD Million) Forecast By Market Taxonomy, 2026 to 2036
- By Country
- Kingdom of Saudi Arabia
- Other GCC Countries
- Turkiye
- South Africa
- Other African Union
- Rest of Middle East & Africa
- By Motor Type
- By Power Rating
- By Application
- By End Use
- By Sales Channel
- By Country
- Market Attractiveness Analysis
- By Country
- By Motor Type
- By Power Rating
- By Application
- By End Use
- By Sales Channel
- Key Takeaways
- Key Countries Market Analysis
- USA
- Pricing Analysis
- Market Share Analysis, 2025
- By Motor Type
- By Power Rating
- By Application
- By End Use
- By Sales Channel
- Canada
- Pricing Analysis
- Market Share Analysis, 2025
- By Motor Type
- By Power Rating
- By Application
- By End Use
- By Sales Channel
- Mexico
- Pricing Analysis
- Market Share Analysis, 2025
- By Motor Type
- By Power Rating
- By Application
- By End Use
- By Sales Channel
- Brazil
- Pricing Analysis
- Market Share Analysis, 2025
- By Motor Type
- By Power Rating
- By Application
- By End Use
- By Sales Channel
- Chile
- Pricing Analysis
- Market Share Analysis, 2025
- By Motor Type
- By Power Rating
- By Application
- By End Use
- By Sales Channel
- Germany
- Pricing Analysis
- Market Share Analysis, 2025
- By Motor Type
- By Power Rating
- By Application
- By End Use
- By Sales Channel
- UK
- Pricing Analysis
- Market Share Analysis, 2025
- By Motor Type
- By Power Rating
- By Application
- By End Use
- By Sales Channel
- Italy
- Pricing Analysis
- Market Share Analysis, 2025
- By Motor Type
- By Power Rating
- By Application
- By End Use
- By Sales Channel
- Spain
- Pricing Analysis
- Market Share Analysis, 2025
- By Motor Type
- By Power Rating
- By Application
- By End Use
- By Sales Channel
- France
- Pricing Analysis
- Market Share Analysis, 2025
- By Motor Type
- By Power Rating
- By Application
- By End Use
- By Sales Channel
- India
- Pricing Analysis
- Market Share Analysis, 2025
- By Motor Type
- By Power Rating
- By Application
- By End Use
- By Sales Channel
- ASEAN
- Pricing Analysis
- Market Share Analysis, 2025
- By Motor Type
- By Power Rating
- By Application
- By End Use
- By Sales Channel
- Australia & New Zealand
- Pricing Analysis
- Market Share Analysis, 2025
- By Motor Type
- By Power Rating
- By Application
- By End Use
- By Sales Channel
- China
- Pricing Analysis
- Market Share Analysis, 2025
- By Motor Type
- By Power Rating
- By Application
- By End Use
- By Sales Channel
- Japan
- Pricing Analysis
- Market Share Analysis, 2025
- By Motor Type
- By Power Rating
- By Application
- By End Use
- By Sales Channel
- South Korea
- Pricing Analysis
- Market Share Analysis, 2025
- By Motor Type
- By Power Rating
- By Application
- By End Use
- By Sales Channel
- Russia
- Pricing Analysis
- Market Share Analysis, 2025
- By Motor Type
- By Power Rating
- By Application
- By End Use
- By Sales Channel
- Poland
- Pricing Analysis
- Market Share Analysis, 2025
- By Motor Type
- By Power Rating
- By Application
- By End Use
- By Sales Channel
- Hungary
- Pricing Analysis
- Market Share Analysis, 2025
- By Motor Type
- By Power Rating
- By Application
- By End Use
- By Sales Channel
- Kingdom of Saudi Arabia
- Pricing Analysis
- Market Share Analysis, 2025
- By Motor Type
- By Power Rating
- By Application
- By End Use
- By Sales Channel
- Turkiye
- Pricing Analysis
- Market Share Analysis, 2025
- By Motor Type
- By Power Rating
- By Application
- By End Use
- By Sales Channel
- South Africa
- Pricing Analysis
- Market Share Analysis, 2025
- By Motor Type
- By Power Rating
- By Application
- By End Use
- By Sales Channel
- USA
- Market Structure Analysis
- Competition Dashboard
- Competition Benchmarking
- Market Share Analysis of Top Players
- By Regional
- By Motor Type
- By Power Rating
- By Application
- By End Use
- By Sales Channel
- Competition Analysis
- Competition Deep Dive
- Mitsubishi Electric Corporation
- Overview
- Product Portfolio
- Profitability by Market Segments (Product/Age /Sales Channel/Region)
- Sales Footprint
- Strategy Overview
- Marketing Strategy
- Product Strategy
- Channel Strategy
- ABB Ltd.
- Alstom Holdings SA
- Caterpillar Inc.
- Bharat Heavy Electricals Limited
- Siemens Mobility GmbH
- Mitsubishi Electric Corporation
- Competition Deep Dive
- Assumptions & Acronyms Used
List Of Table
- Table 1: Global Market Value (USD Million) Forecast by Region, 2021 to 2036
- Table 2: Global Market Value (USD Million) Forecast by Motor Type, 2021 to 2036
- Table 3: Global Market Value (USD Million) Forecast by Power Rating, 2021 to 2036
- Table 4: Global Market Value (USD Million) Forecast by Application, 2021 to 2036
- Table 5: Global Market Value (USD Million) Forecast by End Use, 2021 to 2036
- Table 6: Global Market Value (USD Million) Forecast by Sales Channel, 2021 to 2036
- Table 7: North America Market Value (USD Million) Forecast by Country, 2021 to 2036
- Table 8: North America Market Value (USD Million) Forecast by Motor Type, 2021 to 2036
- Table 9: North America Market Value (USD Million) Forecast by Power Rating, 2021 to 2036
- Table 10: North America Market Value (USD Million) Forecast by Application, 2021 to 2036
- Table 11: North America Market Value (USD Million) Forecast by End Use, 2021 to 2036
- Table 12: North America Market Value (USD Million) Forecast by Sales Channel, 2021 to 2036
- Table 13: Latin America Market Value (USD Million) Forecast by Country, 2021 to 2036
- Table 14: Latin America Market Value (USD Million) Forecast by Motor Type, 2021 to 2036
- Table 15: Latin America Market Value (USD Million) Forecast by Power Rating, 2021 to 2036
- Table 16: Latin America Market Value (USD Million) Forecast by Application, 2021 to 2036
- Table 17: Latin America Market Value (USD Million) Forecast by End Use, 2021 to 2036
- Table 18: Latin America Market Value (USD Million) Forecast by Sales Channel, 2021 to 2036
- Table 19: Western Europe Market Value (USD Million) Forecast by Country, 2021 to 2036
- Table 20: Western Europe Market Value (USD Million) Forecast by Motor Type, 2021 to 2036
- Table 21: Western Europe Market Value (USD Million) Forecast by Power Rating, 2021 to 2036
- Table 22: Western Europe Market Value (USD Million) Forecast by Application, 2021 to 2036
- Table 23: Western Europe Market Value (USD Million) Forecast by End Use, 2021 to 2036
- Table 24: Western Europe Market Value (USD Million) Forecast by Sales Channel, 2021 to 2036
- Table 25: Eastern Europe Market Value (USD Million) Forecast by Country, 2021 to 2036
- Table 26: Eastern Europe Market Value (USD Million) Forecast by Motor Type, 2021 to 2036
- Table 27: Eastern Europe Market Value (USD Million) Forecast by Power Rating, 2021 to 2036
- Table 28: Eastern Europe Market Value (USD Million) Forecast by Application, 2021 to 2036
- Table 29: Eastern Europe Market Value (USD Million) Forecast by End Use, 2021 to 2036
- Table 30: Eastern Europe Market Value (USD Million) Forecast by Sales Channel, 2021 to 2036
- Table 31: East Asia Market Value (USD Million) Forecast by Country, 2021 to 2036
- Table 32: East Asia Market Value (USD Million) Forecast by Motor Type, 2021 to 2036
- Table 33: East Asia Market Value (USD Million) Forecast by Power Rating, 2021 to 2036
- Table 34: East Asia Market Value (USD Million) Forecast by Application, 2021 to 2036
- Table 35: East Asia Market Value (USD Million) Forecast by End Use, 2021 to 2036
- Table 36: East Asia Market Value (USD Million) Forecast by Sales Channel, 2021 to 2036
- Table 37: South Asia and Pacific Market Value (USD Million) Forecast by Country, 2021 to 2036
- Table 38: South Asia and Pacific Market Value (USD Million) Forecast by Motor Type, 2021 to 2036
- Table 39: South Asia and Pacific Market Value (USD Million) Forecast by Power Rating, 2021 to 2036
- Table 40: South Asia and Pacific Market Value (USD Million) Forecast by Application, 2021 to 2036
- Table 41: South Asia and Pacific Market Value (USD Million) Forecast by End Use, 2021 to 2036
- Table 42: South Asia and Pacific Market Value (USD Million) Forecast by Sales Channel, 2021 to 2036
- Table 43: Middle East & Africa Market Value (USD Million) Forecast by Country, 2021 to 2036
- Table 44: Middle East & Africa Market Value (USD Million) Forecast by Motor Type, 2021 to 2036
- Table 45: Middle East & Africa Market Value (USD Million) Forecast by Power Rating, 2021 to 2036
- Table 46: Middle East & Africa Market Value (USD Million) Forecast by Application, 2021 to 2036
- Table 47: Middle East & Africa Market Value (USD Million) Forecast by End Use, 2021 to 2036
- Table 48: Middle East & Africa Market Value (USD Million) Forecast by Sales Channel, 2021 to 2036
List Of Figures
- Figure 1: Global Market Pricing Analysis
- Figure 2: Global Market Value (USD Million) Forecast 2021-2036
- Figure 3: Global Market Value Share and BPS Analysis by Motor Type, 2026 and 2036
- Figure 4: Global Market Y-o-Y Growth Comparison by Motor Type, 2026 to 2036
- Figure 5: Global Market Attractiveness Analysis by Motor Type
- Figure 6: Global Market Value Share and BPS Analysis by Power Rating, 2026 and 2036
- Figure 7: Global Market Y-o-Y Growth Comparison by Power Rating, 2026 to 2036
- Figure 8: Global Market Attractiveness Analysis by Power Rating
- Figure 9: Global Market Value Share and BPS Analysis by Application, 2026 and 2036
- Figure 10: Global Market Y-o-Y Growth Comparison by Application, 2026 to 2036
- Figure 11: Global Market Attractiveness Analysis by Application
- Figure 12: Global Market Value Share and BPS Analysis by End Use, 2026 and 2036
- Figure 13: Global Market Y-o-Y Growth Comparison by End Use, 2026 to 2036
- Figure 14: Global Market Attractiveness Analysis by End Use
- Figure 15: Global Market Value Share and BPS Analysis by Sales Channel, 2026 and 2036
- Figure 16: Global Market Y-o-Y Growth Comparison by Sales Channel, 2026 to 2036
- Figure 17: Global Market Attractiveness Analysis by Sales Channel
- Figure 18: Global Market Value (USD Million) Share and BPS Analysis by Region, 2026 and 2036
- Figure 19: Global Market Y-o-Y Growth Comparison by Region, 2026 to 2036
- Figure 20: Global Market Attractiveness Analysis by Region
- Figure 21: North America Market Incremental Dollar Opportunity, 2026 to 2036
- Figure 22: Latin America Market Incremental Dollar Opportunity, 2026 to 2036
- Figure 23: Western Europe Market Incremental Dollar Opportunity, 2026 to 2036
- Figure 24: Eastern Europe Market Incremental Dollar Opportunity, 2026 to 2036
- Figure 25: East Asia Market Incremental Dollar Opportunity, 2026 to 2036
- Figure 26: South Asia and Pacific Market Incremental Dollar Opportunity, 2026 to 2036
- Figure 27: Middle East & Africa Market Incremental Dollar Opportunity, 2026 to 2036
- Figure 28: North America Market Value Share and BPS Analysis by Country, 2026 and 2036
- Figure 29: North America Market Value Share and BPS Analysis by Motor Type, 2026 and 2036
- Figure 30: North America Market Y-o-Y Growth Comparison by Motor Type, 2026 to 2036
- Figure 31: North America Market Attractiveness Analysis by Motor Type
- Figure 32: North America Market Value Share and BPS Analysis by Power Rating, 2026 and 2036
- Figure 33: North America Market Y-o-Y Growth Comparison by Power Rating, 2026 to 2036
- Figure 34: North America Market Attractiveness Analysis by Power Rating
- Figure 35: North America Market Value Share and BPS Analysis by Application, 2026 and 2036
- Figure 36: North America Market Y-o-Y Growth Comparison by Application, 2026 to 2036
- Figure 37: North America Market Attractiveness Analysis by Application
- Figure 38: North America Market Value Share and BPS Analysis by End Use, 2026 and 2036
- Figure 39: North America Market Y-o-Y Growth Comparison by End Use, 2026 to 2036
- Figure 40: North America Market Attractiveness Analysis by End Use
- Figure 41: North America Market Value Share and BPS Analysis by Sales Channel, 2026 and 2036
- Figure 42: North America Market Y-o-Y Growth Comparison by Sales Channel, 2026 to 2036
- Figure 43: North America Market Attractiveness Analysis by Sales Channel
- Figure 44: Latin America Market Value Share and BPS Analysis by Country, 2026 and 2036
- Figure 45: Latin America Market Value Share and BPS Analysis by Motor Type, 2026 and 2036
- Figure 46: Latin America Market Y-o-Y Growth Comparison by Motor Type, 2026 to 2036
- Figure 47: Latin America Market Attractiveness Analysis by Motor Type
- Figure 48: Latin America Market Value Share and BPS Analysis by Power Rating, 2026 and 2036
- Figure 49: Latin America Market Y-o-Y Growth Comparison by Power Rating, 2026 to 2036
- Figure 50: Latin America Market Attractiveness Analysis by Power Rating
- Figure 51: Latin America Market Value Share and BPS Analysis by Application, 2026 and 2036
- Figure 52: Latin America Market Y-o-Y Growth Comparison by Application, 2026 to 2036
- Figure 53: Latin America Market Attractiveness Analysis by Application
- Figure 54: Latin America Market Value Share and BPS Analysis by End Use, 2026 and 2036
- Figure 55: Latin America Market Y-o-Y Growth Comparison by End Use, 2026 to 2036
- Figure 56: Latin America Market Attractiveness Analysis by End Use
- Figure 57: Latin America Market Value Share and BPS Analysis by Sales Channel, 2026 and 2036
- Figure 58: Latin America Market Y-o-Y Growth Comparison by Sales Channel, 2026 to 2036
- Figure 59: Latin America Market Attractiveness Analysis by Sales Channel
- Figure 60: Western Europe Market Value Share and BPS Analysis by Country, 2026 and 2036
- Figure 61: Western Europe Market Value Share and BPS Analysis by Motor Type, 2026 and 2036
- Figure 62: Western Europe Market Y-o-Y Growth Comparison by Motor Type, 2026 to 2036
- Figure 63: Western Europe Market Attractiveness Analysis by Motor Type
- Figure 64: Western Europe Market Value Share and BPS Analysis by Power Rating, 2026 and 2036
- Figure 65: Western Europe Market Y-o-Y Growth Comparison by Power Rating, 2026 to 2036
- Figure 66: Western Europe Market Attractiveness Analysis by Power Rating
- Figure 67: Western Europe Market Value Share and BPS Analysis by Application, 2026 and 2036
- Figure 68: Western Europe Market Y-o-Y Growth Comparison by Application, 2026 to 2036
- Figure 69: Western Europe Market Attractiveness Analysis by Application
- Figure 70: Western Europe Market Value Share and BPS Analysis by End Use, 2026 and 2036
- Figure 71: Western Europe Market Y-o-Y Growth Comparison by End Use, 2026 to 2036
- Figure 72: Western Europe Market Attractiveness Analysis by End Use
- Figure 73: Western Europe Market Value Share and BPS Analysis by Sales Channel, 2026 and 2036
- Figure 74: Western Europe Market Y-o-Y Growth Comparison by Sales Channel, 2026 to 2036
- Figure 75: Western Europe Market Attractiveness Analysis by Sales Channel
- Figure 76: Eastern Europe Market Value Share and BPS Analysis by Country, 2026 and 2036
- Figure 77: Eastern Europe Market Value Share and BPS Analysis by Motor Type, 2026 and 2036
- Figure 78: Eastern Europe Market Y-o-Y Growth Comparison by Motor Type, 2026 to 2036
- Figure 79: Eastern Europe Market Attractiveness Analysis by Motor Type
- Figure 80: Eastern Europe Market Value Share and BPS Analysis by Power Rating, 2026 and 2036
- Figure 81: Eastern Europe Market Y-o-Y Growth Comparison by Power Rating, 2026 to 2036
- Figure 82: Eastern Europe Market Attractiveness Analysis by Power Rating
- Figure 83: Eastern Europe Market Value Share and BPS Analysis by Application, 2026 and 2036
- Figure 84: Eastern Europe Market Y-o-Y Growth Comparison by Application, 2026 to 2036
- Figure 85: Eastern Europe Market Attractiveness Analysis by Application
- Figure 86: Eastern Europe Market Value Share and BPS Analysis by End Use, 2026 and 2036
- Figure 87: Eastern Europe Market Y-o-Y Growth Comparison by End Use, 2026 to 2036
- Figure 88: Eastern Europe Market Attractiveness Analysis by End Use
- Figure 89: Eastern Europe Market Value Share and BPS Analysis by Sales Channel, 2026 and 2036
- Figure 90: Eastern Europe Market Y-o-Y Growth Comparison by Sales Channel, 2026 to 2036
- Figure 91: Eastern Europe Market Attractiveness Analysis by Sales Channel
- Figure 92: East Asia Market Value Share and BPS Analysis by Country, 2026 and 2036
- Figure 93: East Asia Market Value Share and BPS Analysis by Motor Type, 2026 and 2036
- Figure 94: East Asia Market Y-o-Y Growth Comparison by Motor Type, 2026 to 2036
- Figure 95: East Asia Market Attractiveness Analysis by Motor Type
- Figure 96: East Asia Market Value Share and BPS Analysis by Power Rating, 2026 and 2036
- Figure 97: East Asia Market Y-o-Y Growth Comparison by Power Rating, 2026 to 2036
- Figure 98: East Asia Market Attractiveness Analysis by Power Rating
- Figure 99: East Asia Market Value Share and BPS Analysis by Application, 2026 and 2036
- Figure 100: East Asia Market Y-o-Y Growth Comparison by Application, 2026 to 2036
- Figure 101: East Asia Market Attractiveness Analysis by Application
- Figure 102: East Asia Market Value Share and BPS Analysis by End Use, 2026 and 2036
- Figure 103: East Asia Market Y-o-Y Growth Comparison by End Use, 2026 to 2036
- Figure 104: East Asia Market Attractiveness Analysis by End Use
- Figure 105: East Asia Market Value Share and BPS Analysis by Sales Channel, 2026 and 2036
- Figure 106: East Asia Market Y-o-Y Growth Comparison by Sales Channel, 2026 to 2036
- Figure 107: East Asia Market Attractiveness Analysis by Sales Channel
- Figure 108: South Asia and Pacific Market Value Share and BPS Analysis by Country, 2026 and 2036
- Figure 109: South Asia and Pacific Market Value Share and BPS Analysis by Motor Type, 2026 and 2036
- Figure 110: South Asia and Pacific Market Y-o-Y Growth Comparison by Motor Type, 2026 to 2036
- Figure 111: South Asia and Pacific Market Attractiveness Analysis by Motor Type
- Figure 112: South Asia and Pacific Market Value Share and BPS Analysis by Power Rating, 2026 and 2036
- Figure 113: South Asia and Pacific Market Y-o-Y Growth Comparison by Power Rating, 2026 to 2036
- Figure 114: South Asia and Pacific Market Attractiveness Analysis by Power Rating
- Figure 115: South Asia and Pacific Market Value Share and BPS Analysis by Application, 2026 and 2036
- Figure 116: South Asia and Pacific Market Y-o-Y Growth Comparison by Application, 2026 to 2036
- Figure 117: South Asia and Pacific Market Attractiveness Analysis by Application
- Figure 118: South Asia and Pacific Market Value Share and BPS Analysis by End Use, 2026 and 2036
- Figure 119: South Asia and Pacific Market Y-o-Y Growth Comparison by End Use, 2026 to 2036
- Figure 120: South Asia and Pacific Market Attractiveness Analysis by End Use
- Figure 121: South Asia and Pacific Market Value Share and BPS Analysis by Sales Channel, 2026 and 2036
- Figure 122: South Asia and Pacific Market Y-o-Y Growth Comparison by Sales Channel, 2026 to 2036
- Figure 123: South Asia and Pacific Market Attractiveness Analysis by Sales Channel
- Figure 124: Middle East & Africa Market Value Share and BPS Analysis by Country, 2026 and 2036
- Figure 125: Middle East & Africa Market Value Share and BPS Analysis by Motor Type, 2026 and 2036
- Figure 126: Middle East & Africa Market Y-o-Y Growth Comparison by Motor Type, 2026 to 2036
- Figure 127: Middle East & Africa Market Attractiveness Analysis by Motor Type
- Figure 128: Middle East & Africa Market Value Share and BPS Analysis by Power Rating, 2026 and 2036
- Figure 129: Middle East & Africa Market Y-o-Y Growth Comparison by Power Rating, 2026 to 2036
- Figure 130: Middle East & Africa Market Attractiveness Analysis by Power Rating
- Figure 131: Middle East & Africa Market Value Share and BPS Analysis by Application, 2026 and 2036
- Figure 132: Middle East & Africa Market Y-o-Y Growth Comparison by Application, 2026 to 2036
- Figure 133: Middle East & Africa Market Attractiveness Analysis by Application
- Figure 134: Middle East & Africa Market Value Share and BPS Analysis by End Use, 2026 and 2036
- Figure 135: Middle East & Africa Market Y-o-Y Growth Comparison by End Use, 2026 to 2036
- Figure 136: Middle East & Africa Market Attractiveness Analysis by End Use
- Figure 137: Middle East & Africa Market Value Share and BPS Analysis by Sales Channel, 2026 and 2036
- Figure 138: Middle East & Africa Market Y-o-Y Growth Comparison by Sales Channel, 2026 to 2036
- Figure 139: Middle East & Africa Market Attractiveness Analysis by Sales Channel
- Figure 140: Global Market - Tier Structure Analysis
- Figure 141: Global Market - Company Share Analysis