- Market Value (2025): USD 3866.5 Mn
- Estimated Value (2026): USD 4357.5 Mn
- Forecast Value (2036): USD 14403.8 Mn
- CAGR (2026-2036): 12.7%
What is the Life Sciences Quality Management Software Market forecast to be worth by 2036?
USD 4,357.5 million in 2026 to USD 14,403.8 million by 2036, at 12.7% CAGR.
- The life sciences quality management software market crossed a valuation of USD 3,866.5 million in 2025 as regulated companies expanded electronic quality programs.
- Demand is projected to increase from USD 4,357.5 million in 2026 to USD 14,403.8 million by 2036 across regulated quality and compliance operations.
- The market is forecast to record a 12.7% CAGR from 2026 to 2036 as quality teams standardize workflows across manufacturing sites and partner networks.
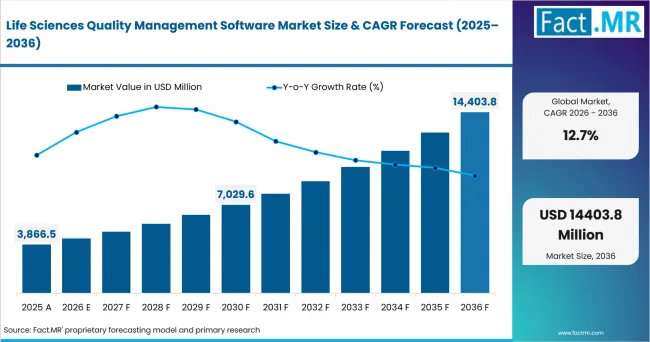
Life Sciences Quality Management Software Market Market Value Analysis | Source: Fact.MR
What are the defining numbers behind Life Sciences Quality Management Software Market growth?
USD 10,046.3 million absolute opportunity by 2036, led by Software and Cloud deployment alongside BFSI end-use demand.
- Demand Drivers in the Market
- Quality assurance directors need connected deviation and CAPA workflows because inspection evidence must remain traceable across sites and product lifecycles.
- Validation managers need controlled configuration and release documentation supported by audit trails that shorten qualification work without weakening evidence quality.
- Manufacturing quality teams need standardized workflows owing to recurring handoffs among plants and contract partners that create inconsistent records across legacy systems.
- Regulatory operations leaders need searchable quality histories while product portfolios expand across jurisdictions that apply different inspection and documentation expectations.
- Key Segments Analyzed
- By Component: Software is expected to account for 42.1% share in 2026, driven by recurring use of document control and quality-event workflows.
- By Deployment: Cloud is projected to garner 42.8% share in 2026, supported by multi-site access and controlled software updates across regulated organizations.
- By Organization Size: SME is anticipated to record 42.8% share in 2026, owing to demand for packaged workflows and lower internal administration requirements.
- By Application: Workflow automation is estimated to hold 45.8% share in 2026, attributable to deviation routing and corrective-action coordination across quality functions.
- By End Use: BFSI is forecast to capture 38.2% share in 2026, reinforced by audit intensity and recurring demand for controlled policy and remediation records.
- Analyst Opinion at Fact.MR
- Shambhu Nath Jha, Senior Analyst at Fact.MR states, “Life sciences quality software is drawing attention because validation evidence and workflow traceability now shape buying decisions together. Adoption is expected to favor platforms that connect quality events without requiring extensive custom code. Providers should combine configurable workflows and controlled releases with practical migration support that preserves historical quality-event relationships.”
- Strategic Implications
- Quality executives should map deviation and CAPA dependencies before selecting modules so implementation priorities reflect actual inspection and cycle-time exposure.
- Software providers should package validation evidence around each release so regulated customers spend less effort rebuilding proof after routine platform changes.
- Contract manufacturers should define external collaboration rules early so sponsor records and plant records remain synchronized during investigations and change control.
- Implementation partners should test migration logic against closed quality events so historical relationships remain searchable after legacy repositories are retired.
Growing regulatory complexity is accelerating the adoption of software platforms that unify quality assurance and release processes. Veeva Systems detailed Quality Cloud product advances in June 2025, including Veeva LIMS and Veeva Batch Release for European customers. The company also reported that customers using its software-based validation workflow reduced effort by up to 50%. The development reflects a market shift toward connected QA and laboratory workflows that preserve controlled evidence across releases.
India is projected to record 14.5% CAGR during the forecast period, driven by manufacturing depth and rising need to digitize compliance workflows across regulated producers. China is estimated to post 13.8% CAGR between 2026 and 2036, supported by expanding clinical development activity and local quality-system modernization. Australia is anticipated to register 12.5% CAGR across the forecast horizon, owing to structured therapeutic-goods oversight and smaller teams seeking standardized cloud workflows. The United Kingdom is forecast to achieve 12.2% CAGR by 2036, reinforced by regulatory service modernization and continued demand for inspection-ready records. The United States is expected to record 12.0% CAGR over the assessment period, shaped by QMSR implementation and broader quality-software investment across the pharmaceuticals market.
How does the Life Sciences Quality Management Software Market break down by segment?
Software is projected to account for 42.1% share; Cloud deployment is estimated to garner 42.8% share within the 2026 market structure.
Which Component category is expected to account for the primary share?
Software is estimated to represent around 42.1% share in 2026
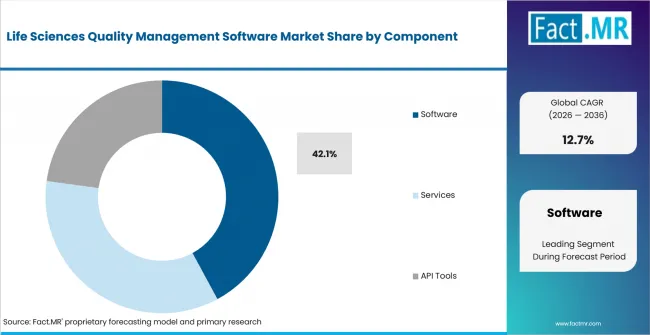
Life Sciences Quality Management Software Market Analysis By Component | Source: Fact.MR
Software is forecast to represent 42.1% share in 2026 because regulated teams need persistent control over quality events and records. Services support migration and validation work where legacy process maps remain inconsistent across regulated sites and global portfolios. API Tools support integrations with laboratory and manufacturing systems that feed controlled evidence into quality workflows. The component mix favors software platforms that maintain configuration control while allowing structured interfaces with surrounding systems. In December 2025, Arena Solutions introduced an AI Engine for PLM and QMS workflows that automates document review and file comparison.
How does Deployment shape adoption patterns?
Cloud is estimated to garner 42.8% share in 2026
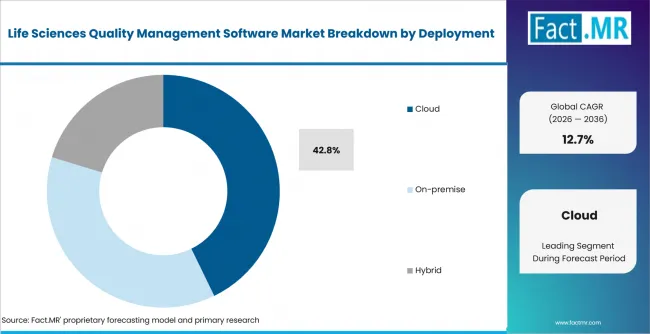
Life Sciences Quality Management Software Market Analysis By Deployment | Source: Fact.MR
Cloud deployment is anticipated to capture 42.8% share in 2026 because regulated organizations need common workflows across plants and external partners. On-premise systems remain relevant where infrastructure policies require local control over validated environments and release governance. Hybrid deployment supports phased migration when teams retain selected legacy repositories while moving quality processes to hosted platforms. In February 2026, Eurostat reported that 53% of EU businesses bought paid cloud services during 2025 for enterprise operations and infrastructure needs. That broader adoption pattern supports investment in regulated cloud architectures and adjacent lab workflow solutions.
What supports SME demand within Organization Size?
SME is anticipated to record 42.8% share in 2026
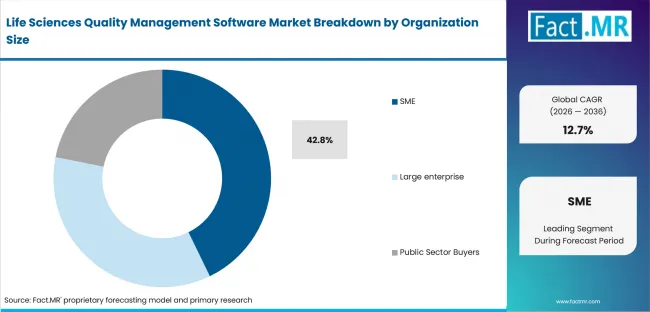
Life Sciences Quality Management Software Market Analysis By Organization Size | Source: Fact.MR
The SME category is expected to hold 42.8% share in 2026 because smaller organizations often need structured quality processes before building large internal IT teams. Large enterprise users favor platform consolidation across business units and regions that manage regulated portfolios and shared quality processes. Public Sector Buyers use quality applications for controlled procedures and regulated laboratory activities where audit evidence must remain accessible. In April 2026, Eurostat reported that 52% of EU SMEs bought cloud services during 2025 for recurring enterprise operations and infrastructure needs. The adoption base supports simpler deployment models that reduce infrastructure administration for smaller regulated organizations.
Why does Workflow automation account for the primary Application share?
Workflow automation is forecast to capture 45.8% share in 2026
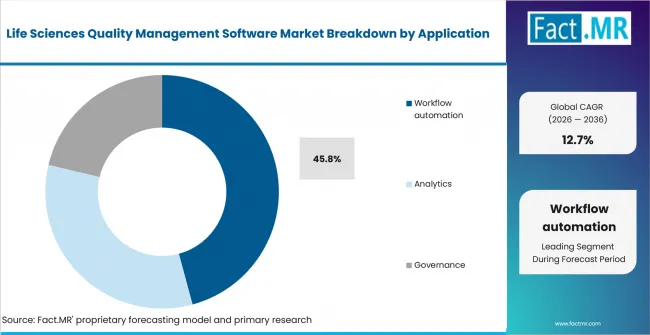
Life Sciences Quality Management Software Market Analysis By Application | Source: Fact.MR
Workflow automation is estimated to represent 45.8% share in 2026 because deviation and CAPA processes create frequent cross-functional handoffs. Analytics follows where quality teams compare recurrence patterns and closure times across sites and product lines under common governance. Governance applications support policy control and approval accountability across organizations that manage several sites and external operating partners. In June 2025, the European Medicines Agency reported receiving 395 suspected quality-defect notifications during 2024. The workload illustrates why structured routing and escalation remain central to quality software selection in regulated environments.
How does BFSI shape End Use demand?
BFSI is expected to represent 38.2% share in 2026, reinforced by audit intensity and recurring demand for controlled policy and remediation records.
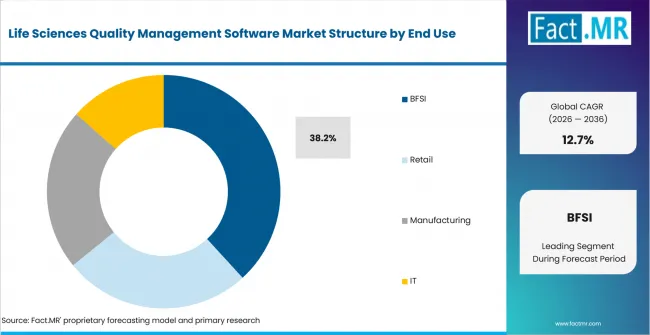
Life Sciences Quality Management Software Market Analysis By End Use | Source: Fact.MR
BFSI is projected to account for 38.2% share in 2026 because regulated institutions manage policy changes and remediation evidence across distributed operations. Retail follows where quality teams coordinate supplier records and corrective actions across large vendor networks. Manufacturing users need nonconformance and CAPA workflows connected to plant records and supplier quality processes. IT organizations use governance tools for controlled change management and audit evidence across distributed technology operations and service teams. In August 2025, the FDIC published CRA examination ratings covering institutions evaluated during May 2025. Ongoing supervisory review keeps evidence traceability central to BFSI compliance workflows and increases demand for searchable remediation records.
What is accelerating Life Sciences Quality Management Software Market adoption, and what is holding it back?
Regulatory workflow pressure drives adoption, while validation burden restrains implementation across regulated life sciences organizations.
Drivers Impact Analysis
|
Driver |
(~) % Impact on CAGR |
Geographic Relevance |
Impact Timeline |
|---|---|---|---|
|
Regulatory harmonization and inspection change |
+1.6% |
North America and Europe |
Short term (<= 2 years) |
|
Inspection workload and evidence readiness |
+1.2% |
Global regulated markets |
Medium term (2-4 years) |
|
CAPA and deviation standardization |
+0.9% |
North America and Asia Pacific |
Medium term (2-4 years) |
|
External partner quality collaboration |
+0.7% |
Global CDMO networks |
Long term (>= 4 years) |
|
Cloud operating model adoption |
+0.5% |
Europe and Asia Pacific |
Long term (>= 4 years) |
Source: Fact.MR analysis. Updated Jul 10, 2026
- Regulatory inspection pressure: In July 2026, the U.S. Food and Drug Administration reported 1,248 drug quality assurance inspections during FY2025. Quality teams need consistent evidence across documents and investigations before inspectors request it during planned or for-cause reviews. Software adoption is expected to favor platforms that keep controlled procedures and evidence relationships visible during inspection preparation.
- Inspection workload: Published in June 2025, EMA’s annual report recorded 210 GMP inspections during 2024 under the centralized authorization procedure. Quality teams must assemble consistent evidence across documents and investigations before inspectors request it during planned or triggered regulatory reviews. Demand is projected to expand where platforms reduce manual reconciliation between site records and enterprise quality histories.
- CAPA discipline: EMA reported in June 2025 that 10 GMP inspections conducted during 2024 led to non-compliance statements. Each adverse finding increases scrutiny of investigation quality and corrective-action follow-up across affected operations and connected manufacturing sites. Adoption is anticipated to broaden where workflow controls make ownership and effectiveness checks easier to demonstrate.
- Partner collaboration: Sponsors and contract manufacturers exchange deviations and change controls across organizational boundaries that often use different process conventions. Shared workflows reduce duplicate entry and delayed acknowledgement during investigation handoffs between sponsors and contract manufacturing quality organizations. Adoption is estimated to favor platforms that separate partner access while preserving an auditable event history.
- Cloud operating models: Multi-site quality organizations need common releases and standardized controls without separate local infrastructure projects at every facility. Hosted platforms shift more update coordination toward providers while regulated customers retain validation responsibilities for intended use and configured workflows. Cloud use is forecast to expand where vendors provide clear release evidence and predictable configuration governance.
Opportunity Impact Analysis
| Opportunity | (~) % Impact on CAGR | Geographic Relevance | Impact Timeline |
|---|---|---|---|
| AI-assisted quality review | +0.8% | North America and Europe | Medium term (2-4 years) |
| Cross-system quality integration | +0.6% | Global enterprise accounts | Medium term (2-4 years) |
| Supplier quality collaboration | +0.5% | Asia Pacific and North America | Long term (>= 4 years) |
| Pre-validated deployment packages | +0.4% | SME-heavy life sciences hubs | Short term (<= 2 years) |
Source: Fact.MR analysis. Updated Jul 10, 2026
- AI-assisted review: Quality teams spend substantial time finding related events and reviewing repetitive record content before decisions move forward. Controlled assistance creates room for search and summarization tools that keep human approval inside regulated workflows. Opportunity is expected to concentrate on functions that preserve source links and restrict unsupported conclusions.
- Cross-system integration: In June 2026, MHRA reported 99% performance during May 2026 for initial clinical authorization and investigation applications against statutory timelines. Regulated organizations increasingly need quality systems that exchange status data with clinical and regulatory workflows. Opportunity is projected to expand for integration patterns that preserve traceability while limiting duplicate records.
- Supplier quality collaboration: EMA’s June 2025 annual report recorded 2,110 GMP certificates issued during 2024 across the reported inspection framework. Large manufacturing networks require consistent qualification and issue follow-up across suppliers that operate under different internal systems. Opportunity is anticipated to favor controlled portals and shared event models that reduce email-based evidence exchange.
- Pre-validated deployment: Smaller life sciences firms often lack dedicated validation teams for extensive platform customization and frequent requalification work. Packaged workflows and documented release controls reduce the internal effort required before productive use across smaller regulated life sciences organizations. Opportunity is estimated to widen for providers that keep configuration choices visible and limit unnecessary implementation branching.
Restraints Impact Analysis
| Restraint | (~) % Impact on CAGR | Geographic Relevance | Impact Timeline |
|---|---|---|---|
| Computer system validation burden | -0.7% | Global regulated markets | Short term (<= 2 years) |
| Legacy data migration risk | -0.5% | North America and Europe | Medium term (2-4 years) |
| Integration and master-data inconsistency | -0.4% | Global enterprise accounts | Medium term (2-4 years) |
| Data residency and access governance | -0.3% | Europe and Asia Pacific | Long term (>= 4 years) |
Source: Fact.MR analysis. Updated Jul 10, 2026
- Validation burden: Regulated organizations must prove that configured workflows perform as intended across intended use cases and controlled changes. Heavy customization increases test scope and makes later upgrades harder to assess across regulated configurations and controlled release cycles. Adoption is forecast to remain selective where providers cannot supply usable validation documentation for each release.
- Migration risk: Historical deviations and CAPA records often contain attachments or relationships that do not map cleanly into a new platform. Missing links weaken investigation context after cutover and increase review work during inspections that depend on historical event relationships. Adoption is expected to slow where migration plans focus on file transfer without preserving event relationships.
- Integration inconsistency: Quality systems depend on identifiers from manufacturing and laboratory applications that are not always governed consistently across sites. Duplicate suppliers or product codes create reporting conflicts after systems connect across sites that use inconsistent master-data ownership rules. Implementation is projected to take longer where master-data ownership remains unclear before interface design begins.
- Access governance: Global organizations must control data location and role permissions across affiliates and external partners that operate under different policies. Broad access models create unnecessary exposure while overly narrow rules disrupt investigation collaboration between internal quality teams and external partners. Deployment is anticipated to favor architectures that separate records logically and document permission changes clearly.
Which countries are scaling Life Sciences Quality Management Software fastest?
India 14.5%; China 13.8%; Australia 12.5%; United Kingdom 12.2%; United States 12.0% across the 2026 to 2036 outlook.
.webp "Top Country Growth Comparison Life Sciences Quality Management Software Market Cagr (2026 2036)")
Top Country Growth Comparison Life Sciences Quality Management Software Market Cagr (2026 2036) | Source: Fact.MR
Life Sciences Quality Management Software Market is segmented into North America, Europe, Asia Pacific, Latin America, and the Middle East & Africa.
| Country | CAGR |
|---|---|
| India | 14.5% |
| China | 13.8% |
| Australia | 12.5% |
| United Kingdom | 12.2% |
| United States | 12.0% |
Source: Fact.MR analysis. Updated Jul 10, 2026
What is powering India’s expansion?
14.5% CAGR, driven by manufacturing depth and broader quality-system digitization across export-oriented pharmaceutical operations.
India combines a dense manufacturing base with rising quality-system requirements across domestic and export programs. The Press Information Bureau reported in March 2026 that 10,500 pharmaceutical manufacturing units operate across the country. Demand is projected to record 14.5% CAGR during the forecast period as companies standardize evidence across plants and regulated customer programs.
How is China scaling compliance software demand?
13.8% CAGR, supported by clinical development volume and local quality-process modernization across life sciences organizations.
China’s National Medical Products Administration reported in July 2025 that 4,900 drug clinical trials were registered during 2024. The market is estimated to post 13.8% CAGR between 2026 and 2036 as organizations connect trial-quality records with manufacturing quality controls. Clinical development activity increases demand for controlled records that remain consistent across sponsors and research sites.
What supports the Australia outlook?
12.5% CAGR, owing to structured therapeutic-goods oversight and demand for simpler validated workflows among smaller quality teams.
Australia’s regulated life sciences base requires documented processes and transparent oversight across therapeutic goods operations. In May 2026, the TGA reported on 31 focus areas tied to its 2024-25 regulatory objectives and oversight work. Market is anticipated to register 12.5% CAGR across the forecast horizon as quality teams seek standardized records without heavy local infrastructure administration.
What underpins United Kingdom growth?
12.2% CAGR, reinforced by regulatory service modernization and continuing demand for inspection-ready records across medicines and device operations.
In June 2026, MHRA reported that 96% of initial spontaneous adverse-incident reports met its target window during May 2026. Demand is forecast to achieve 12.2% CAGR by 2036 as quality teams connect event intake and investigation records more closely. Regulatory service modernization is raising expectations for timely submissions and accessible supporting evidence across UK life sciences organizations.
How is the United States market developing?
12.0% CAGR, shaped by QMSR implementation and continuing replacement of disconnected quality repositories across regulated manufacturers.
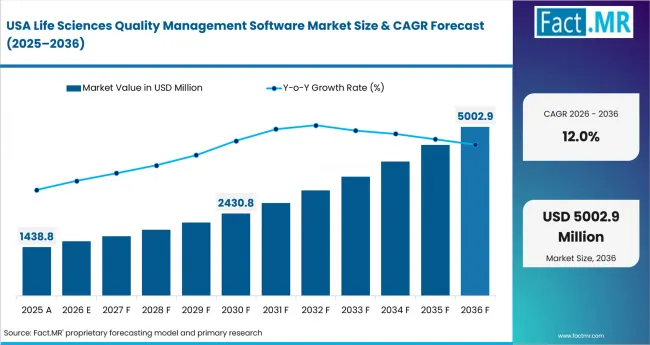
Life Sciences Quality Management Software Market Country Value Analysis | Source: Fact.MR
Medical device quality teams are adapting procedures and inspection preparation to the FDA’s current regulatory framework. In February 2026, the FDA confirmed that QMSR incorporates ISO 13485:2016 into revised quality-system requirements for manufacturers selling regulated devices in the country. The market is expected to record 12.0% CAGR over the assessment period as manufacturers align controlled documents and workflow evidence with the updated framework.
Who leads the Life Sciences Quality Management Software Market?
Veeva Systems and MasterControl lead direct life sciences quality coverage, while Sparta Systems (Honeywell) and ETQ Reliance (Octave) strengthen enterprise QMS breadth.
Key players such as Veeva Systems focus on Quality Cloud applications that connect QMS with document control and training workflows. MasterControl links quality and manufacturing processes through Quality Excellence while shared master-data controls support consistent records across regulated operating teams. Sparta Systems remains active within Honeywell through TrackWise and TrackWise Digital for enterprise quality workflows across regulated manufacturing networks. These providers compete for regulated enterprise programs where validation support and controlled releases influence procurement decisions across multi-site implementations.
ETQ Reliance moved with Hexagon’s software businesses into Octave after the separation completed in May 2026. The Reliance portfolio continues to support life sciences compliance workflows across quality events and controlled record processes for regulated organizations. Arena Solutions operates within PTC and connects product records directly with quality processes for regulated product teams. Qualio targets smaller life sciences firms through cloud QMS and compliance tools that support lean quality teams during company expansion. Greenlight Guru focuses on medical-device teams that need connected QMS and design-control workflows across development and commercialization. Competition is expected to center on configuration depth and implementation speed across the forecast period.
Which companies are the key providers?
Some of the key players profiled include Veeva Systems, MasterControl, Sparta Systems (Honeywell), ETQ Reliance (Octave), Arena Solutions (PTC), Qualio, Greenlight Guru.
- Veeva Systems
- MasterControl
- Sparta Systems (Honeywell)
- ETQ Reliance (Hexagon)
- Arena Solutions (PTC)
- Qualio
- Greenlight Guru
Bibliography
- Arena Solutions. (2025, December 9). PTC launches Arena AI Engine to accelerate intelligent automation across PLM and QMS workflows. Arena Solutions.
- European Medicines Agency. (2025, June 10). 2024 annual report of the European Medicines Agency. European Medicines Agency.
- Eurostat. (2026, February 3). 53% EU enterprises used paid cloud services in 2025. European Commission.
- Eurostat. (2026, April 23). Digitalisation in Europe – 2026 edition. European Commission.
- Greenlight Guru. (2026, April 28). Best QMS software for medical devices. Greenlight Guru.
- Hexagon. (2025, June 17). Hexagon’s software spin-off is named Octave: now an independent public company since May 2026. Hexagon.
- Honeywell. (2026, May 13). 2026 Honeywell Life Sciences APAC Tour | India. Honeywell.
- MasterControl. (2026, May 21). One Source of Truth: How MasterControl Catalog Transforms Master Data Management for Life Sciences. MasterControl.
- Medicines and Healthcare products Regulatory Agency. (2026, June 24). MHRA Performance Data. GOV.UK.
- National Medical Products Administration. (2025, July 21). 2024年度药物临床试验登记达4900项. National Medical Products Administration.
- Press Information Bureau. (2026, March 21). India’s Pharmaceuticals in Global Healthcare. Government of India.
- Qualio. (2025, December 2). Complete guide to computer system validation in 2026. Qualio.
- Therapeutic Goods Administration. (2026, May 26). Therapeutic Goods Administration Performance Report - 2024-25. Australian Government Department of Health, Disability and Ageing.
- U.S. Food and Drug Administration. (2026, February 2). Quality Management System Regulation (QMSR). U.S. Food and Drug Administration.
- Veeva Systems. (2025, June 25). Quality Zone Highlights: AI Comes to Veeva Quality Cloud, Enhanced Industry Collaboration, Plus Other Advances. Veeva Systems.
- U.S. Food and Drug Administration. (2026, July). Report on the State of Pharmaceutical Quality FY2025. U.S. Food and Drug Administration.
This Report Addresses
- The report provides strategic intelligence on Component and Deployment choices that shape regulated quality-system procurement and implementation planning.
- Segment analysis covers Software and Cloud deployment and also tracks SME demand and Workflow automation alongside the BFSI end-use category across the segmentation framework.
- Regional outlook evaluates India and China alongside Australia while the United Kingdom and United States complete the country growth comparison.
- Competitive analysis profiles Veeva Systems and MasterControl alongside Sparta Systems and ETQ Reliance across enterprise quality-management capabilities. It also evaluates Arena Solutions and Qualio together with Greenlight Guru across regulated product and deployment workflows.
- Component assessment covers Software and Services together with API Tools that connect quality workflows to surrounding regulated applications.
- Application assessment covers Workflow automation and Analytics alongside Governance functions used for oversight and compliance evidence management. End-use analysis follows BFSI and Retail together with Manufacturing and IT across sector classification for demand assessment.
- The forecast is supported by official regulator review and provider checks together with portfolio mapping and market-specific adoption analysis.
What does the Life Sciences Quality Management Software Market cover?
Cloud QMS and on-premise systems support hybrid deployments and controlled compliance workflows across regulated organizations and distributed operating teams.
The market covers software and related services that manage quality events and controlled documents across regulated life sciences operations. Coverage includes workflow automation and analytics alongside governance functions that support audit evidence and corrective-action accountability.
The market differs from broad enterprise content management because inclusion requires direct support for regulated quality processes and traceable approvals. General collaboration software and standalone business intelligence tools remain outside the boundary unless configured and sold specifically for life sciences quality management.
What is included in the scope?
Quality management software used across regulated operations where controlled workflows and audit evidence support quality assurance and compliance oversight.
Coverage includes Software and Services together with API Tools used to connect quality platforms with surrounding regulated systems. Deployment analysis spans Cloud and On-premise environments while Hybrid models capture phased migration or split-control architectures. Organization coverage includes the SME and Large enterprise categories together with Public Sector Buyers across regulated operating environments. Application coverage addresses Workflow automation and Analytics alongside Governance functions used to control evidence across regulated operating processes. End-use coverage follows BFSI and Retail together with Manufacturing and IT where controlled records support audit response and corrective-action accountability.
What is excluded from the scope?
General enterprise content management and standalone business analytics tools remain outside the market scope unless they provide dedicated quality workflows and controlled evidence handling.
Standalone laboratory instruments and manufacturing execution systems are excluded when they do not provide a dedicated quality management layer. Generic project management and document-sharing products are also outside scope unless their commercial offering includes controlled life sciences QMS workflows and audit-ready evidence handling.
How was the analysis built?
120+ sources, 40+ company portfolios, 25+ countries, 20+ interviews.
- Primary Research:
- Primary research includes interviews with life sciences quality management software providers, pharmaceutical quality leaders, regulatory affairs specialists and quality assurance managers. It also includes input from biotechnology companies, medical device manufacturers, validation consultants and compliance teams involved in quality system deployment and regulatory readiness programs.
- Desk Research:
- Desk research reviews life sciences industry statistics, regulatory guidance, quality management software portfolios, company product pages and technology adoption reports. Industry publications, provider announcements, compliance frameworks and digital quality transformation initiatives are also assessed to evaluate market trends and competitive positioning.
- Market-Sizing and Forecasting:
- Forecasting uses pharmaceutical and biotechnology spending trends, quality system modernization activity, regulatory compliance requirements, cloud software adoption and enterprise digital transformation investments across major regions. Models consider demand for document management, CAPA, audit management, training management, quality event tracking and validation solutions influencing market growth.
- Data Validation and Update Cycle:
- Forecasts are validated through provider checks and industry interviews that test assumptions on software adoption, compliance priorities and quality management investment trends. Portfolio mapping, end-user assessment and stakeholder feedback help confirm market direction, while ongoing reviews of regulatory updates, product launches and technology developments support forecast updates.
Segmentation
What is the report’s scope and coverage?
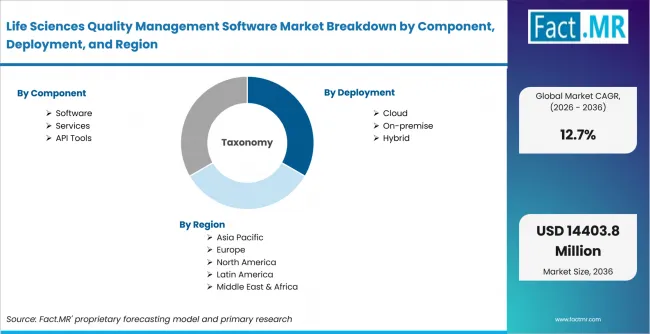
Life Sciences Quality Management Software Market Breakdown By Component, Deployment, And Region | Source: Fact.MR
| Attribute | Details |
|---|---|
| Quantitative Units | USD Million |
| Market Definition | Software and related services used to manage controlled quality processes, compliance records, quality events and audit evidence across regulated life sciences organizations. |
| Component | Software; Services; API Tools |
| Deployment | Cloud; On-premise; Hybrid |
| Organization Size | SME; Large enterprise; Public Sector Buyers |
| Application | Workflow automation; Analytics; Governance |
| End Use | BFSI; Retail; Manufacturing; IT |
| Regions Covered | North America; Europe; Asia Pacific; Latin America; Middle East and Africa |
| Countries Covered | United States; Canada; Germany; United Kingdom; France; Italy; Spain; India; China; Japan; South Korea; Australia; Brazil; Argentina; Mexico; Chile; UAE; Saudi Arabia; South Africa |
| Key Companies Profiled | Veeva Systems; MasterControl; Sparta Systems (Honeywell); ETQ Reliance (Octave); Arena Solutions (PTC); Qualio; Greenlight Guru |
| Forecast Period | 2026 to 2036 |
| Approach | Hybrid top-down and bottom-up approach using regulated site activity; quality-event workload; cloud adoption; platform penetration; replacement cycles; validation effort and provider portfolio mapping |
Source: Fact.MR analysis. Updated Jul 10, 2026
How is the market segmented?
-
By Component:
- Software
- Services
- API Tools
-
By Deployment:
- Cloud
- On-premise
- Hybrid
-
By Organization Size:
- SME
- Large enterprise
- Public Sector Buyers
-
By Application:
- Workflow automation
- Analytics
- Governance
-
By End Use:
- BFSI
- Retail
- Manufacturing
- IT
-
By Region:
- North America
- United States
- Canada
- Europe
- Germany
- United Kingdom
- France
- Italy
- Spain
- Asia Pacific
- India
- China
- Japan
- South Korea
- Australia
- Latin America
- Brazil
- Argentina
- Mexico
- Chile
- Middle East & Africa
- UAE
- Saudi Arabia
- South Africa
- North America
Frequently Asked Questions
How is Software positioned within the Life Sciences Quality Management Software Market?
What role does Cloud play in the Life Sciences Quality Management Software Market?
How prominent are SMEs in the Life Sciences Quality Management Software Market?
What contribution does Workflow Automation make to application demand?
How are BFSI organizations represented in the Life Sciences Quality Management Software Market?
Which country shows notable growth potential in the Life Sciences Quality Management Software Market?
How is the Life Sciences Quality Management Software Market expected to develop in China?
What outlook is anticipated for Australia in the Life Sciences Quality Management Software Market?
How is demand projected to evolve in the United Kingdom?
What trend characterizes the United States Life Sciences Quality Management Software Market?
What factor primarily supports software adoption?
Which challenge continues to influence software implementation?
Why does Cloud remain important in the Life Sciences Quality Management Software Market?
What supports BFSI participation in the Life Sciences Quality Management Software Market?
Who worked on this report


Preview the report firsthand - request a free sample
Free SampleGet the brochure for pricing and purchase details
Download PDF