Proliferative Vitreoretinopathy Market Size, Share, Growth and Forecast (2026 - 2036)

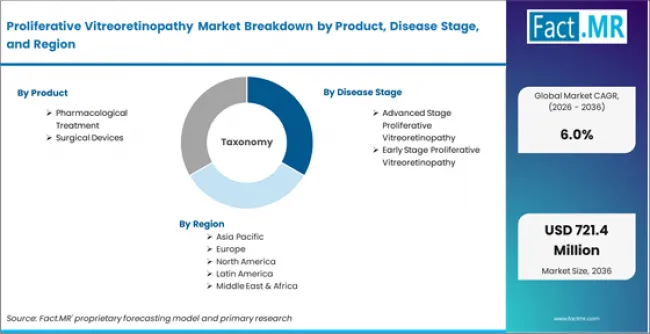
Proliferative Vitreoretinopathy Market is segmented by Product (Pharmacological Treatment, Surgical Devices), Disease Stage (Advanced Stage Proliferative Vitreoretinopathy, Early Stage Proliferative Vitreoretinopathy), Treatment Approach (Surgical Management, Medical Management, Adjunctive Therapy), and Region, with forecasts covering the period from 2026 to 2036.

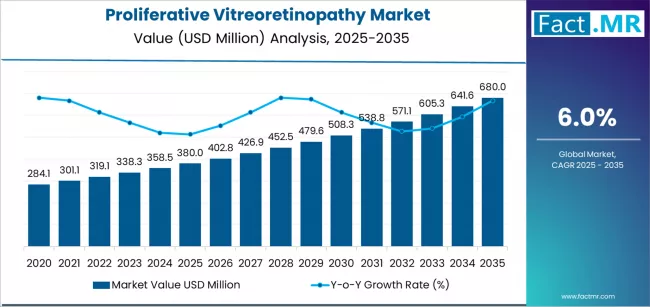
According to Fact.MR estimates, the global proliferative vitreoretinopathy Market was valued at USD 380.0 million in 2025. The market is projected to reach USD 402.8 million in 2026 and is expected to grow to USD 721.4 million by 2036, expanding at a CAGR of 6.0%. Pharmacological Treatment is anticipated to account for 38.9% of the product segment in 2026, while Advanced Stage Proliferative Vitreoretinopathy is expected to remain the leading application with around 42.6% share.

Proliferative Vitreoretinopathy Market Analysis and Forecast by Fact.MR

  • The global proliferative vitreoretinopathy (PVR) market is estimated at US$ 380.0 million in 2025 and has been forecast to expand at a CAGR of 6.0% to reach US$ 721.4 million by 2036.
  • PVR is a sight-threatening complication of retinal detachment and vitreoretinal surgery characterized by membrane formation and retinal contraction that leads to re-detachment.
  • Management combines surgical intervention through pars plana vitrectomy and membrane peeling with pharmacological therapy using anti-inflammatory, anti-proliferative, and anti-VEGF agents.
  • Surgical management represents the largest treatment approach, with advanced-stage PVR (Grade C and D) accounting for the majority of clinical and market activity.
  • Hospitals and retina specialty clinics are the primary treatment settings.
Proliferative Vitreoretinopathy Market  Value Analysis

Summary of the Proliferative Vitreoretinopathy Market

  • Market Snapshot
    • In 2025, the global Proliferative Vitreoretinopathy Market was valued at approximately USD 380.0 million.
    • The market is estimated to reach USD 402.8 million in 2026 and is projected to attain USD 721.4 million by 2036.
    • The proliferative vitreoretinopathy market is likely to expand at a CAGR of 6.0% during the forecast period.
    • The market is anticipated to create an absolute dollar opportunity of USD 318.6 million between 2026 and 2036.
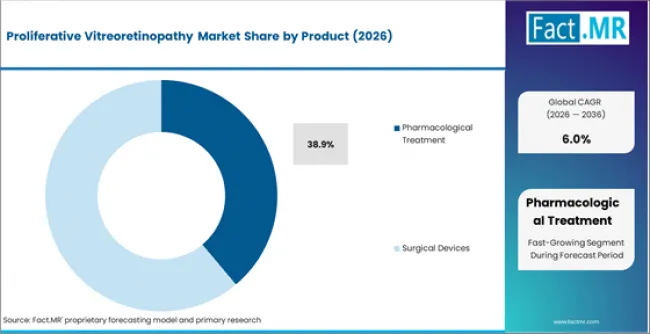
    • Pharmacological Treatment accounts for 38.9% of product share in 2026.
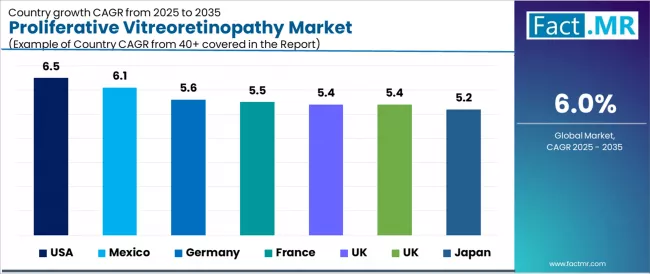
    • USA (6.5%) and Mexico (6.1%) are the key growth markets during the forecast period.
  • Demand and Growth Drivers
    • Rising retinal detachment incidence linked to aging populations, myopia prevalence, and post-cataract surgery complications is expanding the pool of patients at risk for PVR development.
    • Vitrectomy technique refinement, including micro-incision gauge systems and improved visualization, is improving surgical outcomes and expanding the treatable PVR patient base.
    • Anti-proliferative and anti-inflammatory drug development targeting PVR-specific cellular pathways is creating new pharmacological intervention options beyond supportive anti-VEGF therapy.
    • Optical coherence tomography (OCT) integration into vitreoretinal surgical workflows is improving intraoperative visualization and post-surgical PVR monitoring.
    • Growing retina subspecialty training programs globally are expanding the number of surgeons capable of managing complex PVR cases that require membrane peeling and repeat vitrectomy.
  • Product and Segment View
    • Pharmacological Treatment accounts for 38.9% of the product segment in 2026, supported by strong installed base and continued procurement across primary end use channels.
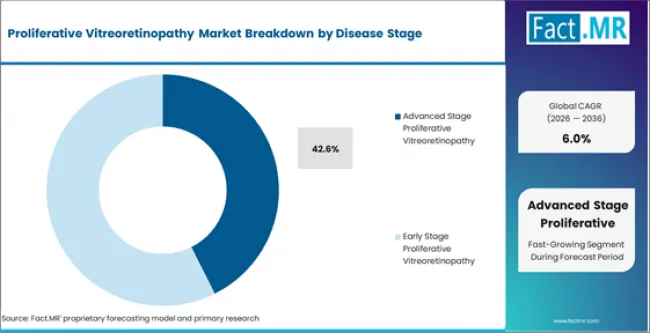
    • Advanced Stage Proliferative Vitreoretinopathy accounts for 42.6% of the disease stage segment in 2026, reflecting concentrated demand across established application areas.
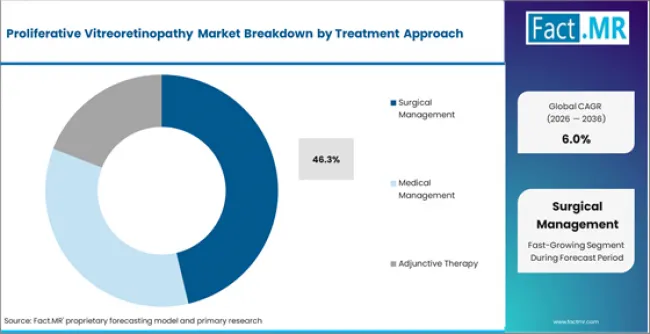
    • Surgical Management accounts for 46.3% of the treatment approach segment in 2026, with adoption rising across both developed and emerging markets.
    • Key segmentation includes:
      • Product: Pharmacological Treatment, Surgical Devices
      • Disease Stage: Advanced Stage Proliferative Vitreoretinopathy, Early Stage Proliferative Vitreoretinopathy
      • Treatment Approach: Surgical Management, Medical Management, Adjunctive Therapy
      • End Use: Hospitals, Ophthalmic Clinics, Academic and Research Institutes
    • These systems enable:
      • Targeted procurement and specification alignment across buyer segments
      • Performance benchmarking across product and application categories
      • Regional demand mapping across 30 plus countries
  • Geography and Competitive Outlook
    • North America accounts for a large share of global demand, supported by established procurement channels and a mature buyer base.
    • Europe shows stable demand patterns, with Germany (5.6%) contributing through regulatory compliance and institutional procurement for proliferative vitreoretinopathy products.
    • Asia Pacific demand is led by South Korea (5.4%) and Japan (5.2%).
    • USA (6.5%) and Mexico (6.1%) are the fastest growing country markets during the forecast period.
    • Leading companies in this market include F. Hoffmann-La Roche Ltd, Novartis AG, Bayer AG, Regeneron Pharmaceuticals, Inc., Allergan plc (AbbVie Inc.).
  • Analyst Opinion
    • Shambhu Nath Jha, Principal Consultant at Fact.MR, says 'The PVR market is a specialized segment within vitreoretinal disease management where unmet clinical need remains high and current treatment options are limited to surgical intervention supplemented by off-label pharmacotherapy. Market growth depends on three factors: retinal detachment incidence trends, vitreoretinal surgery access expansion in emerging markets, and pharmacological pipeline progress toward PVR-specific approved therapies. Roche and Novartis lead through their broad retinal disease portfolios, but the PVR-specific pipeline is still nascent, and successful drug development would transform the market from a primarily surgical category to a combined surgical-pharmacological treatment paradigm.'

Key Growth Drivers, Constraints, and Opportunities
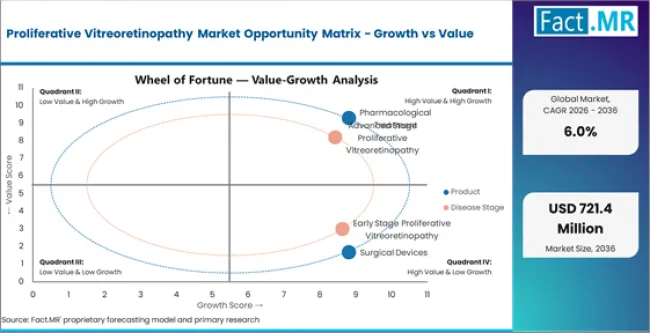
Proliferative Vitreoretinopathy Market Opportunity Matrix Growth Vs Value

Key Factors Driving Growth

  • Rising retinal detachment incidence linked to aging populations, myopia prevalence, and post-cataract surgery complications is expanding the pool of patients at risk for PVR development.
  • Vitrectomy technique refinement, including micro-incision gauge systems and improved visualization, is improving surgical outcomes and expanding the treatable PVR patient base.
  • Anti-proliferative and anti-inflammatory drug development targeting PVR-specific cellular pathways is creating new pharmacological intervention options beyond supportive anti-VEGF therapy.

Key Market Constraints

  • Limited number of vitreoretinal surgeons with advanced PVR membrane peeling expertise restricts treatment access, particularly in underserved and emerging markets.
  • No FDA-approved pharmacological agent specifically indicated for PVR prevention limits the drug therapy market to off-label use of anti-inflammatory and anti-proliferative agents.
  • High surgical complexity and variable anatomical outcomes in advanced PVR cases create clinical uncertainty that complicates treatment planning and patient counseling.

Key Opportunity Areas

  • Sustained-release drug delivery platforms, including intravitreal implants and nanoparticle formulations, are creating new product development opportunities for PVR pharmacotherapy.
  • Gene therapy approaches targeting fibrotic and proliferative pathways involved in PVR pathogenesis are in early-stage development and represent a long-term market expansion opportunity.
  • Robotic-assisted vitreoretinal surgery is improving membrane peeling precision and potentially expanding the surgeon population capable of performing complex PVR procedures.

Segment-wise Analysis of the Proliferative Vitreoretinopathy Market

  • Pharmacological Treatment holds 38.9% of the product segment in 2026, supported by established demand channels and continued procurement across primary end use applications.
  • Advanced Stage Proliferative Vitreoretinopathy holds 42.6% of the disease stage segment in 2026, supported by established demand channels and continued procurement across primary end use applications.
  • Surgical Management holds 46.3% of the treatment approach segment in 2026, supported by established demand channels and continued procurement across primary end use applications.

The proliferative vitreoretinopathy market is segmented by product, disease stage, treatment approach, end use, and region.

By product, the market covers Pharmacological Treatment, Surgical Devices.

By disease stage, coverage includes Advanced Stage Proliferative Vitreoretinopathy, Early Stage Proliferative Vitreoretinopathy.

Which Product Segment Dominates the Proliferative Vitreoretinopathy Market?
Proliferative Vitreoretinopathy Market Analysis By Product

Pharmacological Treatment is expected to account for 38.9% of the product segment in 2026. Within this category, Anti Inflammatory Agents, Corticosteroids, Non Steroidal Anti Inflammatory Drugs represent the primary sub-segments generating procurement activity. The depth of the pharmacological treatment installed base across product applications sustains replacement demand and limits share erosion from newer alternatives in the proliferative vitreoretinopathy market.

Surgical Devices is the second largest category in the product segment, with demand concentrated in Vitrectomy Systems and Posterior Vitrectomy Systems. Growth in surgical devices reflects shifting buyer requirements within the proliferative vitreoretinopathy market toward this category.

Which Disease Stage Segment Dominates the Proliferative Vitreoretinopathy Market?
Proliferative Vitreoretinopathy Market Analysis By Disease Stage

Advanced Stage Proliferative Vitreoretinopathy is expected to account for 42.6% of the disease stage segment in 2026. Within this category, Grade C, Full Thickness Retinal Folds, Grade D represent the primary sub-segments generating procurement activity. The depth of the advanced stage proliferative vitreoretinopathy installed base across disease stage applications sustains replacement demand and limits share erosion from newer alternatives in the proliferative vitreoretinopathy market.

Early Stage Proliferative Vitreoretinopathy is the second largest category in the disease stage segment, with demand concentrated in Grade A and Vitreous Cells and Pigment. Growth in early stage proliferative vitreoretinopathy reflects shifting buyer requirements within the proliferative vitreoretinopathy market toward this category.

Which Treatment Approach Segment Dominates the Proliferative Vitreoretinopathy Market?
Proliferative Vitreoretinopathy Market Analysis By Treatment Approach

Surgical Management is expected to account for 46.3% of the treatment approach segment in 2026. Within this category, Pars Plana Vitrectomy, Standard Vitrectomy Procedure, Repeat Vitrectomy Procedure represent the primary sub-segments generating procurement activity. The depth of the surgical management installed base across treatment approach applications sustains replacement demand and limits share erosion from newer alternatives in the proliferative vitreoretinopathy market.

Medical Management is the second largest category in the treatment approach segment, with demand concentrated in Systemic Drug Therapy and Oral Anti Inflammatory Treatment. Growth in medical management reflects shifting buyer requirements within the proliferative vitreoretinopathy market toward this category.

Which Product Trend is Shaping the Next Phase of Growth in the Proliferative Vitreoretinopathy Market?

Sustained-release intravitreal drug delivery is emerging as the most promising pharmacological advancement for PVR management. Current treatment relies on intraoperative or post-surgical injection of anti-inflammatory and anti-proliferative agents that have limited duration of action, requiring repeated administration. Sustained-release formulations that maintain therapeutic drug concentrations in the vitreous cavity over weeks or months could fundamentally change the pharmacological management of PVR by providing continuous suppression of the fibroproliferative process.

Several drug delivery platforms are in preclinical and early clinical development for PVR applications, including biodegradable polymer implants, nanoparticle suspensions, and hydrogel depot systems. Roche, Novartis, and Bayer are evaluating sustained-release platforms through their retinal disease pipeline programs, while smaller companies like Clearside Biomedical and Oxurion are targeting PVR-specific drug delivery. The clinical evidence base remains early-stage, but successful development of a sustained-release PVR prophylaxis product would represent a significant market expansion event.

Regional Outlook Across Key Markets

Top Country Growth Comparison Proliferative Vitreoretinopathy Market Cagr (2026 2036)

  • USA is growing at 6.5%, supported by advanced vitreoretinal infrastructure, FDA drug development pathways, and academic retina centers.
  • Mexico is growing at 6.1%, supported by ophthalmology infrastructure development, retinal surgery training, and medical tourism.
  • Germany is growing at 5.6%, supported by university vitreoretinal programs, clinical research activity, and German society guidelines.
  • France is growing at 5.5%, supported by established ophthalmology centers, INSERM research funding, and retina society recommendations.

CAGR Table

Country CAGR (%)
USA 6.5%
Mexico 6.1%
Germany 5.6%
France 5.5%
UK 5.4%
South Korea 5.4%
Japan 5.2%

Source: Fact MR (FMR) analysis, based on proprietary forecasting model and primary research.
Proliferative Vitreoretinopathy Market Cagr Analysis By Country

Market Outlook for Proliferative Vitreoretinopathy in USA
Proliferative Vitreoretinopathy Market Country Value Analysis

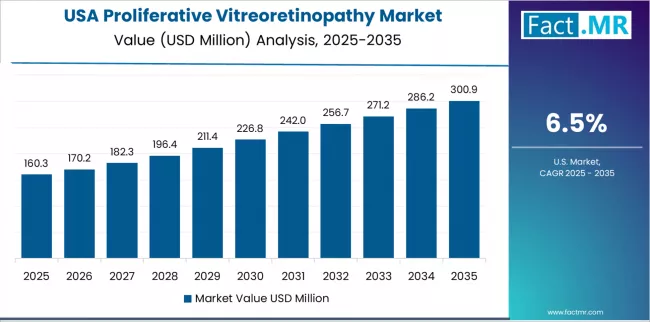
The USA Proliferative Vitreoretinopathy market is projected to grow at a CAGR of 6.5% through 2036. The U.S. is the largest single market for PVR treatment, supported by advanced vitreoretinal surgical infrastructure and retinal disease drug development activity.

  • Academic retina centers at Bascom Palmer, Wills Eye, and Massachusetts Eye and Ear perform the highest volumes of complex PVR surgery.
  • FDA regulatory pathways for PVR drug development create a clear framework for clinical trial design and approval.
  • Retina Society and ASRS guidelines influence treatment protocols and off-label pharmacotherapy use in PVR management.

Proliferative Vitreoretinopathy Demand Trends in Mexico

The Mexico Proliferative Vitreoretinopathy market is projected to grow at a CAGR of 6.1% through 2036. Mexico is a growing market for PVR treatment with expansion linked to ophthalmology infrastructure development and retinal surgery training.

  • Private retina specialty centers in Mexico City and Guadalajara perform complex vitreoretinal surgery including PVR cases.
  • Medical tourism for ophthalmic surgery brings international patients seeking cost-effective retinal procedures.
  • COFEPRIS regulatory alignment supports access to vitrectomy equipment and ophthalmic pharmaceuticals.

Germany Proliferative Vitreoretinopathy Market Growth Outlook

The Germany Proliferative Vitreoretinopathy market is projected to grow at a CAGR of 5.6% through 2036. Germany is a leading European market for PVR treatment with strong vitreoretinal surgery programs and clinical research activity.

  • University eye clinics in Munich, Bonn, and Freiburg maintain active vitreoretinal surgery and PVR research programs.
  • German Ophthalmological Society guidelines inform treatment protocols for complex retinal detachment and PVR.
  • Clinical trial participation in EU-wide retinal disease drug studies generates evidence supporting PVR pharmacotherapy development.

France Proliferative Vitreoretinopathy Market Demand Analysis

The France Proliferative Vitreoretinopathy market is projected to grow at a CAGR of 5.5% through 2036. France contributes to PVR treatment demand through established ophthalmology centers and retinal disease research programs.

  • Paris and Lyon eye hospitals maintain vitreoretinal surgery programs that manage complex PVR cases.
  • INSERM research funding supports retinal disease biology and drug delivery technology development relevant to PVR.
  • French Retina Society clinical practice recommendations guide PVR surgical and pharmacological management.

Proliferative Vitreoretinopathy Market Growth Assessment in UK

The UK Proliferative Vitreoretinopathy market is projected to grow at a CAGR of 5.4% through 2036. The U.K. PVR treatment market is supported by NHS ophthalmology services and Moorfields Eye Hospital as a global center of vitreoretinal excellence.

  • Moorfields Eye Hospital in London is among the highest-volume vitreoretinal surgery centers globally and a leader in PVR clinical research.
  • NICE technology appraisals evaluate cost-effectiveness of retinal disease treatments that have application in PVR management.
  • UK National Eye Research Centre supports translational research in retinal disease and drug delivery technology.

Proliferative Vitreoretinopathy Market Opportunity Outlook in South Korea
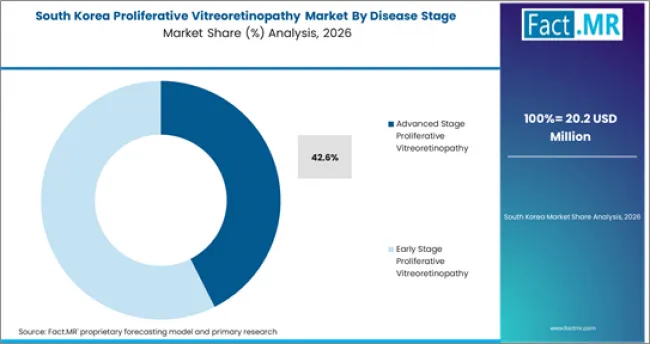
Proliferative Vitreoretinopathy Market South Korea Market Share Analysis By Disease Stage

The South Korea Proliferative Vitreoretinopathy market is projected to grow at a CAGR of 5.4% through 2036. Advanced ophthalmology infrastructure and clinical research activity support PVR treatment capability in South Korea.

  • Samsung Medical Center and Severance Hospital ophthalmology departments perform advanced vitreoretinal surgery.
  • National Health Insurance covers vitrectomy and related retinal procedures, supporting patient access to PVR treatment.
  • Korean Retina Society guidelines inform clinical practice for retinal detachment and PVR management.

Demand Landscape for Proliferative Vitreoretinopathy in Japan
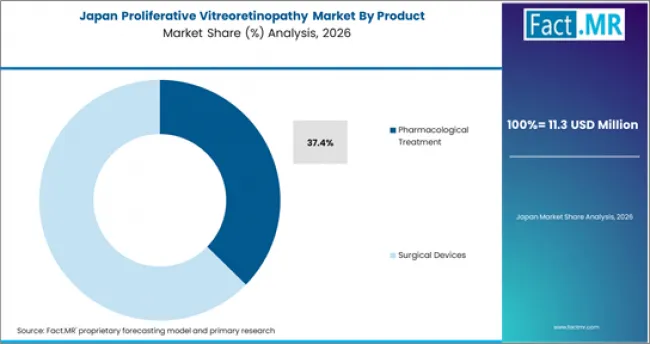
Proliferative Vitreoretinopathy Market Japan Market Share Analysis By Product

The Japan Proliferative Vitreoretinopathy market is projected to grow at a CAGR of 5.2% through 2036. Japan is a mature market for PVR treatment with established vitreoretinal surgery programs and aging population demographics.

  • High myopia prevalence in the Japanese population contributes to elevated retinal detachment incidence and downstream PVR risk.
  • University hospital ophthalmology departments maintain vitreoretinal fellowship programs that build surgical expertise for PVR management.
  • PMDA regulatory pathways support market access for vitrectomy systems and ophthalmic pharmacotherapy used in PVR treatment.

Competitive Benchmarking and Company Positioning
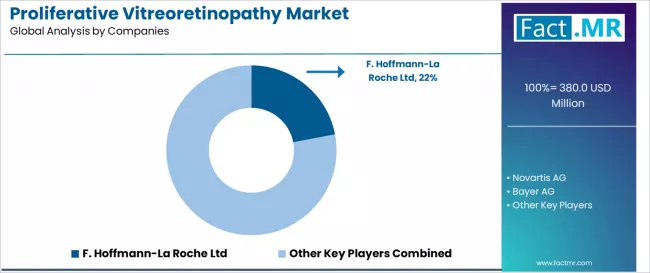
Proliferative Vitreoretinopathy Market Analysis By Company

Proliferative Vitreoretinopathy Market Analysis By Company

  • F. Hoffmann-La Roche Ltd, Novartis AG, Bayer AG, Regeneron Pharmaceuticals, Inc. hold established positions in the global proliferative vitreoretinopathy market through broad product portfolios, geographic reach, and growing capabilities in higher specification categories.
  • Allergan plc (AbbVie Inc.), Bausch + Lomb Corporation, Clearside Biomedical, Inc., Oxurion NV participate across specific price tiers, end use segments, and regional channels, with competition shaped by product quality, service support, and distribution access.
  • Retinal disease portfolio breadth, vitreoretinal surgical equipment capability, and sustained-release drug delivery platform maturity are the primary competitive differentiators, with clinical trial investment in PVR-specific indications creating long-term positioning advantages.

F. Hoffmann-La Roche leads the PVR-relevant market through its anti-VEGF franchise and retinal disease pipeline. Novartis AG and Bayer AG hold strong positions in vitreoretinal pharmacotherapy. Regeneron Pharmaceuticals competes through Eylea and its retinal disease pipeline. Allergan (AbbVie) and Bausch + Lomb serve the broader ophthalmic surgery and pharmacotherapy market with products used in PVR management.

The competitive landscape spans pharmaceutical companies with retinal drug portfolios, medical device companies supplying vitrectomy equipment, and specialized ophthalmic companies targeting specific drug delivery or surgical technology niches. No company has a dominant PVR-specific position because no approved PVR-specific drug exists. Competition is therefore shaped by broader retinal disease franchise strength, vitrectomy system installed base, and pipeline investment in PVR-targeted drug development.

Key Companies in the Proliferative Vitreoretinopathy Market

  • F. Hoffmann-La Roche Ltd, Novartis AG, Bayer AG, Regeneron Pharmaceuticals, Inc. are among the leading players in the proliferative vitreoretinopathy market globally, supported by strong brand visibility and broad product portfolios.
  • Allergan plc (AbbVie Inc.), Bausch + Lomb Corporation, Clearside Biomedical, Inc., Oxurion NV hold established positions across specific categories, supported by durable products and regional distribution.

Recent Industry Developments

  • F. Hoffmann-La Roche Ltd - Sustained-Release PVR Drug (January 2026)
    • F. Hoffmann-La Roche Ltd advanced its sustained-release intravitreal anti-inflammatory implant into Phase 2 clinical trials for PVR prophylaxis following primary retinal detachment surgery.
  • Novartis AG - Vitrectomy System Upgrade (2025)
    • Novartis AG introduced an upgraded high-speed vitrectomy system with enhanced visualization and membrane peeling instrumentation designed for complex PVR surgical management.
  • Bayer AG - Retinal Drug Delivery Platform (2025)
    • Bayer AG expanded its suprachoroidal drug delivery platform with formulation development targeting anti-proliferative agents for PVR prevention in high-risk retinal detachment patients.
  • Regeneron Pharmaceuticals, Inc. - OCT-Integrated Surgical System (February 2026)
    • Regeneron Pharmaceuticals, Inc. launched an intraoperative OCT-integrated vitreoretinal surgical platform that provides real-time retinal layer visualization during PVR membrane peeling procedures.

Leading Companies Shaping the Proliferative Vitreoretinopathy Market

  • F. Hoffmann-La Roche Ltd
  • Novartis AG
  • Bayer AG
  • Regeneron Pharmaceuticals, Inc.
  • Allergan plc (AbbVie Inc.)
  • Bausch + Lomb Corporation
  • Clearside Biomedical, Inc.
  • Oxurion NV
  • Adverum Biotechnologies, Inc.
  • Genentech, Inc. (a member of the Roche Group)

Sources and Research References

  • F. Hoffmann-La Roche Ltd. Product portfolio and corporate announcements.
  • Novartis AG. Product portfolio and corporate announcements.
  • Bayer AG. Product portfolio and corporate announcements.
  • Industry association statistics, regulatory publications, trade databases, and company product catalogs.
  • Primary interviews with manufacturers, distributors, buyers, and institutional users.

This bibliography is provided for reader reference and is not exhaustive. The full report contains the complete reference list and detailed citations.

Key Questions This Report Addresses

  • What is the current and future size of the Proliferative Vitreoretinopathy Market?
  • How fast is the Proliferative Vitreoretinopathy Market expected to grow between 2026 and 2036?
  • Which product is likely to lead the market by 2026?
  • Which disease stage segment is expected to account for the highest demand by 2026?
  • What factors are driving demand in this market globally?
  • How is technology adoption influencing the market structure?
  • Which countries are projected to show the fastest growth through 2036?
  • What is driving market expansion in USA and Mexico?
  • Who are the key companies active in the Proliferative Vitreoretinopathy Market?
  • How does Fact.MR estimate and validate the market forecast?

Proliferative Vitreoretinopathy Market Definition

The proliferative vitreoretinopathy market covers products, technologies, and services associated with product, disease stage, treatment approach categories. The scope includes global and regional market size and forecasts for 2026 to 2036 across product, disease stage, treatment approach, end use, and region.

Proliferative Vitreoretinopathy Market Inclusions

  • The scope covers global and regional market size and forecasts for 2026 to 2036 across product, disease stage, treatment approach, end use, and region.
  • It includes regional demand analysis across major geographies, based on factors such as technology adoption, regulatory requirements, institutional spending, and commercial demand patterns.
  • The report includes pricing and cost analysis across entry-level, mid-range, and premium categories, including hardware, software, and service components where applicable.
  • It covers technology trends, market drivers and constraints, and the competitive landscape, including product portfolios, pricing strategy, geographic reach, and distribution expansion of leading players.

Proliferative Vitreoretinopathy Market Exclusions

  • The scope excludes adjacent categories, general-purpose alternatives, and products not specifically classified under the proliferative vitreoretinopathy market taxonomy.
  • It excludes custom-built in-house solutions, informal unbranded products with low market visibility, and rental or leasing services without direct product sales.
  • The report excludes military or defense-grade variants, industrial systems outside the defined scope, and non-commercial applications without market transaction data.
  • It also excludes software-only platforms sold independently from hardware, unless they are part of the defined product or service taxonomy.

Proliferative Vitreoretinopathy Market Research Methodology

  • The methodology combines secondary research, primary interviews, and forecast modelling.
  • It draws on 120 plus secondary sources and benchmarks 65 plus company product portfolios.
  • Market sizing covers 30 plus countries through a demand-side model, supported by top-down validation.
  • Key inputs include end use adoption rates, technology penetration, pricing benchmarks, and regional procurement patterns.
  • The model cross-checks demand with shipments, pricing trends, channel mix, and product launches.
  • Primary validation includes 25 plus interviews across manufacturers, distributors, buyers, and institutional users.
  • Final estimates go through trade-flow checks, sales-pattern review, and sensitivity testing.

Scope of Analysis

Proliferative Vitreoretinopathy Market Breakdown By Product, Disease Stage, And Region

Parameter Details
Quantitative Units USD 402.8 million to USD 721.4 million, at a CAGR of 6.0%
Market Definition The Proliferative Vitreoretinopathy Market covers products, technologies, and services across product, disease stage, treatment approach categories for commercial, institutional, and consumer applications.
Regions Covered North America, Latin America, Europe, East Asia, South Asia and Pacific, Middle East and Africa
Countries Covered USA, Canada, UK, Germany, China, India, 30 plus countries
Key Companies F. Hoffmann-La Roche Ltd, Novartis AG, Bayer AG, Regeneron Pharmaceuticals, Inc., Allergan plc (AbbVie Inc.), Bausch + Lomb Corporation, Clearside Biomedical, Inc., Oxurion NV, Adverum Biotechnologies, Inc., Genentech, Inc. (a member of the Roche Group)
Forecast Period 2026 to 2036
Approach Hybrid demand-side and top-down methodology built on country-level application demand, product benchmarking, pricing analysis, shipment validation, and primary interviews across manufacturers, distributors, and end users

Proliferative Vitreoretinopathy Market Segmentation

  • Proliferative Vitreoretinopathy Market Segmented by Product:

    • Pharmacological Treatment
      • Anti Inflammatory Agents
        • Corticosteroids
        • Non Steroidal Anti Inflammatory Drugs
      • Anti Proliferative Agents
        • Methotrexate Therapy
        • 5 Fluorouracil Therapy
      • Anti Vascular Agents
        • Anti VEGF Therapy
        • Combination Drug Therapy
    • Surgical Devices
      • Vitrectomy Systems
        • Posterior Vitrectomy Systems
        • Microincision Vitrectomy Systems
      • Retinal Tamponade Agents
        • Silicone Oil Tamponade
        • Gas Tamponade
      • Retinal Laser Systems
        • Photocoagulation Laser Systems
  • Proliferative Vitreoretinopathy Market Segmented by Disease Stage:

    • Advanced Stage Proliferative Vitreoretinopathy
      • Grade C
        • Full Thickness Retinal Folds
      • Grade D
        • Severe Retinal Detachment
    • Early Stage Proliferative Vitreoretinopathy
      • Grade A
        • Vitreous Cells and Pigment
      • Grade B
        • Retinal Wrinkling
  • Proliferative Vitreoretinopathy Market Segmented by Treatment Approach:

    • Surgical Management
      • Pars Plana Vitrectomy
        • Standard Vitrectomy Procedure
        • Repeat Vitrectomy Procedure
      • Retinal Reattachment Surgery
        • Scleral Buckling
        • Membrane Peeling
    • Medical Management
      • Systemic Drug Therapy
        • Oral Anti Inflammatory Treatment
        • Injectable Pharmacotherapy
      • Topical Drug Therapy
        • Ophthalmic Eye Drops
        • Localized Drug Delivery
    • Adjunctive Therapy
      • Intraoperative Pharmacologic Use
        • Anti Proliferative Drug Application
        • Steroid Assisted Surgery
      • Postoperative Management
        • Anti Inflammatory Maintenance
        • Anti Fibrotic Therapy
  • Proliferative Vitreoretinopathy Market Segmented by End Use:

    • Hospitals
      • Public Hospitals
        • Tertiary Care Centers
      • Private Hospitals
        • Multispecialty Hospitals
    • Ophthalmic Clinics
      • Retina Specialty Clinics
        • Advanced Eye Care Centers
      • Ambulatory Surgical Centers
        • Day Care Eye Surgery Units
    • Academic and Research Institutes
      • Clinical Research Organizations
        • Ophthalmology Research Centers
      • Medical Universities
        • Teaching Hospitals
  • Proliferative Vitreoretinopathy Market Segmented by Technology:

    • Drug Delivery Technology
      • Sustained Release Systems
      • Nanoparticle Based Delivery
    • Surgical Technology
      • Minimally Invasive Vitrectomy
      • High Speed Vitrectomy Systems
    • Imaging Technology
      • Optical Coherence Tomography Integration
      • Intraoperative Visualization Systems
  • Proliferative Vitreoretinopathy Market by Region:

    • North America
      • USA
      • Canada
      • Mexico
    • Latin America
      • Brazil
      • Chile
      • Rest of Latin America
    • Western Europe
      • Germany
      • UK
      • Italy
      • Spain
      • France
      • Nordic
      • BENELUX
      • Rest of Western Europe
    • Eastern Europe
      • Russia
      • Poland
      • Hungary
      • Balkan & Baltic
      • Rest of Eastern Europe
    • East Asia
      • China
      • Japan
      • South Korea
    • South Asia and Pacific
      • India
      • ASEAN
      • Australia & New Zealand
      • Rest of South Asia and Pacific
    • Middle East & Africa
      • Kingdom of Saudi Arabia
      • Other GCC Countries
      • Turkiye
      • South Africa
      • Other African Union
      • Rest of Middle East & Africa

- Frequently Asked Questions -

How big is the proliferative vitreoretinopathy market in 2026?

The global proliferative vitreoretinopathy market is estimated to be valued at USD 402.8 million in 2026.

What will be the size of proliferative vitreoretinopathy market in 2036?

The market size for the proliferative vitreoretinopathy market is projected to reach USD 721.4 million by 2036.

How much will be the proliferative vitreoretinopathy market growth between 2026 and 2036?

The proliferative vitreoretinopathy market is expected to grow at a 6.0% CAGR between 2026 and 2036.

What are the key product types in the proliferative vitreoretinopathy market?

The key product types in proliferative vitreoretinopathy market are pharmacological treatment and surgical devices.

Which disease stage segment is expected to contribute significant share in the proliferative vitreoretinopathy market in 2026?

In terms of disease stage, advanced stage proliferative vitreoretinopathy segment is expected to command 42.6% share in the proliferative vitreoretinopathy market in 2026.

Table of Content

  1. Executive Summary
    • Global Market Outlook
    • Demand to side Trends
    • Supply to side Trends
    • Technology Roadmap Analysis
    • Analysis and Recommendations
  2. Market Overview
    • Market Coverage / Taxonomy
    • Market Definition / Scope / Limitations
  3. Research Methodology
    • Chapter Orientation
    • Analytical Lens and Working Hypotheses
      • Market Structure, Signals, and Trend Drivers
      • Benchmarking and Cross-market Comparability
      • Market Sizing, Forecasting, and Opportunity Mapping
    • Research Design and Evidence Framework
      • Desk Research Programme (Secondary Evidence)
        • Company Annual and Sustainability Reports
        • Peer-reviewed Journals and Academic Literature
        • Corporate Websites, Product Literature, and Technical Notes
        • Earnings Decks and Investor Briefings
        • Statutory Filings and Regulatory Disclosures
        • Technical White Papers and Standards Notes
        • Trade Journals, Industry Magazines, and Analyst Briefs
        • Conference Proceedings, Webinars, and Seminar Materials
        • Government Statistics Portals and Public Data Releases
        • Press Releases and Reputable Media Coverage
        • Specialist Newsletters and Curated Briefings
        • Sector Databases and Reference Repositories
        • Fact.MR Internal Proprietary Databases and Historical Market Datasets
        • Subscription Datasets and Paid Sources
        • Social Channels, Communities, and Digital Listening Inputs
        • Additional Desk Sources
      • Expert Input and Fieldwork (Primary Evidence)
        • Primary Modes
          • Qualitative Interviews and Expert Elicitation
          • Quantitative Surveys and Structured Data Capture
          • Blended Approach
        • Why Primary Evidence is Used
        • Field Techniques
          • Interviews
          • Surveys
          • Focus Groups
          • Observational and In-context Research
          • Social and Community Interactions
        • Stakeholder Universe Engaged
          • C-suite Leaders
          • Board Members
          • Presidents and Vice Presidents
          • R&D and Innovation Heads
          • Technical Specialists
          • Domain Subject-matter Experts
          • Scientists
          • Physicians and Other Healthcare Professionals
        • Governance, Ethics, and Data Stewardship
          • Research Ethics
          • Data Integrity and Handling
      • Tooling, Models, and Reference Databases
    • Data Engineering and Model Build
      • Data Acquisition and Ingestion
      • Cleaning, Normalisation, and Verification
      • Synthesis, Triangulation, and Analysis
    • Quality Assurance and Audit Trail
  4. Market Background
    • Market Dynamics
      • Drivers
      • Restraints
      • Opportunity
      • Trends
    • Scenario Forecast
      • Demand in Optimistic Scenario
      • Demand in Likely Scenario
      • Demand in Conservative Scenario
    • Opportunity Map Analysis
    • Product Life Cycle Analysis
    • Supply Chain Analysis
    • Investment Feasibility Matrix
    • Value Chain Analysis
    • PESTLE and Porter’s Analysis
    • Regulatory Landscape
    • Regional Parent Market Outlook
    • Production and Consumption Statistics
    • Import and Export Statistics
  5. Global Market Analysis 2021 to 2025 and Forecast, 2026 to 2036
    • Historical Market Size Value (USD Million) Analysis, 2021 to 2025
    • Current and Future Market Size Value (USD Million) Projections, 2026 to 2036
      • Y to o to Y Growth Trend Analysis
      • Absolute $ Opportunity Analysis
  6. Global Market Pricing Analysis 2021 to 2025 and Forecast 2026 to 2036
  7. Global Market Analysis 2021 to 2025 and Forecast 2026 to 2036, By Product
    • Introduction / Key Findings
    • Historical Market Size Value (USD Million) Analysis By Product, 2021 to 2025
    • Current and Future Market Size Value (USD Million) Analysis and Forecast By Product, 2026 to 2036
      • Pharmacological Treatment
        • Anti Inflammatory Agents
        • _Corticosteroids
        • _Non Steroidal Anti Inflammatory Drugs
        • Anti Proliferative Agents
        • _Methotrexate Therapy
        • _5 Fluorouracil Therapy
        • Anti Vascular Agents
        • _Anti VEGF Therapy
        • _Combination Drug Therapy
      • Surgical Devices
        • Vitrectomy Systems
        • _Posterior Vitrectomy Systems
        • _Microincision Vitrectomy Systems
        • Retinal Tamponade Agents
        • _Silicone Oil Tamponade
    • Y to o to Y Growth Trend Analysis By Product, 2021 to 2025
    • Absolute $ Opportunity Analysis By Product, 2026 to 2036
  8. Global Market Analysis 2021 to 2025 and Forecast 2026 to 2036, By Disease Stage
    • Introduction / Key Findings
    • Historical Market Size Value (USD Million) Analysis By Disease Stage, 2021 to 2025
    • Current and Future Market Size Value (USD Million) Analysis and Forecast By Disease Stage, 2026 to 2036
      • Advanced Stage Proliferative Vitreoretinopathy
        • Grade C
        • _Full Thickness Retinal Folds
        • Grade D
        • _Severe Retinal Detachment
      • Early Stage Proliferative Vitreoretinopathy
        • Grade A
        • _Vitreous Cells and Pigment
        • Grade B
        • _Retinal Wrinkling
    • Y to o to Y Growth Trend Analysis By Disease Stage, 2021 to 2025
    • Absolute $ Opportunity Analysis By Disease Stage, 2026 to 2036
  9. Global Market Analysis 2021 to 2025 and Forecast 2026 to 2036, By Treatment Approach
    • Introduction / Key Findings
    • Historical Market Size Value (USD Million) Analysis By Treatment Approach, 2021 to 2025
    • Current and Future Market Size Value (USD Million) Analysis and Forecast By Treatment Approach, 2026 to 2036
      • Surgical Management
        • Pars Plana Vitrectomy
        • _Standard Vitrectomy Procedure
        • _Repeat Vitrectomy Procedure
        • Retinal Reattachment Surgery
        • _Scleral Buckling
        • _Membrane Peeling
      • Medical Management
        • Systemic Drug Therapy
        • _Oral Anti Inflammatory Treatment
        • _Injectable Pharmacotherapy
        • Topical Drug Therapy
        • _Ophthalmic Eye Drops
      • Adjunctive Therapy
        • Intraoperative Pharmacologic Use
        • _Anti Proliferative Drug Application
        • _Steroid Assisted Surgery
        • Postoperative Management
        • _Anti Inflammatory Maintenance
    • Y to o to Y Growth Trend Analysis By Treatment Approach, 2021 to 2025
    • Absolute $ Opportunity Analysis By Treatment Approach, 2026 to 2036
  10. Global Market Analysis 2021 to 2025 and Forecast 2026 to 2036, By End Use
    • Introduction / Key Findings
    • Historical Market Size Value (USD Million) Analysis By End Use, 2021 to 2025
    • Current and Future Market Size Value (USD Million) Analysis and Forecast By End Use, 2026 to 2036
      • Hospitals
        • Public Hospitals
        • _Tertiary Care Centers
        • Private Hospitals
        • _Multispecialty Hospitals
      • Ophthalmic Clinics
        • Retina Specialty Clinics
        • _Advanced Eye Care Centers
        • Ambulatory Surgical Centers
        • _Day Care Eye Surgery Value (USD Million)s
      • Academic and Research Institutes
        • Clinical Research Organizations
        • _Ophthalmology Research Centers
        • Medical Universities
        • _Teaching Hospitals
    • Y to o to Y Growth Trend Analysis By End Use, 2021 to 2025
    • Absolute $ Opportunity Analysis By End Use, 2026 to 2036
  11. Global Market Analysis 2021 to 2025 and Forecast 2026 to 2036, By Technology
    • Introduction / Key Findings
    • Historical Market Size Value (USD Million) Analysis By Technology, 2021 to 2025
    • Current and Future Market Size Value (USD Million) Analysis and Forecast By Technology, 2026 to 2036
      • Drug Delivery Technology
        • Sustained Release Systems
        • Nanoparticle Based Delivery
      • Surgical Technology
        • Minimally Invasive Vitrectomy
        • High Speed Vitrectomy Systems
      • Imaging Technology
        • Optical Coherence Tomography Integration
        • Intraoperative Visualization Systems
    • Y to o to Y Growth Trend Analysis By Technology, 2021 to 2025
    • Absolute $ Opportunity Analysis By Technology, 2026 to 2036
  12. Global Market Analysis 2021 to 2025 and Forecast 2026 to 2036, By Region
    • Introduction
    • Historical Market Size Value (USD Million) Analysis By Region, 2021 to 2025
    • Current Market Size Value (USD Million) Analysis and Forecast By Region, 2026 to 2036
      • North America
      • Latin America
      • Western Europe
      • Eastern Europe
      • East Asia
      • South Asia and Pacific
      • Middle East & Africa
    • Market Attractiveness Analysis By Region
  13. North America Market Analysis 2021 to 2025 and Forecast 2026 to 2036, By Country
    • Historical Market Size Value (USD Million) Trend Analysis By Market Taxonomy, 2021 to 2025
    • Market Size Value (USD Million) Forecast By Market Taxonomy, 2026 to 2036
      • By Country
        • USA
        • Canada
        • Mexico
      • By Product
      • By Disease Stage
      • By Treatment Approach
      • By End Use
      • By Technology
    • Market Attractiveness Analysis
      • By Country
      • By Product
      • By Disease Stage
      • By Treatment Approach
      • By End Use
      • By Technology
    • Key Takeaways
  14. Latin America Market Analysis 2021 to 2025 and Forecast 2026 to 2036, By Country
    • Historical Market Size Value (USD Million) Trend Analysis By Market Taxonomy, 2021 to 2025
    • Market Size Value (USD Million) Forecast By Market Taxonomy, 2026 to 2036
      • By Country
        • Brazil
        • Chile
        • Rest of Latin America
      • By Product
      • By Disease Stage
      • By Treatment Approach
      • By End Use
      • By Technology
    • Market Attractiveness Analysis
      • By Country
      • By Product
      • By Disease Stage
      • By Treatment Approach
      • By End Use
      • By Technology
    • Key Takeaways
  15. Western Europe Market Analysis 2021 to 2025 and Forecast 2026 to 2036, By Country
    • Historical Market Size Value (USD Million) Trend Analysis By Market Taxonomy, 2021 to 2025
    • Market Size Value (USD Million) Forecast By Market Taxonomy, 2026 to 2036
      • By Country
        • Germany
        • UK
        • Italy
        • Spain
        • France
        • Nordic
        • BENELUX
        • Rest of Western Europe
      • By Product
      • By Disease Stage
      • By Treatment Approach
      • By End Use
      • By Technology
    • Market Attractiveness Analysis
      • By Country
      • By Product
      • By Disease Stage
      • By Treatment Approach
      • By End Use
      • By Technology
    • Key Takeaways
  16. Eastern Europe Market Analysis 2021 to 2025 and Forecast 2026 to 2036, By Country
    • Historical Market Size Value (USD Million) Trend Analysis By Market Taxonomy, 2021 to 2025
    • Market Size Value (USD Million) Forecast By Market Taxonomy, 2026 to 2036
      • By Country
        • Russia
        • Poland
        • Hungary
        • Balkan & Baltic
        • Rest of Eastern Europe
      • By Product
      • By Disease Stage
      • By Treatment Approach
      • By End Use
      • By Technology
    • Market Attractiveness Analysis
      • By Country
      • By Product
      • By Disease Stage
      • By Treatment Approach
      • By End Use
      • By Technology
    • Key Takeaways
  17. East Asia Market Analysis 2021 to 2025 and Forecast 2026 to 2036, By Country
    • Historical Market Size Value (USD Million) Trend Analysis By Market Taxonomy, 2021 to 2025
    • Market Size Value (USD Million) Forecast By Market Taxonomy, 2026 to 2036
      • By Country
        • China
        • Japan
        • South Korea
      • By Product
      • By Disease Stage
      • By Treatment Approach
      • By End Use
      • By Technology
    • Market Attractiveness Analysis
      • By Country
      • By Product
      • By Disease Stage
      • By Treatment Approach
      • By End Use
      • By Technology
    • Key Takeaways
  18. South Asia and Pacific Market Analysis 2021 to 2025 and Forecast 2026 to 2036, By Country
    • Historical Market Size Value (USD Million) Trend Analysis By Market Taxonomy, 2021 to 2025
    • Market Size Value (USD Million) Forecast By Market Taxonomy, 2026 to 2036
      • By Country
        • India
        • ASEAN
        • Australia & New Zealand
        • Rest of South Asia and Pacific
      • By Product
      • By Disease Stage
      • By Treatment Approach
      • By End Use
      • By Technology
    • Market Attractiveness Analysis
      • By Country
      • By Product
      • By Disease Stage
      • By Treatment Approach
      • By End Use
      • By Technology
    • Key Takeaways
  19. Middle East & Africa Market Analysis 2021 to 2025 and Forecast 2026 to 2036, By Country
    • Historical Market Size Value (USD Million) Trend Analysis By Market Taxonomy, 2021 to 2025
    • Market Size Value (USD Million) Forecast By Market Taxonomy, 2026 to 2036
      • By Country
        • Kingdom of Saudi Arabia
        • Other GCC Countries
        • Turkiye
        • South Africa
        • Other African Union
        • Rest of Middle East & Africa
      • By Product
      • By Disease Stage
      • By Treatment Approach
      • By End Use
      • By Technology
    • Market Attractiveness Analysis
      • By Country
      • By Product
      • By Disease Stage
      • By Treatment Approach
      • By End Use
      • By Technology
    • Key Takeaways
  20. Key Countries Market Analysis
    • USA
      • Pricing Analysis
      • Market Share Analysis, 2025
        • By Product
        • By Disease Stage
        • By Treatment Approach
        • By End Use
        • By Technology
    • Canada
      • Pricing Analysis
      • Market Share Analysis, 2025
        • By Product
        • By Disease Stage
        • By Treatment Approach
        • By End Use
        • By Technology
    • Mexico
      • Pricing Analysis
      • Market Share Analysis, 2025
        • By Product
        • By Disease Stage
        • By Treatment Approach
        • By End Use
        • By Technology
    • Brazil
      • Pricing Analysis
      • Market Share Analysis, 2025
        • By Product
        • By Disease Stage
        • By Treatment Approach
        • By End Use
        • By Technology
    • Chile
      • Pricing Analysis
      • Market Share Analysis, 2025
        • By Product
        • By Disease Stage
        • By Treatment Approach
        • By End Use
        • By Technology
    • Germany
      • Pricing Analysis
      • Market Share Analysis, 2025
        • By Product
        • By Disease Stage
        • By Treatment Approach
        • By End Use
        • By Technology
    • UK
      • Pricing Analysis
      • Market Share Analysis, 2025
        • By Product
        • By Disease Stage
        • By Treatment Approach
        • By End Use
        • By Technology
    • Italy
      • Pricing Analysis
      • Market Share Analysis, 2025
        • By Product
        • By Disease Stage
        • By Treatment Approach
        • By End Use
        • By Technology
    • Spain
      • Pricing Analysis
      • Market Share Analysis, 2025
        • By Product
        • By Disease Stage
        • By Treatment Approach
        • By End Use
        • By Technology
    • France
      • Pricing Analysis
      • Market Share Analysis, 2025
        • By Product
        • By Disease Stage
        • By Treatment Approach
        • By End Use
        • By Technology
    • India
      • Pricing Analysis
      • Market Share Analysis, 2025
        • By Product
        • By Disease Stage
        • By Treatment Approach
        • By End Use
        • By Technology
    • ASEAN
      • Pricing Analysis
      • Market Share Analysis, 2025
        • By Product
        • By Disease Stage
        • By Treatment Approach
        • By End Use
        • By Technology
    • Australia & New Zealand
      • Pricing Analysis
      • Market Share Analysis, 2025
        • By Product
        • By Disease Stage
        • By Treatment Approach
        • By End Use
        • By Technology
    • China
      • Pricing Analysis
      • Market Share Analysis, 2025
        • By Product
        • By Disease Stage
        • By Treatment Approach
        • By End Use
        • By Technology
    • Japan
      • Pricing Analysis
      • Market Share Analysis, 2025
        • By Product
        • By Disease Stage
        • By Treatment Approach
        • By End Use
        • By Technology
    • South Korea
      • Pricing Analysis
      • Market Share Analysis, 2025
        • By Product
        • By Disease Stage
        • By Treatment Approach
        • By End Use
        • By Technology
    • Russia
      • Pricing Analysis
      • Market Share Analysis, 2025
        • By Product
        • By Disease Stage
        • By Treatment Approach
        • By End Use
        • By Technology
    • Poland
      • Pricing Analysis
      • Market Share Analysis, 2025
        • By Product
        • By Disease Stage
        • By Treatment Approach
        • By End Use
        • By Technology
    • Hungary
      • Pricing Analysis
      • Market Share Analysis, 2025
        • By Product
        • By Disease Stage
        • By Treatment Approach
        • By End Use
        • By Technology
    • Kingdom of Saudi Arabia
      • Pricing Analysis
      • Market Share Analysis, 2025
        • By Product
        • By Disease Stage
        • By Treatment Approach
        • By End Use
        • By Technology
    • Turkiye
      • Pricing Analysis
      • Market Share Analysis, 2025
        • By Product
        • By Disease Stage
        • By Treatment Approach
        • By End Use
        • By Technology
    • South Africa
      • Pricing Analysis
      • Market Share Analysis, 2025
        • By Product
        • By Disease Stage
        • By Treatment Approach
        • By End Use
        • By Technology
  21. Market Structure Analysis
    • Competition Dashboard
    • Competition Benchmarking
    • Market Share Analysis of Top Players
      • By Regional
      • By Product
      • By Disease Stage
      • By Treatment Approach
      • By End Use
      • By Technology
  22. Competition Analysis
    • Competition Deep Dive
      • F. Hoffmann-La Roche Ltd
        • Overview
        • Product Portfolio
        • Profitability by Market Segments (Product/Age /Sales Channel/Region)
        • Sales Footprint
        • Strategy Overview
          • Marketing Strategy
          • Product Strategy
          • Channel Strategy
      • Novartis AG
      • Bayer AG
      • Regeneron Pharmaceuticals, Inc.
      • Allergan plc (AbbVie Inc.)
      • Bausch + Lomb Corporation
      • Clearside Biomedical, Inc.
      • Oxurion NV
      • Adverum Biotechnologies, Inc.
      • Genentech, Inc. (a member of the Roche Group)
  23. Assumptions & Acronyms Used

List Of Table

  • Table 1: Global Market Value (USD Million) Forecast by Region, 2021 to 2036
  • Table 2: Global Market Value (USD Million) Forecast by Product, 2021 to 2036
  • Table 3: Global Market Value (USD Million) Forecast by Disease Stage, 2021 to 2036
  • Table 4: Global Market Value (USD Million) Forecast by Treatment Approach, 2021 to 2036
  • Table 5: Global Market Value (USD Million) Forecast by End Use, 2021 to 2036
  • Table 6: Global Market Value (USD Million) Forecast by Technology, 2021 to 2036
  • Table 7: North America Market Value (USD Million) Forecast by Country, 2021 to 2036
  • Table 8: North America Market Value (USD Million) Forecast by Product, 2021 to 2036
  • Table 9: North America Market Value (USD Million) Forecast by Disease Stage, 2021 to 2036
  • Table 10: North America Market Value (USD Million) Forecast by Treatment Approach, 2021 to 2036
  • Table 11: North America Market Value (USD Million) Forecast by End Use, 2021 to 2036
  • Table 12: North America Market Value (USD Million) Forecast by Technology, 2021 to 2036
  • Table 13: Latin America Market Value (USD Million) Forecast by Country, 2021 to 2036
  • Table 14: Latin America Market Value (USD Million) Forecast by Product, 2021 to 2036
  • Table 15: Latin America Market Value (USD Million) Forecast by Disease Stage, 2021 to 2036
  • Table 16: Latin America Market Value (USD Million) Forecast by Treatment Approach, 2021 to 2036
  • Table 17: Latin America Market Value (USD Million) Forecast by End Use, 2021 to 2036
  • Table 18: Latin America Market Value (USD Million) Forecast by Technology, 2021 to 2036
  • Table 19: Western Europe Market Value (USD Million) Forecast by Country, 2021 to 2036
  • Table 20: Western Europe Market Value (USD Million) Forecast by Product, 2021 to 2036
  • Table 21: Western Europe Market Value (USD Million) Forecast by Disease Stage, 2021 to 2036
  • Table 22: Western Europe Market Value (USD Million) Forecast by Treatment Approach, 2021 to 2036
  • Table 23: Western Europe Market Value (USD Million) Forecast by End Use, 2021 to 2036
  • Table 24: Western Europe Market Value (USD Million) Forecast by Technology, 2021 to 2036
  • Table 25: Eastern Europe Market Value (USD Million) Forecast by Country, 2021 to 2036
  • Table 26: Eastern Europe Market Value (USD Million) Forecast by Product, 2021 to 2036
  • Table 27: Eastern Europe Market Value (USD Million) Forecast by Disease Stage, 2021 to 2036
  • Table 28: Eastern Europe Market Value (USD Million) Forecast by Treatment Approach, 2021 to 2036
  • Table 29: Eastern Europe Market Value (USD Million) Forecast by End Use, 2021 to 2036
  • Table 30: Eastern Europe Market Value (USD Million) Forecast by Technology, 2021 to 2036
  • Table 31: East Asia Market Value (USD Million) Forecast by Country, 2021 to 2036
  • Table 32: East Asia Market Value (USD Million) Forecast by Product, 2021 to 2036
  • Table 33: East Asia Market Value (USD Million) Forecast by Disease Stage, 2021 to 2036
  • Table 34: East Asia Market Value (USD Million) Forecast by Treatment Approach, 2021 to 2036
  • Table 35: East Asia Market Value (USD Million) Forecast by End Use, 2021 to 2036
  • Table 36: East Asia Market Value (USD Million) Forecast by Technology, 2021 to 2036
  • Table 37: South Asia and Pacific Market Value (USD Million) Forecast by Country, 2021 to 2036
  • Table 38: South Asia and Pacific Market Value (USD Million) Forecast by Product, 2021 to 2036
  • Table 39: South Asia and Pacific Market Value (USD Million) Forecast by Disease Stage, 2021 to 2036
  • Table 40: South Asia and Pacific Market Value (USD Million) Forecast by Treatment Approach, 2021 to 2036
  • Table 41: South Asia and Pacific Market Value (USD Million) Forecast by End Use, 2021 to 2036
  • Table 42: South Asia and Pacific Market Value (USD Million) Forecast by Technology, 2021 to 2036
  • Table 43: Middle East & Africa Market Value (USD Million) Forecast by Country, 2021 to 2036
  • Table 44: Middle East & Africa Market Value (USD Million) Forecast by Product, 2021 to 2036
  • Table 45: Middle East & Africa Market Value (USD Million) Forecast by Disease Stage, 2021 to 2036
  • Table 46: Middle East & Africa Market Value (USD Million) Forecast by Treatment Approach, 2021 to 2036
  • Table 47: Middle East & Africa Market Value (USD Million) Forecast by End Use, 2021 to 2036
  • Table 48: Middle East & Africa Market Value (USD Million) Forecast by Technology, 2021 to 2036

List Of Figures

  • Figure 1: Global Market Pricing Analysis
  • Figure 2: Global Market Value (USD Million) Forecast 2021 to 2036
  • Figure 3: Global Market Value Share and BPS Analysis by Product, 2026 and 2036
  • Figure 4: Global Market Y-o-Y Growth Comparison by Product, 2026 to 2036
  • Figure 5: Global Market Attractiveness Analysis by Product
  • Figure 6: Global Market Value Share and BPS Analysis by Disease Stage, 2026 and 2036
  • Figure 7: Global Market Y-o-Y Growth Comparison by Disease Stage, 2026 to 2036
  • Figure 8: Global Market Attractiveness Analysis by Disease Stage
  • Figure 9: Global Market Value Share and BPS Analysis by Treatment Approach, 2026 and 2036
  • Figure 10: Global Market Y-o-Y Growth Comparison by Treatment Approach, 2026 to 2036
  • Figure 11: Global Market Attractiveness Analysis by Treatment Approach
  • Figure 12: Global Market Value Share and BPS Analysis by End Use, 2026 and 2036
  • Figure 13: Global Market Y-o-Y Growth Comparison by End Use, 2026 to 2036
  • Figure 14: Global Market Attractiveness Analysis by End Use
  • Figure 15: Global Market Value Share and BPS Analysis by Technology, 2026 and 2036
  • Figure 16: Global Market Y-o-Y Growth Comparison by Technology, 2026 to 2036
  • Figure 17: Global Market Attractiveness Analysis by Technology
  • Figure 18: Global Market Value (USD Million) Share and BPS Analysis by Region, 2026 and 2036
  • Figure 19: Global Market Y-o-Y Growth Comparison by Region, 2026 to 2036
  • Figure 20: Global Market Attractiveness Analysis by Region
  • Figure 21: North America Market Incremental Dollar Opportunity, 2026 to 2036
  • Figure 22: Latin America Market Incremental Dollar Opportunity, 2026 to 2036
  • Figure 23: Western Europe Market Incremental Dollar Opportunity, 2026 to 2036
  • Figure 24: Eastern Europe Market Incremental Dollar Opportunity, 2026 to 2036
  • Figure 25: East Asia Market Incremental Dollar Opportunity, 2026 to 2036
  • Figure 26: South Asia and Pacific Market Incremental Dollar Opportunity, 2026 to 2036
  • Figure 27: Middle East & Africa Market Incremental Dollar Opportunity, 2026 to 2036
  • Figure 28: North America Market Value Share and BPS Analysis by Country, 2026 and 2036
  • Figure 29: North America Market Value Share and BPS Analysis by Product, 2026 and 2036
  • Figure 30: North America Market Y-o-Y Growth Comparison by Product, 2026 to 2036
  • Figure 31: North America Market Attractiveness Analysis by Product
  • Figure 32: North America Market Value Share and BPS Analysis by Disease Stage, 2026 and 2036
  • Figure 33: North America Market Y-o-Y Growth Comparison by Disease Stage, 2026 to 2036
  • Figure 34: North America Market Attractiveness Analysis by Disease Stage
  • Figure 35: North America Market Value Share and BPS Analysis by Treatment Approach, 2026 and 2036
  • Figure 36: North America Market Y-o-Y Growth Comparison by Treatment Approach, 2026 to 2036
  • Figure 37: North America Market Attractiveness Analysis by Treatment Approach
  • Figure 38: North America Market Value Share and BPS Analysis by End Use, 2026 and 2036
  • Figure 39: North America Market Y-o-Y Growth Comparison by End Use, 2026 to 2036
  • Figure 40: North America Market Attractiveness Analysis by End Use
  • Figure 41: North America Market Value Share and BPS Analysis by Technology, 2026 and 2036
  • Figure 42: North America Market Y-o-Y Growth Comparison by Technology, 2026 to 2036
  • Figure 43: North America Market Attractiveness Analysis by Technology
  • Figure 44: Latin America Market Value Share and BPS Analysis by Country, 2026 and 2036
  • Figure 45: Latin America Market Value Share and BPS Analysis by Product, 2026 and 2036
  • Figure 46: Latin America Market Y-o-Y Growth Comparison by Product, 2026 to 2036
  • Figure 47: Latin America Market Attractiveness Analysis by Product
  • Figure 48: Latin America Market Value Share and BPS Analysis by Disease Stage, 2026 and 2036
  • Figure 49: Latin America Market Y-o-Y Growth Comparison by Disease Stage, 2026 to 2036
  • Figure 50: Latin America Market Attractiveness Analysis by Disease Stage
  • Figure 51: Latin America Market Value Share and BPS Analysis by Treatment Approach, 2026 and 2036
  • Figure 52: Latin America Market Y-o-Y Growth Comparison by Treatment Approach, 2026 to 2036
  • Figure 53: Latin America Market Attractiveness Analysis by Treatment Approach
  • Figure 54: Latin America Market Value Share and BPS Analysis by End Use, 2026 and 2036
  • Figure 55: Latin America Market Y-o-Y Growth Comparison by End Use, 2026 to 2036
  • Figure 56: Latin America Market Attractiveness Analysis by End Use
  • Figure 57: Latin America Market Value Share and BPS Analysis by Technology, 2026 and 2036
  • Figure 58: Latin America Market Y-o-Y Growth Comparison by Technology, 2026 to 2036
  • Figure 59: Latin America Market Attractiveness Analysis by Technology
  • Figure 60: Western Europe Market Value Share and BPS Analysis by Country, 2026 and 2036
  • Figure 61: Western Europe Market Value Share and BPS Analysis by Product, 2026 and 2036
  • Figure 62: Western Europe Market Y-o-Y Growth Comparison by Product, 2026 to 2036
  • Figure 63: Western Europe Market Attractiveness Analysis by Product
  • Figure 64: Western Europe Market Value Share and BPS Analysis by Disease Stage, 2026 and 2036
  • Figure 65: Western Europe Market Y-o-Y Growth Comparison by Disease Stage, 2026 to 2036
  • Figure 66: Western Europe Market Attractiveness Analysis by Disease Stage
  • Figure 67: Western Europe Market Value Share and BPS Analysis by Treatment Approach, 2026 and 2036
  • Figure 68: Western Europe Market Y-o-Y Growth Comparison by Treatment Approach, 2026 to 2036
  • Figure 69: Western Europe Market Attractiveness Analysis by Treatment Approach
  • Figure 70: Western Europe Market Value Share and BPS Analysis by End Use, 2026 and 2036
  • Figure 71: Western Europe Market Y-o-Y Growth Comparison by End Use, 2026 to 2036
  • Figure 72: Western Europe Market Attractiveness Analysis by End Use
  • Figure 73: Western Europe Market Value Share and BPS Analysis by Technology, 2026 and 2036
  • Figure 74: Western Europe Market Y-o-Y Growth Comparison by Technology, 2026 to 2036
  • Figure 75: Western Europe Market Attractiveness Analysis by Technology
  • Figure 76: Eastern Europe Market Value Share and BPS Analysis by Country, 2026 and 2036
  • Figure 77: Eastern Europe Market Value Share and BPS Analysis by Product, 2026 and 2036
  • Figure 78: Eastern Europe Market Y-o-Y Growth Comparison by Product, 2026 to 2036
  • Figure 79: Eastern Europe Market Attractiveness Analysis by Product
  • Figure 80: Eastern Europe Market Value Share and BPS Analysis by Disease Stage, 2026 and 2036
  • Figure 81: Eastern Europe Market Y-o-Y Growth Comparison by Disease Stage, 2026 to 2036
  • Figure 82: Eastern Europe Market Attractiveness Analysis by Disease Stage
  • Figure 83: Eastern Europe Market Value Share and BPS Analysis by Treatment Approach, 2026 and 2036
  • Figure 84: Eastern Europe Market Y-o-Y Growth Comparison by Treatment Approach, 2026 to 2036
  • Figure 85: Eastern Europe Market Attractiveness Analysis by Treatment Approach
  • Figure 86: Eastern Europe Market Value Share and BPS Analysis by End Use, 2026 and 2036
  • Figure 87: Eastern Europe Market Y-o-Y Growth Comparison by End Use, 2026 to 2036
  • Figure 88: Eastern Europe Market Attractiveness Analysis by End Use
  • Figure 89: Eastern Europe Market Value Share and BPS Analysis by Technology, 2026 and 2036
  • Figure 90: Eastern Europe Market Y-o-Y Growth Comparison by Technology, 2026 to 2036
  • Figure 91: Eastern Europe Market Attractiveness Analysis by Technology
  • Figure 92: East Asia Market Value Share and BPS Analysis by Country, 2026 and 2036
  • Figure 93: East Asia Market Value Share and BPS Analysis by Product, 2026 and 2036
  • Figure 94: East Asia Market Y-o-Y Growth Comparison by Product, 2026 to 2036
  • Figure 95: East Asia Market Attractiveness Analysis by Product
  • Figure 96: East Asia Market Value Share and BPS Analysis by Disease Stage, 2026 and 2036
  • Figure 97: East Asia Market Y-o-Y Growth Comparison by Disease Stage, 2026 to 2036
  • Figure 98: East Asia Market Attractiveness Analysis by Disease Stage
  • Figure 99: East Asia Market Value Share and BPS Analysis by Treatment Approach, 2026 and 2036
  • Figure 100: East Asia Market Y-o-Y Growth Comparison by Treatment Approach, 2026 to 2036
  • Figure 101: East Asia Market Attractiveness Analysis by Treatment Approach
  • Figure 102: East Asia Market Value Share and BPS Analysis by End Use, 2026 and 2036
  • Figure 103: East Asia Market Y-o-Y Growth Comparison by End Use, 2026 to 2036
  • Figure 104: East Asia Market Attractiveness Analysis by End Use
  • Figure 105: East Asia Market Value Share and BPS Analysis by Technology, 2026 and 2036
  • Figure 106: East Asia Market Y-o-Y Growth Comparison by Technology, 2026 to 2036
  • Figure 107: East Asia Market Attractiveness Analysis by Technology
  • Figure 108: South Asia and Pacific Market Value Share and BPS Analysis by Country, 2026 and 2036
  • Figure 109: South Asia and Pacific Market Value Share and BPS Analysis by Product, 2026 and 2036
  • Figure 110: South Asia and Pacific Market Y-o-Y Growth Comparison by Product, 2026 to 2036
  • Figure 111: South Asia and Pacific Market Attractiveness Analysis by Product
  • Figure 112: South Asia and Pacific Market Value Share and BPS Analysis by Disease Stage, 2026 and 2036
  • Figure 113: South Asia and Pacific Market Y-o-Y Growth Comparison by Disease Stage, 2026 to 2036
  • Figure 114: South Asia and Pacific Market Attractiveness Analysis by Disease Stage
  • Figure 115: South Asia and Pacific Market Value Share and BPS Analysis by Treatment Approach, 2026 and 2036
  • Figure 116: South Asia and Pacific Market Y-o-Y Growth Comparison by Treatment Approach, 2026 to 2036
  • Figure 117: South Asia and Pacific Market Attractiveness Analysis by Treatment Approach
  • Figure 118: South Asia and Pacific Market Value Share and BPS Analysis by End Use, 2026 and 2036
  • Figure 119: South Asia and Pacific Market Y-o-Y Growth Comparison by End Use, 2026 to 2036
  • Figure 120: South Asia and Pacific Market Attractiveness Analysis by End Use
  • Figure 121: South Asia and Pacific Market Value Share and BPS Analysis by Technology, 2026 and 2036
  • Figure 122: South Asia and Pacific Market Y-o-Y Growth Comparison by Technology, 2026 to 2036
  • Figure 123: South Asia and Pacific Market Attractiveness Analysis by Technology
  • Figure 124: Middle East & Africa Market Value Share and BPS Analysis by Country, 2026 and 2036
  • Figure 125: Middle East & Africa Market Value Share and BPS Analysis by Product, 2026 and 2036
  • Figure 126: Middle East & Africa Market Y-o-Y Growth Comparison by Product, 2026 to 2036
  • Figure 127: Middle East & Africa Market Attractiveness Analysis by Product
  • Figure 128: Middle East & Africa Market Value Share and BPS Analysis by Disease Stage, 2026 and 2036
  • Figure 129: Middle East & Africa Market Y-o-Y Growth Comparison by Disease Stage, 2026 to 2036
  • Figure 130: Middle East & Africa Market Attractiveness Analysis by Disease Stage
  • Figure 131: Middle East & Africa Market Value Share and BPS Analysis by Treatment Approach, 2026 and 2036
  • Figure 132: Middle East & Africa Market Y-o-Y Growth Comparison by Treatment Approach, 2026 to 2036
  • Figure 133: Middle East & Africa Market Attractiveness Analysis by Treatment Approach
  • Figure 134: Middle East & Africa Market Value Share and BPS Analysis by End Use, 2026 and 2036
  • Figure 135: Middle East & Africa Market Y-o-Y Growth Comparison by End Use, 2026 to 2036
  • Figure 136: Middle East & Africa Market Attractiveness Analysis by End Use
  • Figure 137: Middle East & Africa Market Value Share and BPS Analysis by Technology, 2026 and 2036
  • Figure 138: Middle East & Africa Market Y-o-Y Growth Comparison by Technology, 2026 to 2036
  • Figure 139: Middle East & Africa Market Attractiveness Analysis by Technology
  • Figure 140: Global Market - Tier Structure Analysis
  • Figure 141: Global Market - Company Share Analysis

Proliferative Vitreoretinopathy Market