- Market Value (2025): USD 397.0 Bn
- Estimated Value (2026): USD 418.6 Bn
- Forecast Value (2036): USD 694.8 Bn
- CAGR (2026-2036): 5.2%
What is the Medium and Heavy Duty Commercial Vehicles Market forecast to be worth by 2036?
USD 418.6 billion in 2026 to USD 694.8 billion by 2036, at 5.2% CAGR.
- Demand is projected to increase from USD 418.6 billion in 2026 to USD 694.8 billion by 2036.
- The market is expected to create a USD 276.2 billion absolute opportunity during the forecast period as freight, construction, public transport and municipal fleets replace vehicles and add capacity.
- The market is forecast to record 5.2% CAGR from 2026 to 2036 as buyers combine conventional powertrain renewal with selective adoption of electric, hybrid, natural-gas and hydrogen platforms.
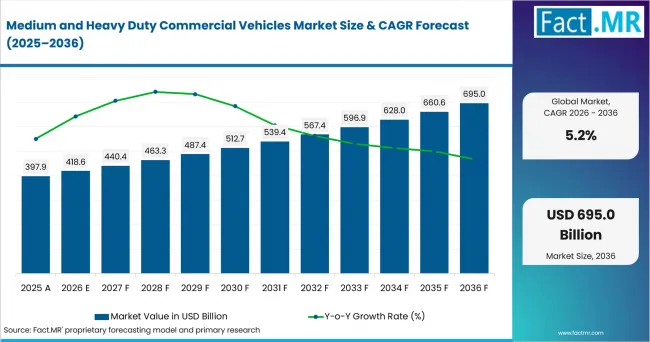
Medium And Heavy Duty Commercial Vehicles Market Value Analysis | Source: Fact.MR
What are the defining numbers behind Medium and Heavy Duty Commercial Vehicles Market growth?
USD 276.2 billion absolute opportunity by 2036, led by Heavy Duty Commercial Vehicles, Diesel, Freight & Logistics, Transportation & Logistics Companies and OEM Sales.
- Demand Drivers in the Market
- Freight operators need tractors and rigid trucks that can carry required payloads while protecting fuel economy, driver productivity, delivery windows and asset utilization across long-haul and regional routes.
- Construction, mining and infrastructure contractors need vocational trucks with durable frames, power take-off integration, body-builder compatibility and service support near project locations.
- Public transport authorities and municipal buyers need buses, refuse trucks, utility vehicles and service fleets that meet procurement rules while controlling maintenance, emissions and whole-life cost.
- Fleet decarbonization programs need application-ready vehicles rather than technology demonstrations, making depot power, route energy, charging time, hydrogen supply, payload and residual value central to purchase approval.
- Key Segments Analyzed
- By Vehicle Type: Heavy Duty Commercial Vehicles are expected to hold 58% share in 2026 because Class 7 and Class 8 trucks carry the highest-value long-haul and vocational workloads.
- By Propulsion: Diesel is projected to account for 68% share in 2026 owing to its refueling reach, payload flexibility, established service base and suitability for high-mileage operations.
- By Application: Freight & Logistics is anticipated to capture 41% share in 2026 as long-haul transportation and last-mile freight generate recurring vehicle replacement and fleet expansion.
- By End User: Transportation & Logistics Companies are estimated to represent 44% share in 2026 because fleet operators and third-party logistics providers purchase vehicles around contracted freight volumes and route economics.
- By Sales Channel: OEM Sales are forecast to account for 72% share in 2026 driven by direct fleet contracts and dealer networks that bundle vehicles with financing, warranties, service and body integration.
- Analyst Opinion at Fact.MR
- Shambhu Nath Jha, Principal Consultant at Fact.MR, states: "Commercial vehicle purchasing is becoming a route-and-lifecycle decision. Fleets will not replace diesel tractors, urban distribution trucks, buses and vocational vehicles on one common timetable. Buyers will move where propulsion, payload, charging or refueling, service response and residual value can be proven together. Fact.MR opines that suppliers combining conventional powertrain efficiency with application-ready electric, hydrogen, connected and service packages will secure the strongest fleet access through 2036."
- Strategic Implications
- Vehicle manufacturers should organize product plans by duty cycle, payload, body configuration and route energy rather than treat medium-duty and heavy-duty buyers as one propulsion market.
- Dealer and service networks should build high-voltage, battery, fuel-cell and remote-diagnostic capability without weakening diesel uptime support for fleets that will operate mixed powertrains for many years.
- Fleet buyers should compare acquisition cost, fuel or electricity, infrastructure, payload, driver hours, maintenance, downtime and resale value within one replacement decision.
- Used-vehicle channels should strengthen inspection and certification for powertrain condition, battery health, emissions systems, telematics records and remaining warranty because residual value will influence new-vehicle economics.
How does the Medium and Heavy Duty Commercial Vehicles Market break down by segment?
Heavy Duty Commercial Vehicles lead at 58%, Diesel leads at 68%, Freight & Logistics leads at 41%, Transportation & Logistics Companies lead at 44% and OEM Sales lead at 72% in 2026.
Why do Heavy Duty Commercial Vehicles lead Vehicle Type?
Heavy Duty Commercial Vehicles hold 58% share in 2026.
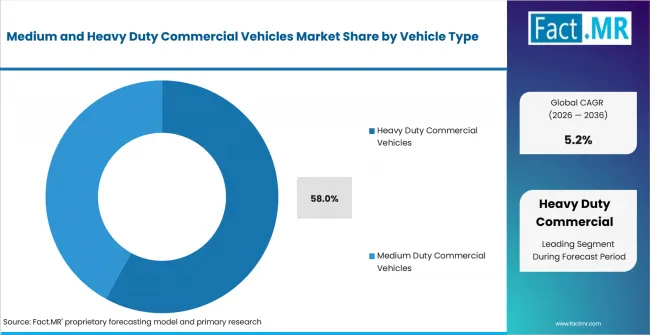
Medium And Heavy Duty Commercial Vehicles Market Analysis By Vehicle Type | Source: Fact.MR
Heavy Duty Commercial Vehicles are expected to hold 58% share in 2026 because Class 7 and Class 8 trucks combine high vehicle value with demanding long-haul, construction, mining and vocational specifications. Tractor buyers assess axle configuration, gross combination weight, cab design, engine or motor output, transmission, braking, aerodynamics, driver assistance and service coverage before releasing fleet orders. Class 7 trucks address regional haul and vocational work where body integration and maneuverability matter, while Class 8 trucks remain central to high-mileage freight and the heaviest duty cycles.
Medium Duty Commercial Vehicles serve local distribution, parcel delivery, utility work, municipal service and lighter construction assignments. Class 4 and Class 5-6 trucks benefit from return-to-base routes that can support electrification earlier than long-haul tractors. Their lower daily mileage does not remove commercial requirements: operators still need body payload, loading access, driver ergonomics, repair turnaround and predictable residual value. The segment therefore expands through route-specific replacement rather than a single technology shift across all classes.
Why does Diesel lead Propulsion?
Diesel accounts for 68% share in 2026.
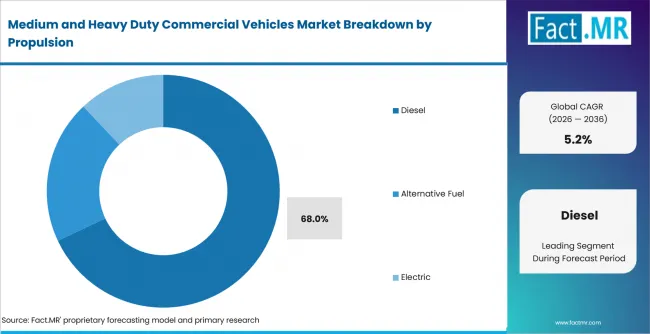
Medium And Heavy Duty Commercial Vehicles Market Analysis By Propulsion | Source: Fact.MR
Diesel is projected to account for 68% share in 2026 because it supports long range, fast refueling, high payload, mature maintenance practices and broad fuel availability across freight corridors and remote work sites. Conventional Diesel remains important in price-sensitive and high-utilization fleets, while Clean Diesel vehicles use newer engine, aftertreatment and control systems to meet tighter emissions requirements. Buyers continue to compare fuel consumption, aftertreatment durability, parts access and resale demand because these factors affect cost per mile over a long asset life.
Alternative Fuel vehicles use Natural Gas or Hydrogen Fuel Cell systems where fuel access and fleet concentration justify specialized infrastructure. Electric vehicles include Battery Electric Vehicles and Hybrid Electric Vehicles, with the strongest near-term fit in depot-based urban distribution, transit, refuse and regional operations. The International Energy Agency reported that electric truck sales more than doubled in 2025 and reached 9% of global truck sales, although most growth came from China and purchase prices remained materially above diesel in many markets. This creates a two-speed propulsion market: diesel protects broad operating coverage while zero-emission platforms advance first where routes and infrastructure can be controlled.
Why does Freight & Logistics lead Application?
Freight & Logistics captures 41% share in 2026.
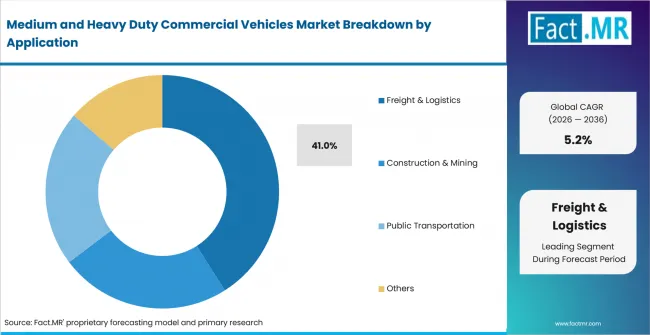
Medium And Heavy Duty Commercial Vehicles Market Analysis By Application | Source: Fact.MR
Freight & Logistics is anticipated to capture 41% share in 2026 because Long-Haul Transportation and Last-Mile Freight generate high vehicle utilization, scheduled replacement and direct sensitivity to fuel, labor and delivery performance. Long-haul fleets need tractors that can sustain payload and uptime across corridor networks. Last-mile fleets need maneuverable vehicles, body access and predictable daily energy use across dense delivery rounds. Both applications reward telematics, preventive maintenance and driver-support systems when they reduce missed deliveries or unplanned shop time.
Construction & Mining demand covers Dump Trucks and Concrete Mixers, where frame strength, axle load, body integration, site access and project timing determine orders. Public Transportation includes Transit Buses and Coaches purchased through government, operator and concession frameworks. Other applications cover Municipal Services, Defense and Utility Vehicles, where specifications can include power take-off equipment, emergency support, crew accommodation or specialized bodies. These alternatives create important vehicle value but their order timing is often tied to projects, budgets or tenders rather than continuous freight turnover.
Why do Transportation & Logistics Companies lead End User?
Transportation & Logistics Companies represent 44% share in 2026.
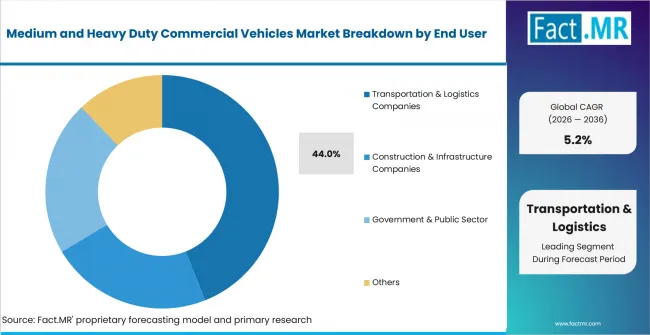
Medium And Heavy Duty Commercial Vehicles Market Analysis By End User | Source: Fact.MR
Transportation & Logistics Companies are estimated to represent 44% share in 2026 because Fleet Operators and Third-Party Logistics Providers connect vehicle purchasing directly to contracted lanes, shipper requirements, route density and asset utilization. Large fleets can negotiate direct terms, standardize specifications and measure fuel, maintenance and driver performance across many vehicles. Smaller logistics providers depend more heavily on dealer finance, used vehicles and outsourced maintenance, but they still replace assets when downtime or fuel cost threatens service reliability.
Construction & Infrastructure Companies purchase for project execution, with Construction Contractors and Mining Companies requiring body-specific vehicles that tolerate harsh sites and heavy loads. Government & Public Sector demand comes from Public Transit Authorities and Municipal Corporations, where procurement cycles, public funding and emissions goals shape timing. Other users, including Utilities, Defense Organizations and Industrial Enterprises, often require low-volume specialized configurations. Their buying decisions can carry high unit value even when annual order volumes are lower than freight fleets.
Why do OEM Sales lead Sales Channel?
OEM Sales hold 72% share in 2026.
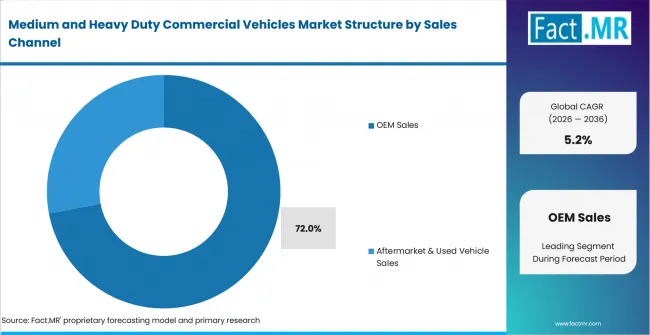
Medium And Heavy Duty Commercial Vehicles Market Analysis By Sales Channel | Source: Fact.MR
OEM Sales are forecast to account for 72% share in 2026 because Direct Fleet Sales and Dealer Networks connect the vehicle with warranty, finance, service, parts, telematics, driver training and body-builder coordination. Direct fleet agreements help large buyers manage common specifications and delivery schedules across regions. Dealers remain essential for smaller fleets and vocational customers that need local inventory, trade-in support and rapid service access. The channel also carries the compliance responsibility attached to new vehicle certification and emissions requirements.
Aftermarket & Used Vehicle Sales include Certified Pre-Owned vehicles and Independent Dealers. These channels help owner-operators, smaller contractors and budget-constrained fleets access equipment without new-vehicle pricing. Used-vehicle availability also influences new orders because fleet managers consider trade-in value and replacement timing together. Battery health certification, emissions-system condition and verified maintenance history become more important as the used market begins to handle a wider mix of diesel, hybrid and battery-electric assets.
What is accelerating Medium and Heavy Duty Commercial Vehicles Market adoption, and what is holding it back?
Freight replacement, regulatory renewal and route-specific propulsion programs are expected to support demand, while capital cost, infrastructure constraints and cyclical fleet spending can delay purchase decisions.
Drivers Impact Analysis
| DRIVER | QUALITATIVE RELEVANCE | GEOGRAPHIC RELEVANCE | IMPACT TIMELINE |
|---|---|---|---|
| Freight replacement tied to route capacity and service commitments | High | USA, Canada, UK and Germany | Current forecast period |
| Fleet renewal for fuel efficiency, emissions compliance and uptime | High | USA, Germany, Japan, Australia and South Korea | Medium term (2-4 years) |
| Construction, mining and infrastructure vehicle demand | Medium | Australia, Canada, USA and Germany | Medium term (2-4 years) |
| Public transport and municipal fleet replacement | Medium | South Korea, UK, Japan and Canada | Long term (>= 4 years) |
Source: Fact.MR analysis. Updated Aug 5, 2026
- Freight replacement and route capacity: Fleet operators replace vehicles when mileage, repair frequency, fuel use or driver downtime threatens contractual performance. A new truck is approved when its expected utilization and service coverage justify capital outlay across the intended route network.
- Efficiency and emissions renewal: New diesel platforms, hybrids and zero-emission vehicles enter fleets through different compliance and cost pathways. In the USA, EPA Phase 3 standards apply to heavy-duty vehicles beginning with model year 2027, keeping engine, aerodynamics, tires, powertrain controls and zero-emission options inside fleet planning.
- Vocational demand: Construction and mining vehicles are purchased around body type, axle loading, site conditions and project calendars. Suppliers with body-builder engineering and field service can convert infrastructure spending into vehicle orders more effectively than vendors offering a generic chassis alone.
- Public fleet renewal: Transit and municipal buyers combine service continuity with emissions, accessibility and public procurement requirements. Orders can be large, but depot readiness, tender rules and budget approval make timing less flexible than private freight replacement.
Opportunity Impact Analysis
| OPPORTUNITY | QUALITATIVE RELEVANCE | GEOGRAPHIC RELEVANCE | IMPACT TIMELINE |
|---|---|---|---|
| Battery-electric medium-duty and return-to-base fleets | High | USA, Canada, UK and South Korea | Short term (<= 2 years) |
| Hydrogen fuel-cell heavy-duty corridors and fleets | Medium | Japan, South Korea, Germany and Australia | Long term (>= 4 years) |
| OEM-integrated uptime, telematics and energy services | High | Global fleet markets | Medium term (2-4 years) |
| Certified pre-owned and lifecycle value programs | Medium | USA, Canada, UK, Germany, Japan and Australia | Long term (>= 4 years) |
Source: Fact.MR analysis. Updated Aug 5, 2026
- Battery-electric fleet conversion: Urban delivery, refuse, transit and regional operations offer the clearest early route because vehicles return to a depot and daily mileage can be modeled. Suppliers gain approval by proving usable payload, winter or hot-weather range, charging windows, battery warranty and maintenance response rather than relying on zero-emission claims alone.
- Hydrogen corridor development: Fuel-cell trucks can address longer range and faster refueling where hydrogen supply is dependable. Japan selected priority regions for fuel-cell commercial vehicles in May 2025, showing that deployment depends on concentrated vehicle demand and station planning rather than nationwide availability from the start.
- Integrated uptime services: Connected diagnostics, maintenance planning, parts forecasting and energy management can reduce unplanned stops and help mixed fleets compare vehicle performance. Revenue shifts toward providers that keep the asset operating after the initial sale instead of ending the customer relationship at delivery.
- Lifecycle and used-vehicle programs: Certified condition reports, battery-health records and remaining-warranty visibility can improve residual values. Stronger resale confidence lowers the perceived risk of adopting new propulsion because fleet managers can model exit value more credibly.
Restraints Impact Analysis
| RESTRAINT | QUALITATIVE RELEVANCE | GEOGRAPHIC RELEVANCE | IMPACT TIMELINE |
|---|---|---|---|
| High capital cost and financing burden for new powertrains | High | Global fleet markets | Short term (<= 2 years) |
| Depot power, public charging and hydrogen supply constraints | High | USA, Canada, Australia, UK and Germany | Medium term (2-4 years) |
| Payload, range and charging-time mismatch on demanding routes | Medium | Long-haul and remote operations | Medium term (2-4 years) |
| Freight-cycle weakness, interest rates and used-vehicle supply | Medium | Global fleet markets | Current forecast period |
Source: Fact.MR analysis. Updated Aug 5, 2026
- Capital and financing burden: A fleet may accept lower operating cost but still reject a vehicle when purchase price, charging equipment, facility upgrades or financing terms create an unacceptable payback period. This is particularly important for small carriers with limited borrowing capacity and uneven contract visibility.
- Infrastructure constraints: Commercial charging requires power availability, utility coordination, civil work, charger redundancy and operating schedules that fit dispatch. Hydrogen vehicles add station utilization and fuel-supply risk. Infrastructure delay can therefore postpone vehicle orders even after a fleet has selected a powertrain.
- Duty-cycle mismatch: Long-haul, heavy payload, extreme temperature and remote-site operations leave less margin for range loss or extended stops. Buyers will keep diesel or other established powertrains where a zero-emission vehicle cannot protect the required payload and dispatch pattern.
- Cyclical fleet spending: Truck orders move with freight rates, construction activity, financing cost, dealer inventory and used-vehicle prices. During weak cycles, fleets can extend asset age and spend on maintenance instead of placing new orders, creating temporary gaps between replacement need and purchase execution.
Which countries are scaling Medium and Heavy Duty Commercial Vehicles Market fastest?
South Korea 6.02%, USA 5.59%, Canada 5.24%, UK 5.01%, Australia 4.94%, Germany 4.79% and Japan 4.43% through 2036.
Regional analysis covers North America, Latin America, Western Europe, Eastern Europe, East Asia, South Asia and Pacific, and the Middle East and Africa. Country growth reflects different freight structures, vehicle ages, policy settings, infrastructure readiness and domestic manufacturing positions.
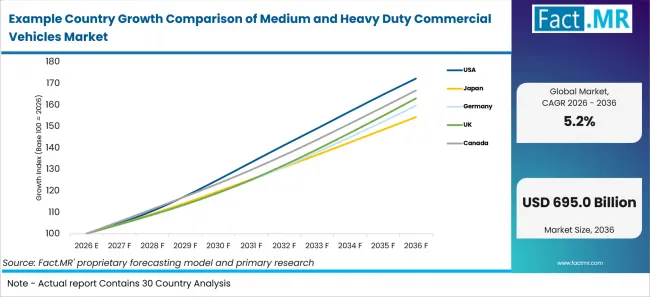
Example Country Growth Comparison Of Medium And Heavy Duty Commercial Vehicles Market | Source: Fact.MR
| COUNTRY | CAGR (2026-2036) |
|---|---|
| South Korea | 6.02% |
| USA | 5.59% |
| Canada | 5.24% |
| UK | 5.01% |
| Australia | 4.94% |
| Germany | 4.79% |
| Japan | 4.43% |
Source: Fact.MR analysis. Updated Aug 5, 2026
What is driving South Korea growth through 2036?
6.02% CAGR through 2036.
South Korea is projected to record 6.02% CAGR through 2036.
Demand is also shaped by dense urban logistics, port and industrial freight, bus replacement and domestic technology development. In April 2026, the Ministry of Land, Infrastructure and Transport announced the first permit for freight transport using automated trucks on expressways. Automation does not replace the need for vehicles, but it raises the value of integrated braking, sensing, connectivity, maintenance and fleet-control systems. Buyers still need dependable charging, payload and service support, so adoption is expected to advance first in controlled routes and fleet programs before spreading across every heavy-duty use case.
What supports USA demand?
5.59% CAGR through 2036.
The USA is expected to post 5.59% CAGR through 2036.
Regulation and infrastructure investment are changing replacement specifications. EPA Phase 3 greenhouse-gas standards begin with model year 2027 and become more stringent through model year 2032. In January 2025, the U.S. Department of Energy announced a $68 million investment in heavy-duty EV charging demonstrations near ports, distribution hubs and major corridors. These measures create opportunity for vehicle and charging suppliers, but fleets will release orders only when vehicles meet route range, driver scheduling, power availability and service-response requirements. Financing conditions and freight cycles can still delay replacement even when new technology is technically suitable.
How is Canada scaling demand?
5.24% CAGR through 2036.
Canada is forecast to expand at 5.24% CAGR through 2036.
The Incentives for Medium- and Heavy-Duty Zero-Emission Vehicles program supported more than 6,500 incentive requests before closing, and the Zero-Emission Trucking Program continues technical work on safe deployment, route analysis and charging or refueling. Canadian buyers face long distances, cold-weather energy demand, dispersed service requirements and provincial differences. Return-to-base delivery, transit and refuse fleets can move faster than remote or long-haul operations. Suppliers that combine vehicle availability with winter validation, dealer support, cross-border service and infrastructure planning have the clearest commercial route.
What supports the UK outlook?
5.01% CAGR through 2036.
The UK is anticipated to advance at 5.01% CAGR through 2036.
Dense routes and depot operations support battery-electric medium-duty trucks, buses and selected regional HGV applications, while long-distance and high-payload fleets continue to depend on diesel efficiency and broad service coverage. Fleet buyers assess low-emission zones, energy cost, depot power, payload, finance and driver time together. The market can move quickly where vehicles return to the same site and charging fits overnight or scheduled dwell periods. It can move slowly where public high-power charging or property-grid upgrades are uncertain. Used-vehicle values and maintenance capacity remain important because many operators manage mixed-age fleets rather than replace all assets at once.
How is Australia developing demand?
4.94% CAGR through 2036.
Australia is projected to record 4.94% CAGR through 2036.
Vehicle specifications must account for long routes, high ambient temperatures, remote service access, heavy combinations and body-builder requirements. Australia made ADR 80/04, a Euro VI-equivalent noxious-emissions standard, mandatory for all new heavy vehicles supplied from November 1, 2025. That change supports cleaner diesel renewal while battery-electric trucks develop in urban and return-to-base fleets. Hydrogen and other alternatives remain route-dependent. Suppliers that can maintain parts and service outside major cities retain an advantage because downtime can be more costly than incremental fuel savings in remote operations.
What is shaping Germany growth?
4.79% CAGR through 2036.
Germany is estimated to post 4.79% CAGR through 2036.
Zero-emission heavy-duty vehicles are exempt from German HGV tolls until June 30, 2031. This improves the operating case for battery-electric and hydrogen trucks on suitable routes, but purchase timing still depends on depot power, corridor charging, payload and vehicle availability. Diesel renewal remains important for fleets that need immediate cross-border flexibility and mature service. German buyers are likely to favor manufacturers that can offer efficient combustion vehicles, zero-emission alternatives, financing, digital fleet services and reliable workshops within one portfolio rather than force a single propulsion choice across every duty cycle.
What underpins Japan demand?
4.43% CAGR through 2036.
Japan is expected to grow at 4.43% CAGR through 2036.
Japan is pursuing multiple propulsion paths. Diesel and hybrid trucks remain relevant across urban distribution and regional freight, while battery-electric vehicles fit shorter controlled routes. In May 2025, the Ministry of Economy, Trade and Industry selected priority regions for promoting fuel-cell commercial vehicles, linking truck and bus deployment with hydrogen station utilization. Commercial progress therefore depends on local concentration of vehicles, infrastructure and operators. Suppliers that offer compact vehicle packages, strong dealer support and technology matched to Japanese route and loading conditions are positioned better than vendors relying on global specifications without local adaptation.
Who leads the Medium and Heavy Duty Commercial Vehicles Market?
Daimler Truck Holding AG is an active provider in the market. Volvo Group, Traton SE and PACCAR Inc. provide broad multinational truck portfolios, while the remaining providers strengthen coverage across China, Japan, India and regional commercial-vehicle applications.
Daimler Truck Holding AG competes across Trucks North America, Mercedes-Benz Trucks, Trucks Asia, Daimler Buses and Financial Services. Its commercial position depends on vehicle platforms, dealer and workshop coverage, financing, connected services and the ability to support both diesel and zero-emission fleets. Volvo Group combines trucks, buses, financing and services, with product renewal and service revenue used to protect customer uptime through the freight cycle. These providers sell an operating system around the vehicle rather than a chassis alone.
Traton SE uses Scania, MAN, International and Volkswagen Truck & Bus to cover premium heavy-duty transport, European and emerging-market trucks, North American fleets and financial services. PACCAR Inc. competes through Kenworth, Peterbilt and DAF alongside parts and finance. FAW Group Corporation and Dongfeng Motor Corporation add China-based scale, while Isuzu Motors Limited and Hino Motors, Ltd. strengthen Japanese and international medium- and heavy-duty coverage. Ashok Leyland Limited and Tata Motors Limited bring extensive commercial vehicle portfolios for India and other value-sensitive markets.
Competition through 2036 is expected to center on duty-cycle coverage, fuel efficiency, battery or fuel-cell performance, safety, software, financing and service response. Diesel product strength remains commercially important because fleets cannot convert all routes at once. At the same time, manufacturers need credible zero-emission vehicles, charging or hydrogen partnerships and trained service networks. Providers that protect residual values and keep mixed-powertrain fleets operating will gain stronger fleet relationships than suppliers focused only on launch announcements.
Which companies are the key providers?
Daimler Truck Holding AG has the competitive position in 2026. Volvo Group, Traton SE, PACCAR Inc., FAW Group Corporation, Dongfeng Motor Corporation, Isuzu Motors Limited, Ashok Leyland Limited, Tata Motors Limited and Hino Motors, Ltd. complete the profiled company set.
- Daimler Truck Holding AG
- Volvo Group
- Traton SE
- PACCAR Inc.
- FAW Group Corporation
- Dongfeng Motor Corporation
- Isuzu Motors Limited
- Ashok Leyland Limited
- Tata Motors Limited
- Hino Motors, Ltd.
Bibliography
- International Energy Agency. (2026, May 20). Global EV Outlook 2026. IEA.
- U.S. Environmental Protection Agency. (2024, March 29). Final Rule: Greenhouse Gas Emissions Standards for Heavy-Duty Vehicles - Phase 3. EPA.
- U.S. Department of Energy. (2025, January 15). DOE Invests $68 Million in Innovative Heavy-Duty Electric Vehicle Charging Solutions. Department of Energy.
- Department for Transport. (2026, May 27). Domestic Road Freight Statistics, United Kingdom: 2025. GOV.UK.
- Transport Canada. (2025, September 26). Incentives for Medium and Heavy-Duty Zero-Emission Vehicles Program. Government of Canada.
- Transport Canada. (2026, April 10). Zero-Emission Trucking Program. Government of Canada.
- Federal Ministry of Transport. (2026, February 27). The HGV Tolling Scheme. Federal Republic of Germany.
- Ministry of Economy, Trade and Industry. (2025, May 19). First Selection of Priority Regions for Promoting the Deployment of Fuel-Cell Commercial Vehicles. Government of Japan.
- Ministry of Land, Infrastructure, Transport and Tourism. (2025). Summary of the White Paper on Land, Infrastructure, Transport and Tourism in Japan 2025. Government of Japan.
- Bureau of Infrastructure and Transport Research Economics. (2025). Road Vehicles, Australia, January 2025. Australian Government.
- Department of Infrastructure, Transport, Regional Development, Communications, Sport and the Arts. (2025). Questions and Answers on the New ADR 80/04. Australian Government.
- National Heavy Vehicle Regulator. (2025). Heavy Vehicle Productivity Plan 2025-2030. Australian Government.
- Ministry of Environment. (2025, January 2). 2025 Electric Vehicle Purchase Subsidy Reform. Government of the Republic of Korea.
- Ministry of Environment. (2025, November 16). Annual EV Supply Hits 200,000. Government of the Republic of Korea.
- Ministry of Land, Infrastructure and Transport. (2026, April 17). Korea Opens Expressways to Automated Driving Trucks. Government of the Republic of Korea.
- Daimler Truck Holding AG. (2026, March 12). Annual Results Conference 2026: Fiscal Year 2025. Daimler Truck.
- Volvo Group. (2026, February 26). Volvo Group Publishes Annual Report 2025. Volvo Group.
- Traton SE. (2026). Key Information About the Traton Group. Annual Report 2025.
- PACCAR Inc. (2026, January 27). PACCAR Achieves Very Good Annual Revenues and Net Income. PACCAR Inc.
This Report Answers
- The report provides strategic intelligence on Medium and Heavy Duty Commercial Vehicles across Vehicle Type, Propulsion, Application, End User and Sales Channel.
- Segment analysis covers Heavy Duty Commercial Vehicles and Diesel as the leading categories within the 2026 market structure.
- Application assessment compares Freight & Logistics with Construction & Mining, Public Transportation and municipal, defense and utility uses.
- Country outlook evaluates South Korea, USA, Canada, UK, Australia, Germany and Japan using the stated CAGR framework through 2036.
- Competitive analysis profiles Daimler Truck Holding AG alongside Volvo Group, Traton SE, PACCAR Inc. and six additional commercial vehicle manufacturers.
- Commercial assessment addresses fleet replacement, propulsion transition, route economics, charging and hydrogen infrastructure, service networks, financing, residual value and used-vehicle channels.
What does the Medium and Heavy Duty Commercial Vehicles Market cover?
Complete medium- and heavy-duty commercial vehicles sold for freight, logistics, construction, mining, public transportation, municipal, defense, utility and industrial use.
The market covers Class 4 through Class 8 truck categories and the commercial-vehicle configurations represented within the application taxonomy. Propulsion coverage includes Conventional Diesel, Clean Diesel, Natural Gas, Hydrogen Fuel Cell, Battery Electric Vehicles and Hybrid Electric Vehicles. Sales are assessed through OEM direct fleet and dealer routes alongside certified pre-owned and independent used-vehicle channels.
The commercial value lies in the complete vehicle and its configured use. Chassis, cab, powertrain, safety systems, software, body integration and compliance are considered together when they form part of the delivered vehicle. The market is distinct from stand-alone components, charging infrastructure, fuel supply, freight services and vehicle maintenance revenue.
What is included in the scope?
New and used medium- and heavy-duty commercial vehicles sold through the stated vehicle, propulsion, application, end-user and sales-channel categories.
The scope includes complete vehicles and chassis-cab platforms intended for road freight, last-mile distribution, construction, mining, transit, coach, municipal, utility, defense and industrial service. OEM Sales include Direct Fleet Sales and Dealer Networks. Aftermarket & Used Vehicle Sales include Certified Pre-Owned and Independent Dealers. Alternative propulsion is included when the commercial vehicle uses natural gas, hydrogen fuel-cell, battery-electric or hybrid-electric systems within the defined classes and applications.
What is excluded from the scope?
Light-duty vehicles below the defined medium-duty classes, passenger cars, trailers, stand-alone components and services are outside the scope.
The scope excludes Class 1-3 light commercial vehicles, passenger cars, motorcycles, stand-alone trailers, construction machinery that is not a road commercial vehicle, engines and batteries sold separately, replacement parts, tires, telematics subscriptions, maintenance labor, fuel, electricity, charging hardware, hydrogen stations, financing interest and freight transportation service revenue. Specialized armored fighting vehicles and military weapon systems are excluded, although commercial vehicle platforms purchased for defense logistics remain within the Defense application category.
How Was the Analysis Built?
120+ sources, 40+ company and vehicle portfolios, 25+ countries, and 20+ interviews.
- Primary Research: Primary research includes interviews with commercial vehicle manufacturers, fleet operators, third-party logistics providers, dealers, body builders, leasing and finance specialists, maintenance managers, public transport buyers, construction contractors, mining operators and infrastructure providers. Discussions test replacement timing, vehicle specification, duty cycle, payload, fuel or energy use, downtime, service access, financing, charging or refueling readiness and residual-value expectations.
- Desk Research: Desk research reviews official freight statistics, vehicle registration data, emissions standards, toll rules, zero-emission vehicle programs, charging and hydrogen initiatives, transport white papers, company reports, brand portfolios and technical information. Public sources support the qualitative discussion of country operating conditions and provider roles.
- Market-Sizing and Forecasting: Forecasting uses vehicle sales and fleet stock, age and replacement cycles, freight and construction activity, bus and municipal procurement, class mix, propulsion attachment, average vehicle value, sales-channel behavior and country-specific operating conditions. The model also considers how route length, payload, depot control, energy infrastructure, emissions regulation, financing and used-vehicle values affect adoption across medium-duty and heavy-duty categories.
- Data Validation and Update Cycle: The analysis combines primary interviews with structured review of public company disclosures, official statistics, regulatory material, and sector publications. Forecast interpretation considers market conditions, adoption requirements, competitive positioning, and regional operating context.
Segmentation
What is the report scope and coverage?
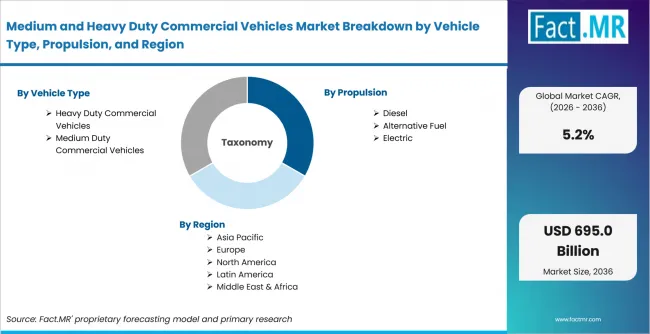
Medium And Heavy Duty Commercial Vehicles Market Breakdown By Vehicle Type, Propulsion, And Region | Source: Fact.MR
| Attribute | Details |
|---|---|
| Quantitative Units | USD Billion |
| Market Definition | Commercial sales value of complete medium- and heavy-duty commercial vehicles covered by the defined vehicle, propulsion, application, end-user and sales-channel taxonomy |
| Vehicle Type | Heavy Duty Commercial Vehicles; Medium Duty Commercial Vehicles |
| Propulsion | Diesel; Alternative Fuel; Electric |
| Application | Freight & Logistics; Construction & Mining; Public Transportation; Others |
| End User | Transportation & Logistics Companies; Construction & Infrastructure Companies; Government & Public Sector; Others |
| Sales Channel | OEM Sales; Aftermarket & Used Vehicle Sales |
| Regions Covered | North America; Latin America; Western Europe; Eastern Europe; East Asia; South Asia and Pacific; Middle East and Africa |
| Countries Covered | USA; Japan; Germany; UK; Canada; Australia; South Korea |
| Key Companies Profiled | Daimler Truck Holding AG; Volvo Group; Traton SE; PACCAR Inc.; FAW Group Corporation; Dongfeng Motor Corporation; Isuzu Motors Limited; Ashok Leyland Limited; Tata Motors Limited; Hino Motors, Ltd. |
| Forecast Period | 2026 to 2036 |
| Approach | Hybrid top-down and bottom-up assessment using vehicle sales, fleet replacement, freight activity, vocational demand, propulsion adoption, country regulation, channel structure and provider portfolio validation |
Source: Fact.MR analysis. Updated Aug 5, 2026
How is the market segmented?
-
By Vehicle Type:
- Heavy Duty Commercial Vehicles
- Class 7 Trucks
- Class 8 Trucks
- Medium Duty Commercial Vehicles
- Class 4 Trucks
- Class 5–6 Trucks
- Heavy Duty Commercial Vehicles
-
By Propulsion:
- Diesel
- Conventional Diesel
- Clean Diesel
- Alternative Fuel
- Natural Gas
- Hydrogen Fuel Cell
- Electric
- Battery Electric Vehicles
- Hybrid Electric Vehicles
- Diesel
-
By Application:
- Freight & Logistics
- Long-Haul Transportation
- Last-Mile Freight
- Construction & Mining
- Dump Trucks
- Concrete Mixers
- Public Transportation
- Transit Buses
- Coaches
- Others
- Municipal Services
- Defense
- Utility Vehicles
- Freight & Logistics
-
By End User:
- Transportation & Logistics Companies
- Fleet Operators
- Third-Party Logistics Providers
- Construction & Infrastructure Companies
- Construction Contractors
- Mining Companies
- Government & Public Sector
- Public Transit Authorities
- Municipal Corporations
- Others
- Utilities
- Defense Organizations
- Industrial Enterprises
- Transportation & Logistics Companies
-
By Sales Channel:
- OEM Sales
- Direct Fleet Sales
- Dealer Networks
- Aftermarket & Used Vehicle Sales
- Certified Pre-Owned
- Independent Dealers
- OEM Sales
-
By Region:
- North America
- USA
- Canada
- Latin America
- Western Europe
- Germany
- UK
- Eastern Europe
- East Asia
- Japan
- South Korea
- South Asia and Pacific
- Australia
- Middle East and Africa
- North America
Frequently Asked Questions
What is the Medium and Heavy Duty Commercial Vehicles Market worth in 2026?
What is the market forecast for 2036?
Which Vehicle Type leads the market?
Which Propulsion leads the market?
Which Application leads the market?
Which End User leads the market?
Which Sales Channel leads the market?
Which country records the highest CAGR?
How does the USA perform?
How does Canada perform?
How does the UK perform?
How does Australia perform?
How does Germany perform?
How does Japan perform?
Which companies are active in the market?
What is the primary driver in the market?
What is the main restraint in the market?
Why does Diesel remain important?
Where is the clearest electric-vehicle opportunity?
Who worked on this report


Preview the report firsthand - request a free sample
Free SampleGet the brochure for pricing and purchase details
Download PDF